Europe - Frozen Food Market 2024-2028
The Europe - Frozen Food Market size is projected to increase by USD 31.2 billion and the market size is estimated to grow at a CAGR of 6.8% between 2023 and 2028.
The report includes a comprehensive outlook on the Europe Frozen Food Market, offering forecasts for the industry segmented by Distribution Channel, which comprises offline and online. Additionally, it categorizes Product into frozen ready meals, frozen fish and seafood, frozen meat and poultry, frozen fruits and vegetables, and others. The report provides market size, historical data spanning from 2018 to 2022, and future projections, all presented in terms of value in USD billion for each of the mentioned segments.
The introduction of innovative and sustainable packaging by leading players is the key factor driving the market growth. Packaging innovations, apart from attracting consumers, help increase the shelf life and durability of products. Innovative pouch packaging is one such method used by market players to avoid the loss of nutrients in frozen snacks. Globally, packaging solution providers have started focusing on launching environmentally sustainable packaging solutions such as recyclable frozen food packaging, biodegradable frozen snacks packaging, and eco-friendly frozen packaging. Europe - frozen snack food market players are delivering advanced packaging solutions that are environmentally sustainable. As a result, a greater number of vendors have started offering sustainable packaging for their frozen snacks in the market. This is considered to be a major factor driving the growth of the market during the forecast period.
Europe Frozen Food Market: Overview
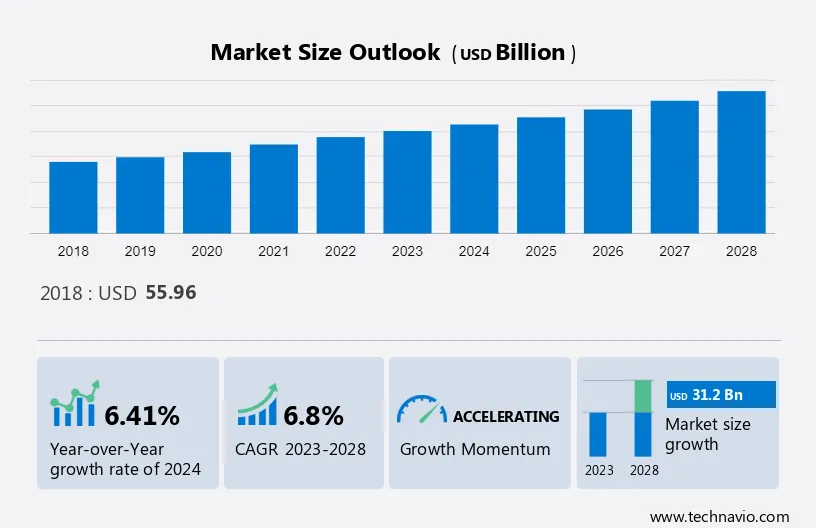
The Europe Frozen Food Market shows an Accelerated CAGR during the forecast period.
To get additional information about the market, Request Free Sample
Trends
The rising importance of clean-label ingredients is the primary trend shaping market growth. Clean-label ingredients are those that are minimally processed and do not contain any artificial additives or preservatives. Consumers are becoming increasingly aware of the impact that their food choices have on their health and are seeking out products that are made with natural, wholesome ingredients. Furthermore, to meet the demand for clean-label frozen food, many manufacturers are reformulating their products to include natural ingredients and removing artificial additives.
In addition, some manufacturers are also using alternative protein sources, such as tofu or plant-based meats, to appeal to consumers who are looking for meat-free options. Overall, the trend toward clean-label frozen food in Europe is expected to continue to grow as consumers become more health-conscious and environmentally aware. Hence, the rising importance of clean-label ingredients boosts the growth of the market during the forecast period.
Challenge
Health risks associated with the consumption of frozen ready meals is the major challenge impeding the market growth. Processed foods that have been frozen are kept at a low temperature to extend their shelf life and prevent spoiling. Cheaper ingredients are frequently used in place of healthy ones by manufacturers of frozen foods. For instance, nutrition-dense olive oil is often substituted with less effective rapeseed oil, which results in the loss of antioxidants present in frozen foods.
Moreover, consuming frozen-ready meals frequently leads to obesity, diabetes, dementia, and renal disease. The frequent consumption of frozen food also puts consumers at risk of developing high blood pressure and other health-related problems. Thus, increased consumer awareness regarding frozen food will hamper the growth of the Europe frozen food market during the forecast period.
Europe Frozen Food Market Segmentation by Product
Frozen ready meals are complete meals that do not require additional ingredients. The frozen ready meals segment comprises frozen pizza, frozen pasta, frozen croissants, frozen Asian meals, frozen rice bowls, frozen noodle bowls, frozen crispy pancakes, and frozen pies, among other products. Furthermore, prominent market players offering frozen-ready meals globally include Nomad Foods, Tyson Foods, and others. Frozen ready meals are increasingly popular in countries such as the UK, France, and Spain. Packaging innovations and increasing new product launches are anticipated to drive the growth of the frozen ready-meal segment of the Europe - frozen food market during the forecast period.
Europe Frozen Food Market Segmentation by Distribution Channel
The market share growth by the offline segment will be significant during the forecast period. In Europe, there has been a premiumization of the frozen food market, with consumers willing to pay more for premium, all-natural, and organic frozen food products. In response, offline stores in Europe such as supermarkets and hypermarkets have increased the selection of premium frozen food items they offer, such as premium ready meals, organic frozen fruits and vegetables, and premium meat and seafood.
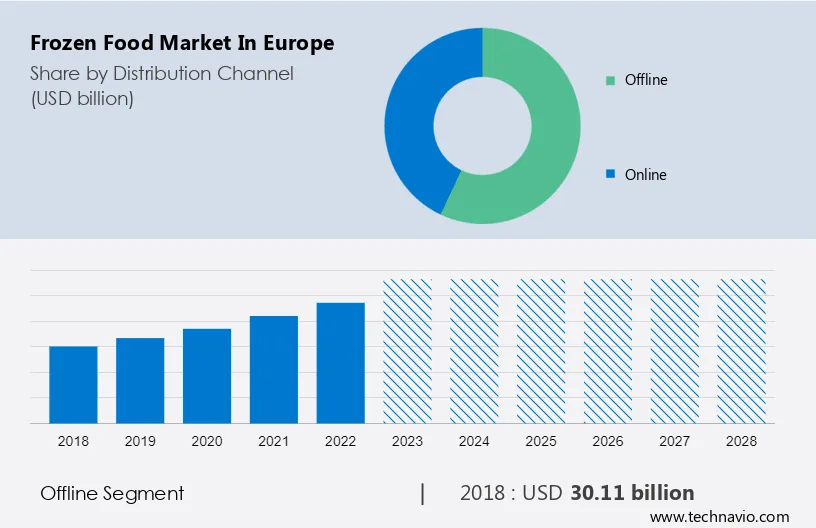
The offline segment was valued at USD 30.11 billion in 2018.
For a detailed summary of the market segments Request for Sample Report
Supermarkets and hypermarkets are the main sales outlets for frozen food products in Europe, where the offline distribution channel continues to be the dominant sales channel. These shops serve as a convenient one-stop shop for customers to buy all of their grocery requirements and offer a wide variety of frozen food products, including fruits, vegetables, ready meals, meat, and seafood. These elements are anticipated to boost offline market demand even more and propel market growth during the forecast period.
Company Overview
Companies are implementing various strategies, such as strategic alliances, partnerships, mergers and acquisitions, geographical expansion, and product/service launches, to enhance their presence in the market.
- Key Offering- Ajinomoto Co. Inc.: The company offers frozen food such as gyoza, fried rice, and noodles.
- Key Offering- Aryzta AG: The company offers frozen food such as cakes, icings, and dessert specialities.
- Key Offering- BRF SA: The company offers frozen food such as meats, pizzas, pastas, and frozen vegetables.
The Europe frozen food market report also includes detailed analyses of the competitive landscape of the market and information about 20 market companies, including:
- Cargill Inc.
- Dr. August Oetker KG
- General Mills Inc.
- Iceland Foods Ltd.
- JBS SA
- Lantmannen Unibake International
- McCain Foods Ltd.
- Nestle SA
- Nomad Foods Ltd.
- Orkla ASA
- The Kraft Heinz Co.
- Tyson Foods Inc.
- CONGELADOS CIENTOCINCO, S.L.
- FRoSTA AG
- Iceland Frozen Foods
- THIS.CO
- ULTRACONGELADOS VIRTO, SAU
Qualitative and quantitative analysis of companies has been conducted to help clients understand the wider business environment as well as the strengths and weaknesses of key market players. Data is qualitatively analyzed to categorize companies as pure play, category-focused, industry-focused, and diversified; it is quantitatively analyzed to categorize companies as dominant, leading, strong, tentative, and weak.
Segment Overview
The Europe frozen food market report forecasts market growth by revenue and provides an analysis of the latest trends and growth opportunities from 2018 to 2028.
- Distribution Channel Outlook
- Product Outlook
- Frozen ready meals
- Frozen fish and seafood
- Frozen meat and poultry
- Frozen fruits and vegetables
- Others
|
Europe Frozen Food Market Scope
|
|
Report Coverage
|
Details
|
|
Page number
|
160
|
|
Base year
|
2023
|
|
Historic period
|
2018-2022
|
|
Forecast period
|
2024-2028
|
|
Growth momentum & CAGR
|
Accelerate at a CAGR of 6.8%
|
|
Market Growth 2024-2028
|
USD 31.2 billion
|
|
Market structure
|
Fragmented
|
|
YoY growth 2023-2024(%)
|
6.41
|
|
Competitive landscape
|
Leading Companies, Market Positioning of Companies, Competitive Strategies, and Industry Risks |
|
Key companies profiled
|
Ajinomoto Co. Inc., Aryzta AG, BRF SA, Cargill Inc., Dr. August Oetker KG, General Mills Inc., Iceland Foods Ltd., JBS SA, Lantmannen Unibake International, McCain Foods Ltd., Nestle SA, Nomad Foods Ltd., Orkla ASA, The Kraft Heinz Co., Tyson Foods Inc., CONGELADOS CIENTOCINCO, S.L., FRoSTA AG, Iceland Frozen Foods, THIS.CO, and ULTRACONGELADOS VIRTO, SAU
|
|
Market dynamics
|
Parent market analysis, Market growth inducers and obstacles, Fast-growing and slow-growing segment analysis, COVID-19 impact and recovery analysis and future consumer dynamics, Market condition analysis for the forecast period
|
|
Customization purview
|
If our report has not included the data that you are looking for, you can reach out to our analysts and get segments customized.
|
BUY NOW Full Report and Discover more
What are the Key Data Covered in this Europe Frozen Food Market Report?
- CAGR of the market during the forecast period
- Detailed information on factors that will drive the growth of the market between 2024 and 2028
- Precise estimation of the Europe frozen food market size and its contribution to the market in focus on the parent market
- Accurate predictions about upcoming trends and changes in consumer behavior
- Growth of the market across Europe
- A thorough analysis of the market’s competitive landscape and detailed information about companies
- Comprehensive analysis of factors that will challenge the growth of Europe frozen food market companies
We can help! Our analysts can customize this market research report to meet your requirements. Get in touch
1 Executive Summary
- 1.1 Market overview
- Exhibit 01: Executive Summary – Chart on Market Overview
- Exhibit 02: Executive Summary – Data Table on Market Overview
- Exhibit 03: Executive Summary – Chart on Country Market Characteristics
- Exhibit 04: Executive Summary – Chart on Market by Geography
- Exhibit 05: Executive Summary – Chart on Market Segmentation by Distribution Channel
- Exhibit 06: Executive Summary – Chart on Market Segmentation by Product
- Exhibit 07: Executive Summary – Chart on Incremental Growth
- Exhibit 08: Executive Summary – Data Table on Incremental Growth
- Exhibit 09: Executive Summary – Chart on Vendor Market Positioning
2 Market Landscape
- 2.1 Market ecosystem
- Exhibit 10: Parent market
- Exhibit 11: Market Characteristics
3 Market Sizing
- 3.1 Market definition
- Exhibit 12: Offerings of vendors included in the market definition
- 3.2 Market segment analysis
- Exhibit 13: Market segments
- 3.4 Market outlook: Forecast for 2023-2028
- Exhibit 14: Chart on Europe - Market size and forecast 2023-2028 ($ billion)
- Exhibit 15: Data Table on Regional - Market size and forecast 2023-2028 ($ billion)
- Exhibit 16: Chart on Europe: Year-over-year growth 2023-2028 (%)
- Exhibit 17: Data Table on Regional - Market size and forecast 2023-2028 ($ billion)
4 Historic Market Size
- 4.1 Frozen food market in Europe 2018 - 2022
- Exhibit 18: Historic Market Size – Data Table on frozen food market in Europe 2018 - 2022 ($ billion)
- 4.2 Distribution Channel Segment Analysis 2018 - 2022
- Exhibit 19: Historic Market Size – Distribution Channel Segment 2018 - 2022 ($ billion)
- 4.3 Product Segment Analysis 2018 - 2022
- Exhibit 20: Historic Market Size – Product Segment 2018 - 2022 ($ billion)
- 4.4 Geography Segment Analysis 2018 - 2022
- Exhibit 21: Historic Market Size – Geography Segment 2018 - 2022 ($ billion)
5 Five Forces Analysis
- 5.1 Five forces summary
- Exhibit 22: Five forces analysis - Comparison between 2023 and 2028
- 5.2 Bargaining power of buyers
- Exhibit 23: Chart on Bargaining power of buyers – Impact of key factors 2023 and 2028
- 5.3 Bargaining power of suppliers
- Exhibit 24: Bargaining power of suppliers – Impact of key factors in 2023 and 2028
- 5.4 Threat of new entrants
- Exhibit 25: Threat of new entrants – Impact of key factors in 2023 and 2028
- 5.5 Threat of substitutes
- Exhibit 26: Threat of substitutes – Impact of key factors in 2023 and 2028
- 5.6 Threat of rivalry
- Exhibit 27: Threat of rivalry – Impact of key factors in 2023 and 2028
- 5.7 Market condition
- Exhibit 28: Chart on Market condition - Five forces 2023 and 2028
6 Market Segmentation by Distribution Channel
- 6.1 Market segments
- Exhibit 29: Chart on Distribution Channel - Market share 2023-2028 (%)
- Exhibit 30: Data Table on Distribution Channel - Market share 2023-2028 (%)
- 6.2 Comparison by Distribution Channel
- Exhibit 31: Chart on Comparison by Distribution Channel
- Exhibit 32: Data Table on Comparison by Distribution Channel
- 6.3 Offline - Market size and forecast 2023-2028
- Exhibit 33: Chart on Offline - Market size and forecast 2023-2028 ($ billion)
- Exhibit 34: Data Table on Offline - Market size and forecast 2023-2028 ($ billion)
- Exhibit 35: Chart on Offline - Year-over-year growth 2023-2028 (%)
- Exhibit 36: Data Table on Offline - Year-over-year growth 2023-2028 (%)
- 6.4 Online - Market size and forecast 2023-2028
- Exhibit 37: Chart on Online - Market size and forecast 2023-2028 ($ billion)
- Exhibit 38: Data Table on Online - Market size and forecast 2023-2028 ($ billion)
- Exhibit 39: Chart on Online - Year-over-year growth 2023-2028 (%)
- Exhibit 40: Data Table on Online - Year-over-year growth 2023-2028 (%)
- 6.5 Market opportunity by Distribution Channel
- Exhibit 41: Market opportunity by Distribution Channel ($ billion)
- Exhibit 42: Data Table on Market opportunity by Distribution Channel ($ billion)
7 Market Segmentation by Product
- 7.1 Market segments
- Exhibit 43: Chart on Product - Market share 2023-2028 (%)
- Exhibit 44: Data Table on Product - Market share 2023-2028 (%)
- 7.2 Comparison by Product
- Exhibit 45: Chart on Comparison by Product
- Exhibit 46: Data Table on Comparison by Product
- 7.3 Frozen ready meals - Market size and forecast 2023-2028
- Exhibit 47: Chart on Frozen ready meals - Market size and forecast 2023-2028 ($ billion)
- Exhibit 48: Data Table on Frozen ready meals - Market size and forecast 2023-2028 ($ billion)
- Exhibit 49: Chart on Frozen ready meals - Year-over-year growth 2023-2028 (%)
- Exhibit 50: Data Table on Frozen ready meals - Year-over-year growth 2023-2028 (%)
- 7.4 Frozen fish and seafood - Market size and forecast 2023-2028
- Exhibit 51: Chart on Frozen fish and seafood - Market size and forecast 2023-2028 ($ billion)
- Exhibit 52: Data Table on Frozen fish and seafood - Market size and forecast 2023-2028 ($ billion)
- Exhibit 53: Chart on Frozen fish and seafood - Year-over-year growth 2023-2028 (%)
- Exhibit 54: Data Table on Frozen fish and seafood - Year-over-year growth 2023-2028 (%)
- 7.5 Frozen meat and poultry - Market size and forecast 2023-2028
- Exhibit 55: Chart on Frozen meat and poultry - Market size and forecast 2023-2028 ($ billion)
- Exhibit 56: Data Table on Frozen meat and poultry - Market size and forecast 2023-2028 ($ billion)
- Exhibit 57: Chart on Frozen meat and poultry - Year-over-year growth 2023-2028 (%)
- Exhibit 58: Data Table on Frozen meat and poultry - Year-over-year growth 2023-2028 (%)
- 7.6 Frozen fruits and vegetables - Market size and forecast 2023-2028
- Exhibit 59: Chart on Frozen fruits and vegetables - Market size and forecast 2023-2028 ($ billion)
- Exhibit 60: Data Table on Frozen fruits and vegetables - Market size and forecast 2023-2028 ($ billion)
- Exhibit 61: Chart on Frozen fruits and vegetables - Year-over-year growth 2023-2028 (%)
- Exhibit 62: Data Table on Frozen fruits and vegetables - Year-over-year growth 2023-2028 (%)
- 7.7 Others - Market size and forecast 2023-2028
- Exhibit 63: Chart on Others - Market size and forecast 2023-2028 ($ billion)
- Exhibit 64: Data Table on Others - Market size and forecast 2023-2028 ($ billion)
- Exhibit 65: Chart on Others - Year-over-year growth 2023-2028 (%)
- Exhibit 66: Data Table on Others - Year-over-year growth 2023-2028 (%)
- 7.8 Market opportunity by Product
- Exhibit 67: Market opportunity by Product ($ billion)
- Exhibit 68: Data Table on Market opportunity by Product ($ billion)
8 Customer Landscape
- 8.1 Customer landscape overview
- Exhibit 69: Analysis of price sensitivity, lifecycle, customer purchase basket, adoption rates, and purchase criteria
9 Geographic Landscape
- 9.1 Geographic segmentation
- Exhibit 70: Chart on Market share by geography - 2023-2028 (%)
- Exhibit 71: Data Table on Market share by geography - 2023-2028 (%)
- 9.2 Geographic comparison
- Exhibit 72: Chart on Geographic comparison
- Exhibit 73: Data Table on Geographic comparison
- 9.3 Germany - Market size and forecast 2023-2028
- Exhibit 74: Chart on Germany - Market size and forecast 2023-2028 ($ billion)
- Exhibit 75: Data Table on Germany - Market size and forecast 2023-2028 ($ billion)
- Exhibit 76: Chart on Germany - Year-over-year growth 2023-2028 (%)
- Exhibit 77: Data Table on Germany - Year-over-year growth 2023-2028 (%)
- 9.4 UK - Market size and forecast 2023-2028
- Exhibit 78: Chart on UK - Market size and forecast 2023-2028 ($ billion)
- Exhibit 79: Data Table on UK - Market size and forecast 2023-2028 ($ billion)
- Exhibit 80: Chart on UK - Year-over-year growth 2023-2028 (%)
- Exhibit 81: Data Table on UK - Year-over-year growth 2023-2028 (%)
- 9.5 France - Market size and forecast 2023-2028
- Exhibit 82: Chart on France - Market size and forecast 2023-2028 ($ billion)
- Exhibit 83: Data Table on France - Market size and forecast 2023-2028 ($ billion)
- Exhibit 84: Chart on France - Year-over-year growth 2023-2028 (%)
- Exhibit 85: Data Table on France - Year-over-year growth 2023-2028 (%)
- 9.6 Italy - Market size and forecast 2023-2028
- Exhibit 86: Chart on Italy - Market size and forecast 2023-2028 ($ billion)
- Exhibit 87: Data Table on Italy - Market size and forecast 2023-2028 ($ billion)
- Exhibit 88: Chart on Italy - Year-over-year growth 2023-2028 (%)
- Exhibit 89: Data Table on Italy - Year-over-year growth 2023-2028 (%)
- 9.7 Rest of EU - Market size and forecast 2023-2028
- Exhibit 90: Chart on Rest of EU - Market size and forecast 2023-2028 ($ billion)
- Exhibit 91: Data Table on Rest of EU - Market size and forecast 2023-2028 ($ billion)
- Exhibit 92: Chart on Rest of EU - Year-over-year growth 2023-2028 (%)
- Exhibit 93: Data Table on Rest of EU - Year-over-year growth 2023-2028 (%)
- 9.8 Market opportunity by geography
- Exhibit 94: Market opportunity by geography ($ billion)
- Exhibit 95: Data Table on Market opportunity by geography ($ billion)
10 Drivers, Challenges, and Trends
- 10.3 Impact of drivers and challenges
- Exhibit 96: Impact of drivers and challenges in 2023 and 2028
11 Vendor Landscape
- 11.2 Vendor landscape
- Exhibit 97: Overview on Criticality of inputs and Factors of differentiation
- 11.3 Landscape disruption
- Exhibit 98: Overview on factors of disruption
- 11.4 Industry risks
- Exhibit 99: Impact of key risks on business
12 Vendor Analysis
- 12.1 Vendors covered
- Exhibit 100: Vendors covered
- 12.2 Market positioning of vendors
- Exhibit 101: Matrix on vendor position and classification
- 12.3 Ajinomoto Co. Inc.
- Exhibit 102: Ajinomoto Co. Inc. - Overview
- Exhibit 103: Ajinomoto Co. Inc. - Business segments
- Exhibit 104: Ajinomoto Co. Inc. - Key offerings
- Exhibit 105: Ajinomoto Co. Inc. - Segment focus
- 12.4 Aryzta AG
- Exhibit 106: Aryzta AG - Overview
- Exhibit 107: Aryzta AG - Business segments
- Exhibit 108: Aryzta AG - Key offerings
- Exhibit 109: Aryzta AG - Segment focus
- 12.5 BRF SA
- Exhibit 110: BRF SA - Overview
- Exhibit 111: BRF SA - Product / Service
- Exhibit 112: BRF SA - Key offerings
- 12.6 Cargill Inc.
- Exhibit 113: Cargill Inc. - Overview
- Exhibit 114: Cargill Inc. - Product / Service
- Exhibit 115: Cargill Inc. - Key news
- Exhibit 116: Cargill Inc. - Key offerings
- 12.7 CONGELADOS CIENTOCINCO, S.L.
- Exhibit 117: CONGELADOS CIENTOCINCO, S.L. - Overview
- Exhibit 118: CONGELADOS CIENTOCINCO, S.L. - Product / Service
- Exhibit 119: CONGELADOS CIENTOCINCO, S.L. - Key offerings
- 12.8 Dr. August Oetker KG
- Exhibit 120: Dr. August Oetker KG - Overview
- Exhibit 121: Dr. August Oetker KG - Product / Service
- Exhibit 122: Dr. August Oetker KG - Key offerings
- 12.9 FRoSTA AG
- Exhibit 123: FRoSTA AG - Overview
- Exhibit 124: FRoSTA AG - Business segments
- Exhibit 125: FRoSTA AG - Key offerings
- Exhibit 126: FRoSTA AG - Segment focus
- 12.10 General Mills Inc.
- Exhibit 127: General Mills Inc. - Overview
- Exhibit 128: General Mills Inc. - Business segments
- Exhibit 129: General Mills Inc. - Key news
- Exhibit 130: General Mills Inc. - Key offerings
- Exhibit 131: General Mills Inc. - Segment focus
- 12.11 Iceland Foods Ltd.
- Exhibit 132: Iceland Foods Ltd. - Overview
- Exhibit 133: Iceland Foods Ltd. - Product / Service
- Exhibit 134: Iceland Foods Ltd. - Key offerings
- 12.12 JBS SA
- Exhibit 135: JBS SA - Overview
- Exhibit 136: JBS SA - Business segments
- Exhibit 137: JBS SA - Key offerings
- Exhibit 138: JBS SA - Segment focus
- 12.13 Lantmannen Unibake International
- Exhibit 139: Lantmannen Unibake International - Overview
- Exhibit 140: Lantmannen Unibake International - Product / Service
- Exhibit 141: Lantmannen Unibake International - Key offerings
- 12.14 McCain Foods Ltd.
- Exhibit 142: McCain Foods Ltd. - Overview
- Exhibit 143: McCain Foods Ltd. - Product / Service
- Exhibit 144: McCain Foods Ltd. - Key offerings
- 12.15 Nestle SA
- Exhibit 145: Nestle SA - Overview
- Exhibit 146: Nestle SA - Business segments
- Exhibit 147: Nestle SA - Key news
- Exhibit 148: Nestle SA - Key offerings
- Exhibit 149: Nestle SA - Segment focus
- 12.16 Nomad Foods Ltd.
- Exhibit 150: Nomad Foods Ltd. - Overview
- Exhibit 151: Nomad Foods Ltd. - Product / Service
- Exhibit 152: Nomad Foods Ltd. - Key offerings
- 12.17 Orkla ASA
- Exhibit 153: Orkla ASA - Overview
- Exhibit 154: Orkla ASA - Business segments
- Exhibit 155: Orkla ASA - Key news
- Exhibit 156: Orkla ASA - Key offerings
- Exhibit 157: Orkla ASA - Segment focus
13 Appendix
- 13.2 Inclusions and exclusions checklist
- Exhibit 158: Inclusions checklist
- Exhibit 159: Exclusions checklist
- 13.3 Currency conversion rates for US$
- Exhibit 160: Currency conversion rates for US$
- 13.4 Research methodology
- Exhibit 161: Research methodology
- Exhibit 162: Validation techniques employed for market sizing
- Exhibit 163: Information sources
- 13.5 List of abbreviations
- Exhibit 164: List of abbreviations


