Green Data Center (GDC) Market Analysis, Size, and Forecast 2026-2030: Europe (Germany, UK, and France), North America (US, Canada, and Mexico), APAC (China, Japan, and India), South America (Brazil and Argentina), Middle East and Africa (Saudi Arabia, UAE, and South Africa), and Rest of World (ROW)

Green Data Center (GDC) Market Analysis, Size, and Forecast 2026-2030:
Europe (Germany, UK, and France), North America (US, Canada, and Mexico), APAC (China, Japan, and India), South America (Brazil and Argentina), Middle East and Africa (Saudi Arabia, UAE, and South Africa), and Rest of World (ROW)

Published: Apr 2026 318 Pages SKU: IRTNTR44791

Market Overview at a Glance

$114.23 B
Market Opportunity
14.5%
CAGR 2025 - 2030
44.4%
Europe Growth
$43.51 B
IT infrastructure segment 2024

Green Data Center (GDC) Market Size 2026-2030

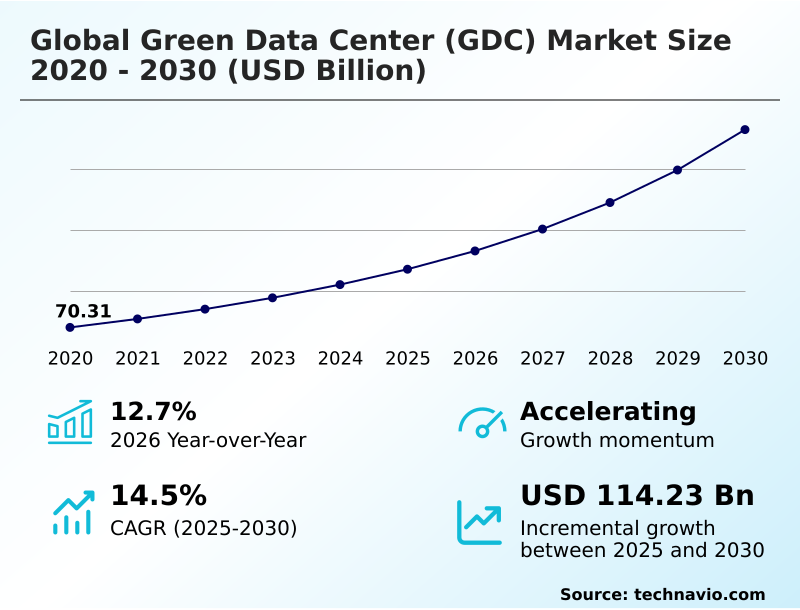
The green data center (gdc) market size is valued to increase by USD 114.23 billion, at a CAGR of 14.5% from 2025 to 2030. Increase in electricity consumption is augmenting market growth will drive the green data center (gdc) market.

Major Market Trends & Insights

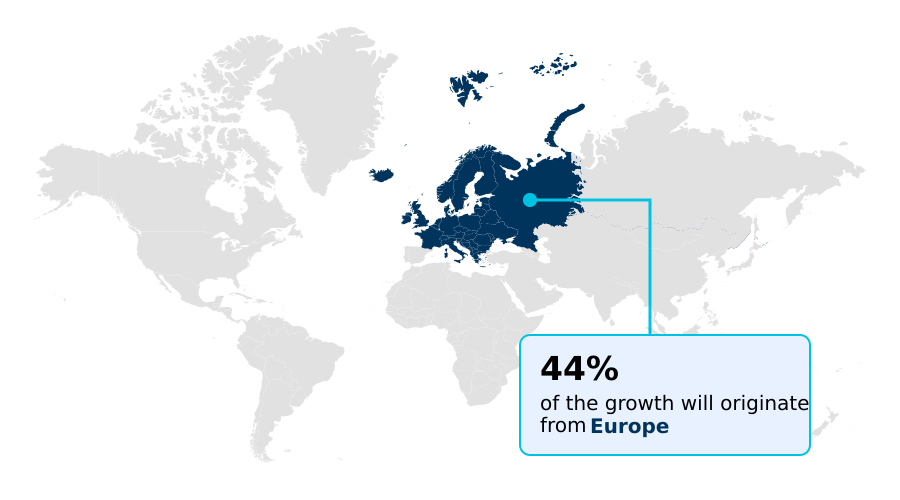
  • Europe dominated the market and accounted for a 44.4% growth during the forecast period.
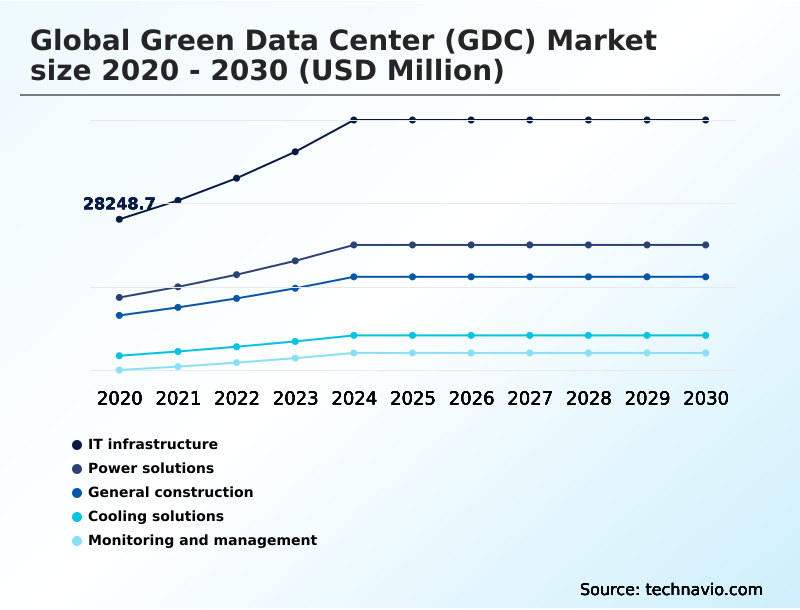
  • By Component - IT infrastructure segment was valued at USD 43.51 billion in 2024
  • By End-user - BFSI segment accounted for the largest market revenue share in 2024

Market Size & Forecast

  • Market Opportunities: USD 161.83 billion
  • Market Future Opportunities: USD 114.23 billion
  • CAGR from 2025 to 2030 : 14.5%

Market Summary

  • The green data center (GDC) market is expanding as organizations prioritize sustainability and energy efficiency in their digital infrastructure. This market focuses on developing and operating data centers that minimize environmental impact through optimized energy consumption, reduced carbon emissions, and the use of renewable energy sources.
  • The rising demand for cloud computing, big data analytics, and digital services has accelerated the need for efficient data storage and processing solutions, positioning green data centers as a key alternative to conventional facilities. A key driver is the growing emphasis on environmental responsibility, with regulatory frameworks encouraging the adoption of energy efficient servers, advanced cooling systems, and intelligent power management technologies.
  • For example, a financial services firm migrating to a green data center can meet its ESG targets while reducing operational expenses through lower energy bills and improved power usage effectiveness (PUE). Technological advancements, including virtualization and AI-driven energy optimization, are further enhancing resource utilization.
  • Despite challenges like high initial investment, the market is set to play a crucial role in supporting sustainable digital growth.

What will be the Size of the Green Data Center (GDC) Market during the forecast period?

Get Key Insights on Market Forecast (PDF) Get Free Sample

How is the Green Data Center (GDC) Market Segmented?

The green data center (gdc) industry research report provides comprehensive data (region-wise segment analysis), with forecasts and estimates in "USD million" for the period 2026-2030, as well as historical data from 2020-2024 for the following segments.

  • Component
    • IT infrastructure
    • Power solutions
    • General construction
    • Cooling solutions
    • Monitoring and management
  • End-user
    • BFSI
    • Energy
    • IT and telecom
    • Others
  • Type
    • Hyperscale data centers
    • Colocation data centers
    • Enterprise data centers
  • Geography
    • Europe
      • Germany
      • UK
      • France
    • North America
      • US
      • Canada
      • Mexico
    • APAC
      • China
      • Japan
      • India
    • South America
      • Brazil
      • Argentina
    • Middle East and Africa
      • Saudi Arabia
      • UAE
      • South Africa
    • Rest of World (ROW)

By Component Insights

The it infrastructure segment is estimated to witness significant growth during the forecast period.

The IT infrastructure segment is fundamental to the green data center market, focusing on hardware that minimizes energy consumption. This includes high-efficiency servers, advanced storage arrays, and low-power networking equipment, which are crucial for achieving ambitious sustainability goals.

The adoption of energy-efficient infrastructure and high-density computing designs allows operators to handle complex workloads, such as AI and big data analytics, without a proportional increase in electricity demand, improving performance per watt by up to 25%.

Key elements like high-voltage direct current (HVDC) power distribution, solid-state drives, and intelligent energy management are becoming standard.

This shift toward sustainable materials and ecofriendly building designs supports the broader goal of creating a resilient and low-carbon digital economy by addressing both operational and embodied carbon reduction.

Get Free Sample

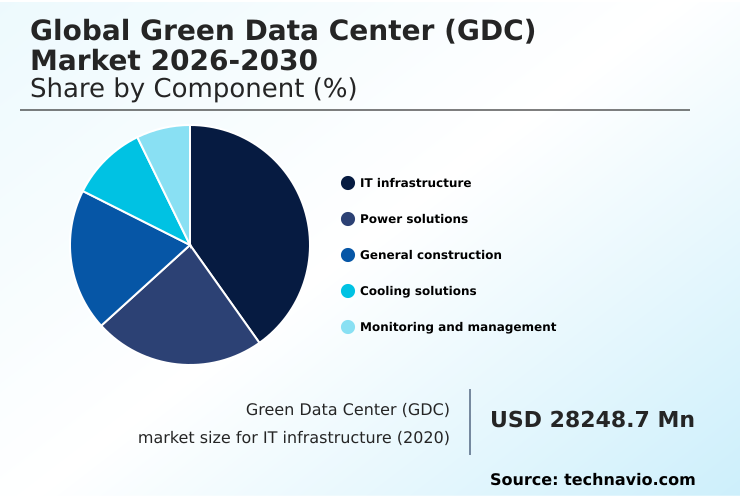
The IT infrastructure segment was valued at USD 43.51 billion in 2024 and showed a gradual increase during the forecast period.

Get Free Sample

Regional Analysis

Europe is estimated to contribute 44.4% to the growth of the global market during the forecast period.Technavio’s analysts have elaborately explained the regional trends and drivers that shape the market during the forecast period.

See How Green Data Center (GDC) Market Demand is Rising in Europe Get Free Sample

The market's geographic landscape is characterized by distinct regional priorities. Europe leads in regulatory-driven adoption, with its focus on circular economy principles and waste heat reuse.

In contrast, North America's expansion is fueled by hyperscalers investing in large-scale renewable energy integration and high-performance computing (HPC). APAC is a high-growth region where climate-adapted infrastructure is essential for operating in tropical environments, driving innovation in advanced cooling technologies.

Operators in this region are achieving PUE ratings as low as 1.2 by deploying specialized thermal management systems.

The market in Europe is expanding at a rate approximately 15% higher than in the Middle East and Africa, driven by stringent energy intensity reporting mandates.

The adoption of modular construction and rainwater harvesting systems is also gaining traction globally to enhance sustainability.

Market Dynamics

Our researchers analyzed the data with 2025 as the base year, along with the key drivers, trends, and challenges. A holistic analysis of drivers will help companies refine their marketing strategies to gain a competitive advantage.

  • Achieving sustainability in the digital age requires a multifaceted approach, starting with reducing the embodied carbon of the digital backbone through sustainable procurement. A key focus is managing heat loads from high-density computing, where optimizing cooling and energy efficiency becomes paramount. For facilities operating data centers in tropical climates, specialized designs are crucial.
  • Success hinges on balancing workloads for improved efficiency, which directly contributes to achieving low power usage effectiveness ratings. Forward-thinking operators are reusing waste heat for district heating, creating a circular energy model. Many are deploying AI for facility operations management to automate and refine performance, including using AI for predictive energy adjustments.
  • In water-scarce areas, managing water stress in arid regions is a critical operational constraint, often addressed by minimizing water consumption with closed-loop cooling. Retrofitting legacy sites for energy efficiency offers a path to modernization, while new builds are implementing modular data center designs and implementing sustainable building materials in construction.
  • Integrating on-site renewable energy generation is a core strategy, complemented by using AI-driven workload management. A key metric of success is aligning data center operations with compliance, which can reduce risks. Furthermore, reducing transmission losses with HVDC and improving power usage with virtualization are vital technical tactics.
  • Finally, tracking environmental metrics with DCIM software provides the necessary data for continuous improvement, with some facilities reporting a 15% greater workload density compared to traditional designs.

What are the key market drivers leading to the rise in the adoption of Green Data Center (GDC) Industry?

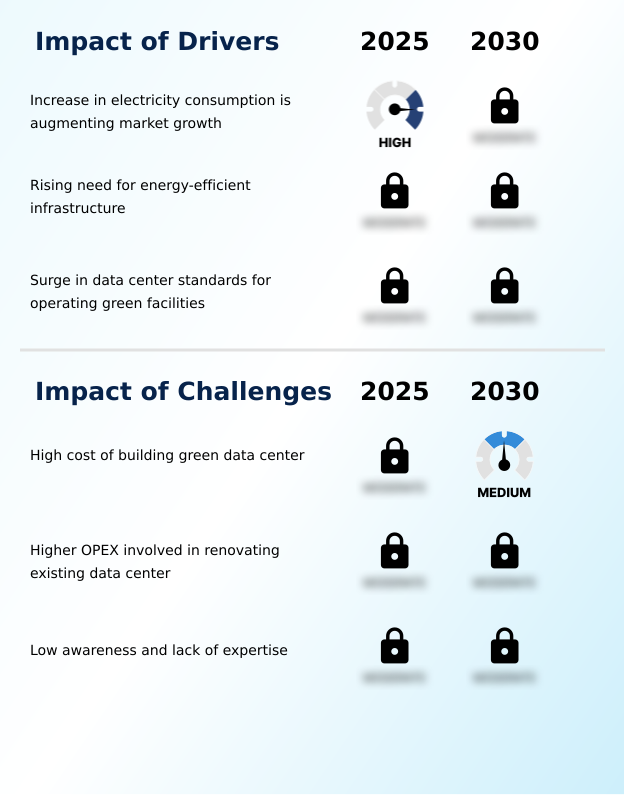
  • The increase in electricity consumption is a key driver augmenting market growth by accelerating the shift toward energy-efficient infrastructure.

  • Market growth is fundamentally driven by the rising need for energy-optimized systems to counteract increasing electricity consumption and costs. As digital services expand, the demand for sustainable infrastructure that meets stringent carbon reduction targets is intensifying.
  • A surge in data center standards is compelling organizations to adopt low-emission operations and energy-efficient technologies, with adherence to new standards often reducing carbon-related fees by over 10%.
  • This push for compliance-driven infrastructure is accelerating investment in renewable energy and carbon accounting tools.
  • The rising need for high computational performance without a corresponding increase in environmental impact is making technologies like free cooling and efficient chiller systems essential for new builds and retrofits, supporting long-term sustainability goals.

What are the market trends shaping the Green Data Center (GDC) Industry?

  • The increased use of data center infrastructure management (DCIM) and automation is an emerging trend. It enables real-time monitoring and optimization of energy and operational performance.

  • Key trends are reshaping operational models, with a strong emphasis on automation and resource management. The increased use of predictive control systems and AI-driven thermal optimization enables facilities to dynamically adjust to workloads, improving energy utilization by up to 20%.
  • As high-density hardware becomes common, rising water consumption from traditional water-based cooling methods is a significant concern, driving the adoption of more sustainable alternatives. Innovations in rear door heat exchangers and closed-loop liquid cooling are becoming critical. Furthermore, the expansion of operations into tropical climates is fostering innovation in climate-adapted infrastructure, where specialized cooling solutions are necessary to maintain performance.
  • This trend pushes the industry toward more efficient and resilient designs tailored to challenging environmental conditions, ensuring both sustainability and operational continuity.

What challenges does the Green Data Center (GDC) Industry face during its growth?

  • The high cost associated with constructing green data centers is a key challenge affecting industry growth.

  • Significant challenges persist, primarily centered on high upfront costs and the need for specialized expertise. The capital expenditure for building green data centers can be 15-25% higher than for traditional facilities, creating a barrier for many organizations.
  • This is compounded by the high operational expenses and complexity involved in retrofitting existing data centers with modern technologies like flexible loads or district heating programs. A lack of expertise in areas such as grid frequency regulation and sustainable infrastructure design slows adoption and can lead to suboptimal performance.
  • Overcoming these hurdles requires not only financial investment but also a commitment to developing a skilled workforce capable of managing sophisticated, energy-efficient systems.

Exclusive Technavio Analysis on Customer Landscape

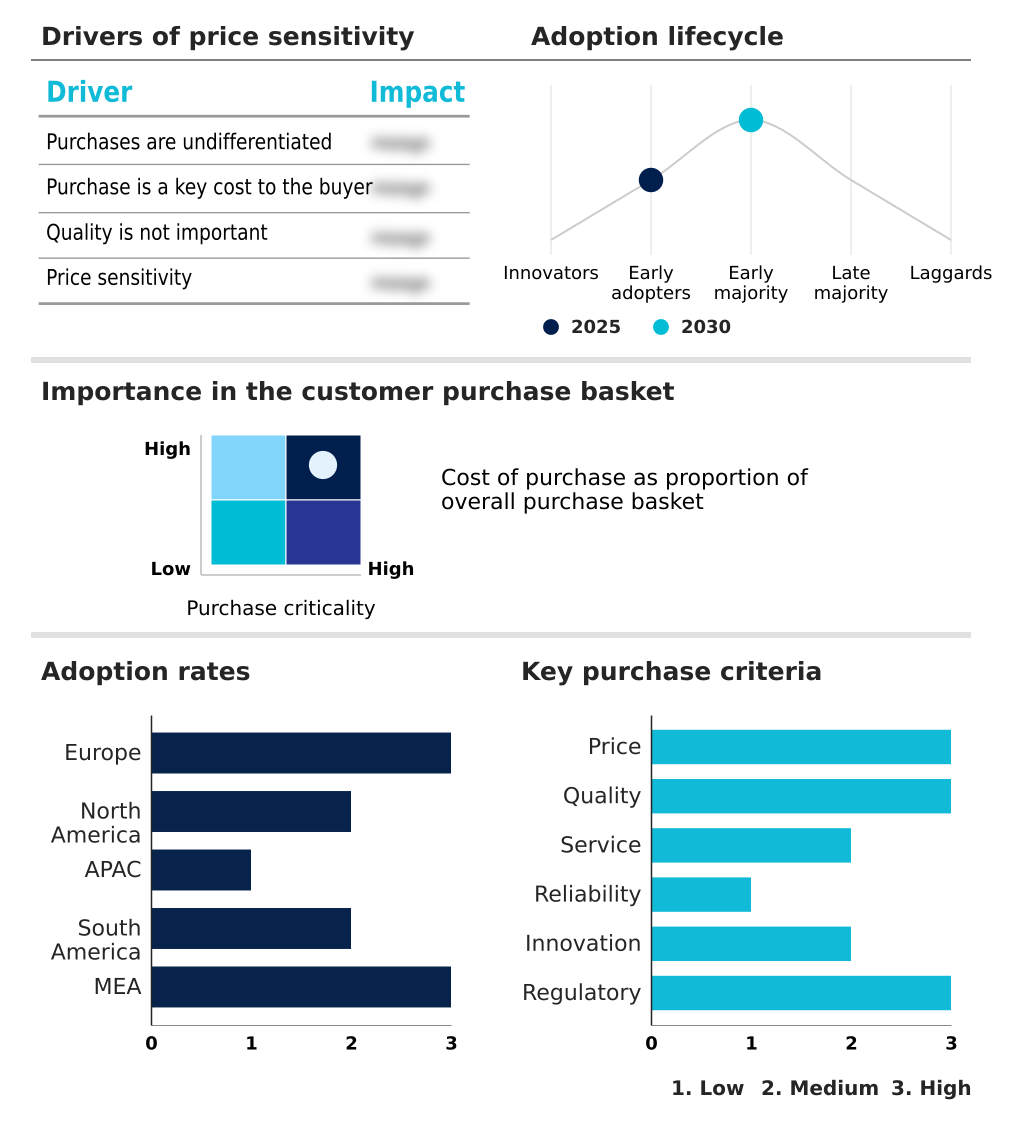
The green data center (gdc) market forecasting report includes the adoption lifecycle of the market, covering from the innovator’s stage to the laggard’s stage. It focuses on adoption rates in different regions based on penetration. Furthermore, the green data center (gdc) market report also includes key purchase criteria and drivers of price sensitivity to help companies evaluate and develop their market growth analysis strategies.

Customer Landscape of Green Data Center (GDC) Industry

Competitive Landscape

Companies are implementing various strategies, such as strategic alliances, green data center (gdc) market forecast, partnerships, mergers and acquisitions, geographical expansion, and product/service launches, to enhance their presence in the industry.

ABB Ltd. - Delivering GDC solutions with energy-efficient power distribution and digital management to cut electrical losses and carbon emissions for hyperscale facilities.

The industry research and growth report includes detailed analyses of the competitive landscape of the market and information about key companies, including:

  • ABB Ltd.
  • Amazon.com Inc.
  • Daikin Industries Ltd.
  • Delta Electronics Inc.
  • Digital Realty Trust Inc.
  • Eaton Corp. Plc
  • Equinix Inc.
  • GE Vernova Inc.
  • Google LLC
  • Green Revolution Cooling Inc.
  • Hitachi Energy Ltd.
  • Iron Mountain Inc.
  • LiquidStack BV
  • LITE ON Technology Corp.
  • Meta Platforms Inc.
  • Microsoft Corp.
  • Mitsubishi Heavy Industries
  • Schneider Electric SE
  • Submer Technologies SL
  • Vertiv Holdings Co.

Qualitative and quantitative analysis of companies has been conducted to help clients understand the wider business environment as well as the strengths and weaknesses of key industry players. Data is qualitatively analyzed to categorize companies as pure play, category-focused, industry-focused, and diversified; it is quantitatively analyzed to categorize companies as dominant, leading, strong, tentative, and weak.

Recent Development and News in Green data center (gdc) market

  • In June 2025, Google LLC announced an expansion of its next-generation data center facilities, focusing on advanced energy-efficient architecture and carbon-free energy sourcing across multiple operational regions.
  • In May 2025, Dell Technologies is scheduled to release an expanded line of servers featuring modular, circular design components that utilize 50% recycled content, significantly reducing the embodied carbon of the digital backbone.
  • In February 2025, Schneider Electric announced the widespread deployment of its new dielectric immersion cooling pods, which allow for the operation of high-density hardware without the need for massive mechanical chillers.
  • In January 2025, Vertiv introduced an upgraded modular power platform designed for sustainable facilities, utilizing lithium-ion battery storage to provide better energy density and longer lifecycles than traditional lead-acid alternatives.

Dive into Technavio’s robust research methodology, blending expert interviews, extensive data synthesis, and validated models for unparalleled Green Data Center (GDC) Market insights. See full methodology.

Market Scope
Page number 318
Base year 2025
Historic period 2020-2024
Forecast period 2026-2030
Growth momentum & CAGR Accelerate at a CAGR of 14.5%
Market growth 2026-2030 USD 114228.1 million
Market structure Fragmented
YoY growth 2025-2026(%) 12.7%
Key countries Germany, UK, France, Italy, Spain, The Netherlands, US, Canada, Mexico, China, Japan, India, South Korea, Australia, Indonesia, Brazil, Argentina, Chile, Saudi Arabia, UAE, South Africa, Israel and Turkey
Competitive landscape Leading Companies, Market Positioning of Companies, Competitive Strategies, and Industry Risks

Request Free Sample

Research Analyst Overview

  • The green data center (GDC) market is defined by a continuous evolution toward greater efficiency and environmental stewardship, driven by technological innovation. Core to this transformation is the widespread adoption of virtualization and advanced cooling technologies to manage escalating thermal management challenges.
  • The integration of data center infrastructure management (DCIM) software has become standard for AI-based energy monitoring and optimizing performance. Boardroom decisions increasingly center on the CAPEX of deploying technologies like liquid immersion cooling versus the long-term OPEX savings from enhanced power usage effectiveness. The use of high-efficiency power supply units and modular power platforms with lithium-ion battery storage is critical.
  • Facilities are also leveraging digital twin technology to model and de-risk changes. Implementing high-voltage direct current (HVDC) distribution can reduce power conversion losses by over 5%, a significant factor in large-scale operations. This focus on intelligent energy management and workload consolidation is reshaping infrastructure strategy.

What are the Key Data Covered in this Green Data Center (GDC) Market Research and Growth Report?

  • What is the expected growth of the Green Data Center (GDC) Market between 2026 and 2030?

    • USD 114.23 billion, at a CAGR of 14.5%

  • What segmentation does the market report cover?

    • The report is segmented by Component (IT infrastructure, Power solutions, General construction, Cooling solutions, and Monitoring and management), End-user (BFSI, Energy, IT and telecom, and Others), Type (Hyperscale data centers, Colocation data centers, and Enterprise data centers) and Geography (Europe, North America, APAC, South America, Middle East and Africa)

  • Which regions are analyzed in the report?

    • Europe, North America, APAC, South America and Middle East and Africa

  • What are the key growth drivers and market challenges?

    • Increase in electricity consumption is augmenting market growth, High cost of building green data center

  • Who are the major players in the Green Data Center (GDC) Market?

    • ABB Ltd., Amazon.com Inc., Daikin Industries Ltd., Delta Electronics Inc., Digital Realty Trust Inc., Eaton Corp. Plc, Equinix Inc., GE Vernova Inc., Google LLC, Green Revolution Cooling Inc., Hitachi Energy Ltd., Iron Mountain Inc., LiquidStack BV, LITE ON Technology Corp., Meta Platforms Inc., Microsoft Corp., Mitsubishi Heavy Industries, Schneider Electric SE, Submer Technologies SL and Vertiv Holdings Co.

Market Research Insights

  • The market dynamics are increasingly shaped by the push for sustainable digital infrastructure, where AI-driven thermal optimization is critical for managing heat loads. Enterprises adopting compliance-driven infrastructure report a 10% improvement in audit readiness. The shift toward carbon-free energy sourcing is becoming a competitive differentiator, with early adopters seeing enhanced brand reputation.
  • Organizations leveraging intelligent software platforms for workload balancing achieve up to a 15% reduction in wasted compute cycles. As sovereign AI models become more prevalent, the need for localized, efficient data processing powered by on-site renewable energy grows. This strategic alignment with carbon reduction targets and data sovereignty principles is redefining operational and investment priorities across the industry.

We can help! Our analysts can customize this green data center (gdc) market research report to meet your requirements.

Get in touch

1. Executive Summary

1.1 Market overview

Executive Summary - Chart on Market Overview
Executive Summary - Data Table on Market Overview
Executive Summary - Chart on Global Market Characteristics
Executive Summary - Chart on Market by Geography
Executive Summary - Chart on Market Segmentation by Component
Executive Summary - Chart on Market Segmentation by End-user
Executive Summary - Chart on Market Segmentation by Type
Executive Summary - Chart on Incremental Growth
Executive Summary - Data Table on Incremental Growth
Executive Summary - Chart on Company Market Positioning

2. Technavio Analysis

2.1 Analysis of price sensitivity, lifecycle, customer purchase basket, adoption rates, and purchase criteria

2.2 Criticality of inputs and Factors of differentiation

Chart on Overview on criticality of inputs and factors of differentiation

2.3 Factors of disruption

Chart on Overview on factors of disruption

2.4 Impact of drivers and challenges

Chart on Impact of drivers and challenges in 2025 and 2030

3. Market Landscape

3.1 Market ecosystem

Chart on Parent Market
Data Table on - Parent Market

3.2 Market characteristics

Chart on Market characteristics analysis

3.3 Value chain analysis

Chart on Value chain analysis

4. Market Sizing

4.1 Market definition

Data Table on Offerings of companies included in the market definition

4.2 Market segment analysis

Market segments

4.3 Market size 2025

4.4 Market outlook: Forecast for 2025-2030

Chart on Global - Market size and forecast 2025-2030 ($ million)
Data Table on Global - Market size and forecast 2025-2030 ($ million)
Chart on Global Market: Year-over-year growth 2025-2030 (%)
Data Table on Global Market: Year-over-year growth 2025-2030 (%)

5. Historic Market Size

5.1 Global Green Data Center (GDC) Market 2020 - 2024

Historic Market Size - Data Table on Global Green Data Center (GDC) Market 2020 - 2024 ($ million)

5.2 Component segment analysis 2020 - 2024

Historic Market Size - Component Segment 2020 - 2024 ($ million)

5.3 End-user segment analysis 2020 - 2024

Historic Market Size - End-user Segment 2020 - 2024 ($ million)

5.4 Type segment analysis 2020 - 2024

Historic Market Size - Type Segment 2020 - 2024 ($ million)

5.5 Geography segment analysis 2020 - 2024

Historic Market Size - Geography Segment 2020 - 2024 ($ million)

5.6 Country segment analysis 2020 - 2024

Historic Market Size - Country Segment 2020 - 2024 ($ million)

6. Qualitative Analysis

6.1 Impact of AI on Global Green Data Center (GDC) Market

6.2 Impact of Geopolitical Conflicts on Global Green Data Center (GDC) Market

7. Five Forces Analysis

7.1 Five forces summary

Five forces analysis - Comparison between 2025 and 2030

7.2 Bargaining power of buyers

Bargaining power of buyers - Impact of key factors 2025 and 2030

7.3 Bargaining power of suppliers

Bargaining power of suppliers - Impact of key factors in 2025 and 2030

7.4 Threat of new entrants

Threat of new entrants - Impact of key factors in 2025 and 2030

7.5 Threat of substitutes

Threat of substitutes - Impact of key factors in 2025 and 2030

7.6 Threat of rivalry

Threat of rivalry - Impact of key factors in 2025 and 2030

7.7 Market condition

Chart on Market condition - Five forces 2025 and 2030

8. Market Segmentation by Component

8.1 Market segments

Chart on Component - Market share 2025-2030 (%)
Data Table on Component - Market share 2025-2030 (%)

8.2 Comparison by Component

Chart on Comparison by Component
Data Table on Comparison by Component

8.3 IT infrastructure - Market size and forecast 2025-2030

Chart on IT infrastructure - Market size and forecast 2025-2030 ($ million)
Data Table on IT infrastructure - Market size and forecast 2025-2030 ($ million)
Chart on IT infrastructure - Year-over-year growth 2025-2030 (%)
Data Table on IT infrastructure - Year-over-year growth 2025-2030 (%)

8.4 Power solutions - Market size and forecast 2025-2030

Chart on Power solutions - Market size and forecast 2025-2030 ($ million)
Data Table on Power solutions - Market size and forecast 2025-2030 ($ million)
Chart on Power solutions - Year-over-year growth 2025-2030 (%)
Data Table on Power solutions - Year-over-year growth 2025-2030 (%)

8.5 General construction - Market size and forecast 2025-2030

Chart on General construction - Market size and forecast 2025-2030 ($ million)
Data Table on General construction - Market size and forecast 2025-2030 ($ million)
Chart on General construction - Year-over-year growth 2025-2030 (%)
Data Table on General construction - Year-over-year growth 2025-2030 (%)

8.6 Cooling solutions - Market size and forecast 2025-2030

Chart on Cooling solutions - Market size and forecast 2025-2030 ($ million)
Data Table on Cooling solutions - Market size and forecast 2025-2030 ($ million)
Chart on Cooling solutions - Year-over-year growth 2025-2030 (%)
Data Table on Cooling solutions - Year-over-year growth 2025-2030 (%)

8.7 Monitoring and management - Market size and forecast 2025-2030

Chart on Monitoring and management - Market size and forecast 2025-2030 ($ million)
Data Table on Monitoring and management - Market size and forecast 2025-2030 ($ million)
Chart on Monitoring and management - Year-over-year growth 2025-2030 (%)
Data Table on Monitoring and management - Year-over-year growth 2025-2030 (%)

8.8 Market opportunity by Component

Market opportunity by Component ($ million)
Data Table on Market opportunity by Component ($ million)

9. Market Segmentation by End-user

9.1 Market segments

Chart on End-user - Market share 2025-2030 (%)
Data Table on End-user - Market share 2025-2030 (%)

9.2 Comparison by End-user

Chart on Comparison by End-user
Data Table on Comparison by End-user

9.3 BFSI - Market size and forecast 2025-2030

Chart on BFSI - Market size and forecast 2025-2030 ($ million)
Data Table on BFSI - Market size and forecast 2025-2030 ($ million)
Chart on BFSI - Year-over-year growth 2025-2030 (%)
Data Table on BFSI - Year-over-year growth 2025-2030 (%)

9.4 Energy - Market size and forecast 2025-2030

Chart on Energy - Market size and forecast 2025-2030 ($ million)
Data Table on Energy - Market size and forecast 2025-2030 ($ million)
Chart on Energy - Year-over-year growth 2025-2030 (%)
Data Table on Energy - Year-over-year growth 2025-2030 (%)

9.5 IT and telecom - Market size and forecast 2025-2030

Chart on IT and telecom - Market size and forecast 2025-2030 ($ million)
Data Table on IT and telecom - Market size and forecast 2025-2030 ($ million)
Chart on IT and telecom - Year-over-year growth 2025-2030 (%)
Data Table on IT and telecom - Year-over-year growth 2025-2030 (%)

9.6 Others - Market size and forecast 2025-2030

Chart on Others - Market size and forecast 2025-2030 ($ million)
Data Table on Others - Market size and forecast 2025-2030 ($ million)
Chart on Others - Year-over-year growth 2025-2030 (%)
Data Table on Others - Year-over-year growth 2025-2030 (%)

9.7 Market opportunity by End-user

Market opportunity by End-user ($ million)
Data Table on Market opportunity by End-user ($ million)

10. Market Segmentation by Type

10.1 Market segments

Chart on Type - Market share 2025-2030 (%)
Data Table on Type - Market share 2025-2030 (%)

10.2 Comparison by Type

Chart on Comparison by Type
Data Table on Comparison by Type

10.3 Hyperscale data centers - Market size and forecast 2025-2030

Chart on Hyperscale data centers - Market size and forecast 2025-2030 ($ million)
Data Table on Hyperscale data centers - Market size and forecast 2025-2030 ($ million)
Chart on Hyperscale data centers - Year-over-year growth 2025-2030 (%)
Data Table on Hyperscale data centers - Year-over-year growth 2025-2030 (%)

10.4 Colocation data centers - Market size and forecast 2025-2030

Chart on Colocation data centers - Market size and forecast 2025-2030 ($ million)
Data Table on Colocation data centers - Market size and forecast 2025-2030 ($ million)
Chart on Colocation data centers - Year-over-year growth 2025-2030 (%)
Data Table on Colocation data centers - Year-over-year growth 2025-2030 (%)

10.5 Enterprise data centers - Market size and forecast 2025-2030

Chart on Enterprise data centers - Market size and forecast 2025-2030 ($ million)
Data Table on Enterprise data centers - Market size and forecast 2025-2030 ($ million)
Chart on Enterprise data centers - Year-over-year growth 2025-2030 (%)
Data Table on Enterprise data centers - Year-over-year growth 2025-2030 (%)

10.6 Market opportunity by Type

Market opportunity by Type ($ million)
Data Table on Market opportunity by Type ($ million)

11. Customer Landscape

11.1 Customer landscape overview

Analysis of price sensitivity, lifecycle, customer purchase basket, adoption rates, and purchase criteria

12. Geographic Landscape

12.1 Geographic segmentation

Chart on Market share by geography 2025-2030 (%)
Data Table on Market share by geography 2025-2030 (%)

12.2 Geographic comparison

Chart on Geographic comparison
Data Table on Geographic comparison

12.3 Europe - Market size and forecast 2025-2030

Chart on Europe - Market size and forecast 2025-2030 ($ million)
Data Table on Europe - Market size and forecast 2025-2030 ($ million)
Chart on Europe - Year-over-year growth 2025-2030 (%)
Data Table on Europe - Year-over-year growth 2025-2030 (%)
Chart on Regional Comparison - Europe
Data Table on Regional Comparison - Europe

12.3.1 Germany - Market size and forecast 2025-2030

Chart on Germany - Market size and forecast 2025-2030 ($ million)
Data Table on Germany - Market size and forecast 2025-2030 ($ million)
Chart on Germany - Year-over-year growth 2025-2030 (%)
Data Table on Germany - Year-over-year growth 2025-2030 (%)

12.3.2 UK - Market size and forecast 2025-2030

Chart on UK - Market size and forecast 2025-2030 ($ million)
Data Table on UK - Market size and forecast 2025-2030 ($ million)
Chart on UK - Year-over-year growth 2025-2030 (%)
Data Table on UK - Year-over-year growth 2025-2030 (%)

12.3.3 France - Market size and forecast 2025-2030

Chart on France - Market size and forecast 2025-2030 ($ million)
Data Table on France - Market size and forecast 2025-2030 ($ million)
Chart on France - Year-over-year growth 2025-2030 (%)
Data Table on France - Year-over-year growth 2025-2030 (%)

12.3.4 Italy - Market size and forecast 2025-2030

Chart on Italy - Market size and forecast 2025-2030 ($ million)
Data Table on Italy - Market size and forecast 2025-2030 ($ million)
Chart on Italy - Year-over-year growth 2025-2030 (%)
Data Table on Italy - Year-over-year growth 2025-2030 (%)

12.3.5 Spain - Market size and forecast 2025-2030

Chart on Spain - Market size and forecast 2025-2030 ($ million)
Data Table on Spain - Market size and forecast 2025-2030 ($ million)
Chart on Spain - Year-over-year growth 2025-2030 (%)
Data Table on Spain - Year-over-year growth 2025-2030 (%)

12.3.6 The Netherlands - Market size and forecast 2025-2030

Chart on The Netherlands - Market size and forecast 2025-2030 ($ million)
Data Table on The Netherlands - Market size and forecast 2025-2030 ($ million)
Chart on The Netherlands - Year-over-year growth 2025-2030 (%)
Data Table on The Netherlands - Year-over-year growth 2025-2030 (%)

12.4 North America - Market size and forecast 2025-2030

Chart on North America - Market size and forecast 2025-2030 ($ million)
Data Table on North America - Market size and forecast 2025-2030 ($ million)
Chart on North America - Year-over-year growth 2025-2030 (%)
Data Table on North America - Year-over-year growth 2025-2030 (%)
Chart on Regional Comparison - North America
Data Table on Regional Comparison - North America

12.4.1 US - Market size and forecast 2025-2030

Chart on US - Market size and forecast 2025-2030 ($ million)
Data Table on US - Market size and forecast 2025-2030 ($ million)
Chart on US - Year-over-year growth 2025-2030 (%)
Data Table on US - Year-over-year growth 2025-2030 (%)

12.4.2 Canada - Market size and forecast 2025-2030

Chart on Canada - Market size and forecast 2025-2030 ($ million)
Data Table on Canada - Market size and forecast 2025-2030 ($ million)
Chart on Canada - Year-over-year growth 2025-2030 (%)
Data Table on Canada - Year-over-year growth 2025-2030 (%)

12.4.3 Mexico - Market size and forecast 2025-2030

Chart on Mexico - Market size and forecast 2025-2030 ($ million)
Data Table on Mexico - Market size and forecast 2025-2030 ($ million)
Chart on Mexico - Year-over-year growth 2025-2030 (%)
Data Table on Mexico - Year-over-year growth 2025-2030 (%)

12.5 APAC - Market size and forecast 2025-2030

Chart on APAC - Market size and forecast 2025-2030 ($ million)
Data Table on APAC - Market size and forecast 2025-2030 ($ million)
Chart on APAC - Year-over-year growth 2025-2030 (%)
Data Table on APAC - Year-over-year growth 2025-2030 (%)
Chart on Regional Comparison - APAC
Data Table on Regional Comparison - APAC

12.5.1 China - Market size and forecast 2025-2030

Chart on China - Market size and forecast 2025-2030 ($ million)
Data Table on China - Market size and forecast 2025-2030 ($ million)
Chart on China - Year-over-year growth 2025-2030 (%)
Data Table on China - Year-over-year growth 2025-2030 (%)

12.5.2 Japan - Market size and forecast 2025-2030

Chart on Japan - Market size and forecast 2025-2030 ($ million)
Data Table on Japan - Market size and forecast 2025-2030 ($ million)
Chart on Japan - Year-over-year growth 2025-2030 (%)
Data Table on Japan - Year-over-year growth 2025-2030 (%)

12.5.3 India - Market size and forecast 2025-2030

Chart on India - Market size and forecast 2025-2030 ($ million)
Data Table on India - Market size and forecast 2025-2030 ($ million)
Chart on India - Year-over-year growth 2025-2030 (%)
Data Table on India - Year-over-year growth 2025-2030 (%)

12.5.4 South Korea - Market size and forecast 2025-2030

Chart on South Korea - Market size and forecast 2025-2030 ($ million)
Data Table on South Korea - Market size and forecast 2025-2030 ($ million)
Chart on South Korea - Year-over-year growth 2025-2030 (%)
Data Table on South Korea - Year-over-year growth 2025-2030 (%)

12.5.5 Australia - Market size and forecast 2025-2030

Chart on Australia - Market size and forecast 2025-2030 ($ million)
Data Table on Australia - Market size and forecast 2025-2030 ($ million)
Chart on Australia - Year-over-year growth 2025-2030 (%)
Data Table on Australia - Year-over-year growth 2025-2030 (%)

12.5.6 Indonesia - Market size and forecast 2025-2030

Chart on Indonesia - Market size and forecast 2025-2030 ($ million)
Data Table on Indonesia - Market size and forecast 2025-2030 ($ million)
Chart on Indonesia - Year-over-year growth 2025-2030 (%)
Data Table on Indonesia - Year-over-year growth 2025-2030 (%)

12.6 South America - Market size and forecast 2025-2030

Chart on South America - Market size and forecast 2025-2030 ($ million)
Data Table on South America - Market size and forecast 2025-2030 ($ million)
Chart on South America - Year-over-year growth 2025-2030 (%)
Data Table on South America - Year-over-year growth 2025-2030 (%)
Chart on Regional Comparison - South America
Data Table on Regional Comparison - South America

12.6.1 Brazil - Market size and forecast 2025-2030

Chart on Brazil - Market size and forecast 2025-2030 ($ million)
Data Table on Brazil - Market size and forecast 2025-2030 ($ million)
Chart on Brazil - Year-over-year growth 2025-2030 (%)
Data Table on Brazil - Year-over-year growth 2025-2030 (%)

12.6.2 Argentina - Market size and forecast 2025-2030

Chart on Argentina - Market size and forecast 2025-2030 ($ million)
Data Table on Argentina - Market size and forecast 2025-2030 ($ million)
Chart on Argentina - Year-over-year growth 2025-2030 (%)
Data Table on Argentina - Year-over-year growth 2025-2030 (%)

12.6.3 Chile - Market size and forecast 2025-2030

Chart on Chile - Market size and forecast 2025-2030 ($ million)
Data Table on Chile - Market size and forecast 2025-2030 ($ million)
Chart on Chile - Year-over-year growth 2025-2030 (%)
Data Table on Chile - Year-over-year growth 2025-2030 (%)

12.7 Middle East and Africa - Market size and forecast 2025-2030

Chart on Middle East and Africa - Market size and forecast 2025-2030 ($ million)
Data Table on Middle East and Africa - Market size and forecast 2025-2030 ($ million)
Chart on Middle East and Africa - Year-over-year growth 2025-2030 (%)
Data Table on Middle East and Africa - Year-over-year growth 2025-2030 (%)
Chart on Regional Comparison - Middle East and Africa
Data Table on Regional Comparison - Middle East and Africa

12.7.1 Saudi Arabia - Market size and forecast 2025-2030

Chart on Saudi Arabia - Market size and forecast 2025-2030 ($ million)
Data Table on Saudi Arabia - Market size and forecast 2025-2030 ($ million)
Chart on Saudi Arabia - Year-over-year growth 2025-2030 (%)
Data Table on Saudi Arabia - Year-over-year growth 2025-2030 (%)

12.7.2 UAE - Market size and forecast 2025-2030

Chart on UAE - Market size and forecast 2025-2030 ($ million)
Data Table on UAE - Market size and forecast 2025-2030 ($ million)
Chart on UAE - Year-over-year growth 2025-2030 (%)
Data Table on UAE - Year-over-year growth 2025-2030 (%)

12.7.3 South Africa - Market size and forecast 2025-2030

Chart on South Africa - Market size and forecast 2025-2030 ($ million)
Data Table on South Africa - Market size and forecast 2025-2030 ($ million)
Chart on South Africa - Year-over-year growth 2025-2030 (%)
Data Table on South Africa - Year-over-year growth 2025-2030 (%)

12.7.4 Israel - Market size and forecast 2025-2030

Chart on Israel - Market size and forecast 2025-2030 ($ million)
Data Table on Israel - Market size and forecast 2025-2030 ($ million)
Chart on Israel - Year-over-year growth 2025-2030 (%)
Data Table on Israel - Year-over-year growth 2025-2030 (%)

12.7.5 Turkey - Market size and forecast 2025-2030

Chart on Turkey - Market size and forecast 2025-2030 ($ million)
Data Table on Turkey - Market size and forecast 2025-2030 ($ million)
Chart on Turkey - Year-over-year growth 2025-2030 (%)
Data Table on Turkey - Year-over-year growth 2025-2030 (%)

12.8 Market opportunity by geography

Market opportunity by geography ($ million)
Data Tables on Market opportunity by geography ($ million)

13. Drivers, Challenges, and Opportunity

13.1 Market drivers

Increase in electricity consumption is augmenting market growth
Rising need for energy-efficient infrastructure
Surge in data center standards for operating green facilities

13.2 Market challenges

High cost of building green data center
Higher OPEX involved in renovating existing data center
Low awareness and lack of expertise

13.3 Impact of drivers and challenges

Impact of drivers and challenges in 2025 and 2030

13.4 Market opportunities

Increased use of DCIM and automation
Rising water consumption by data center
Operation of data center in tropical climate

14. Competitive Landscape

14.1 Overview

14.2

Overview on criticality of inputs and factors of differentiation

14.3 Landscape disruption

Overview on factors of disruption

14.4 Industry risks

Impact of key risks on business

15. Competitive Analysis

15.1 Companies profiled

Companies covered

15.2 Company ranking index

15.3 Market positioning of companies

Matrix on companies position and classification

15.4 ABB Ltd.

ABB Ltd. - Overview
ABB Ltd. - Business segments
ABB Ltd. - Key news
ABB Ltd. - Key offerings
ABB Ltd. - Segment focus
SWOT

15.5 Daikin Industries Ltd.

Daikin Industries Ltd. - Overview
Daikin Industries Ltd. - Business segments
Daikin Industries Ltd. - Key offerings
Daikin Industries Ltd. - Segment focus
SWOT

15.6 Delta Electronics Inc.

Delta Electronics Inc. - Overview
Delta Electronics Inc. - Business segments
Delta Electronics Inc. - Key offerings
Delta Electronics Inc. - Segment focus
SWOT

15.7 Digital Realty Trust Inc.

Digital Realty Trust Inc. - Overview
Digital Realty Trust Inc. - Product / Service
Digital Realty Trust Inc. - Key offerings
SWOT

15.8 Eaton Corp. Plc

Eaton Corp. Plc - Overview
Eaton Corp. Plc - Business segments
Eaton Corp. Plc - Key news
Eaton Corp. Plc - Key offerings
Eaton Corp. Plc - Segment focus
SWOT

15.9 Equinix Inc.

Equinix Inc. - Overview
Equinix Inc. - Business segments
Equinix Inc. - Key news
Equinix Inc. - Key offerings
Equinix Inc. - Segment focus
SWOT

15.10 GE Vernova Inc.

GE Vernova Inc. - Overview
GE Vernova Inc. - Business segments
GE Vernova Inc. - Key offerings
GE Vernova Inc. - Segment focus
SWOT

15.11 Google LLC

Google LLC - Overview
Google LLC - Product / Service
Google LLC - Key offerings
SWOT

15.12 Hitachi Energy Ltd.

Hitachi Energy Ltd. - Overview
Hitachi Energy Ltd. - Product / Service
Hitachi Energy Ltd. - Key offerings
SWOT

15.13 Iron Mountain Inc.

Iron Mountain Inc. - Overview
Iron Mountain Inc. - Business segments
Iron Mountain Inc. - Key offerings
Iron Mountain Inc. - Segment focus
SWOT

15.14 Meta Platforms Inc.

Meta Platforms Inc. - Overview
Meta Platforms Inc. - Business segments
Meta Platforms Inc. - Key offerings
Meta Platforms Inc. - Segment focus
SWOT

15.15 Microsoft Corp.

Microsoft Corp. - Overview
Microsoft Corp. - Business segments
Microsoft Corp. - Key news
Microsoft Corp. - Key offerings
Microsoft Corp. - Segment focus
SWOT

15.16 Mitsubishi Heavy Industries

Mitsubishi Heavy Industries - Overview
Mitsubishi Heavy Industries - Business segments
Mitsubishi Heavy Industries - Key offerings
Mitsubishi Heavy Industries - Segment focus
SWOT

15.17 Schneider Electric SE

Schneider Electric SE - Overview
Schneider Electric SE - Business segments
Schneider Electric SE - Key news
Schneider Electric SE - Key offerings
Schneider Electric SE - Segment focus
SWOT

15.18 Vertiv Holdings Co.

Vertiv Holdings Co. - Overview
Vertiv Holdings Co. - Business segments
Vertiv Holdings Co. - Key news
Vertiv Holdings Co. - Key offerings
Vertiv Holdings Co. - Segment focus
SWOT

16. Appendix

16.1 Scope of the report

Market definition
Objectives
Notes and caveats

16.2 Inclusions and exclusions checklist

Inclusions checklist
Exclusions checklist

16.3 Currency conversion rates for US$

16.4 Research methodology

16.5 Data procurement

Information sources

16.6 Data validation

16.7 Validation techniques employed for market sizing

16.8 Data synthesis

16.9 360 degree market analysis

16.10 List of abbreviations

Research Methodology

Technavio presents a detailed picture of the market by way of study, synthesis, and summation of data from multiple sources. The analysts have presented the various facets of the market with a particular focus on identifying the key industry influencers. The data thus presented is comprehensive, reliable, and the result of extensive research, both primary and secondary.

INFORMATION SOURCES

Primary sources

  • Manufacturers and suppliers
  • Channel partners
  • Industry experts
  • Strategic decision makers

Secondary sources

  • Industry journals and periodicals
  • Government data
  • Financial reports of key industry players
  • Historical data
  • Press releases

DATA ANALYSIS

Data Synthesis

  • Collation of data
  • Estimation of key figures
  • Analysis of derived insights

Data Validation

  • Triangulation with data models
  • Reference against proprietary databases
  • Corroboration with industry experts

REPORT WRITING

Qualitative

  • Market drivers
  • Market challenges
  • Market trends
  • Five forces analysis

Quantitative

  • Market size and forecast
  • Market segmentation
  • Geographical insights
  • Competitive landscape

Interested in this report?

Get your sample now to see our research methodology and insights!

Download Now

Frequently Asked Questions

Green Data Center (GDC) market growth will increase by USD 114228.1 million during 2026-2030.

The Green Data Center (GDC) market is expected to grow at a CAGR of 14.5% during 2026-2030.

Green Data Center (GDC) market is segmented by Component (IT infrastructure, Power solutions, General construction, Cooling solutions, Monitoring and management) End-user (BFSI, Energy, IT and telecom, Others) Type (Hyperscale data centers, Colocation data centers, Enterprise data centers)

ABB Ltd., Amazon.com Inc., Daikin Industries Ltd., Delta Electronics Inc., Digital Realty Trust Inc., Eaton Corp. Plc, Equinix Inc., GE Vernova Inc., Google LLC, Green Revolution Cooling Inc., Hitachi Energy Ltd., Iron Mountain Inc., LiquidStack BV, LITE ON Technology Corp., Meta Platforms Inc., Microsoft Corp., Mitsubishi Heavy Industries, Schneider Electric SE, Submer Technologies SL, Vertiv Holdings Co. are a few of the key vendors in the Green Data Center (GDC) market.

Europe will register the highest growth rate of 44.4% among the other regions. Therefore, the Green Data Center (GDC) market in Europe is expected to garner significant business opportunities for the vendors during the forecast period.

Germany, UK, France, Italy, Spain, The Netherlands, US, Canada, Mexico, China, Japan, India, South Korea, Australia, Indonesia, Brazil, Argentina, Chile, Saudi Arabia, UAE, South Africa, Israel, Turkey

  • Increase in electricity consumption is augmenting market growth is the driving factor this market.

The Green Data Center (GDC) market vendors should focus on grabbing business opportunities from the Component segment as it accounted for the largest market share in the base year.
RIA - Research AI Assistant
Ask RIA