Activated Alumina Market Size 2025-2029
The activated alumina market size is forecast to increase by USD 321.2 million at a CAGR of 5.4% between 2024 and 2029.
- The market is driven by the escalating demand for water treatment solutions due to increasing water scarcity and stringent regulations. This demand is further fueled by the rising awareness of sustainable and high-efficiency adsorbents, making activated alumina an attractive option for water purification applications. Brand reputation and financial performance are crucial factors for market players, as specific applications in water treatment, catalysis, and chromatography require high-quality alumina grades. However, the market faces challenges from alternative adsorbents, such as silica gel and zeolites, which offer similar water treatment capabilities. These competitors pose a significant threat, particularly in industries where cost and efficiency are critical factors.
- Additionally, investments in research and development to improve the efficiency and sustainability of activated alumina production processes could provide a competitive edge. Overall, the market presents significant growth potential for companies that can effectively address the evolving needs of the water treatment industry and differentiate themselves from competitors. The superior adsorption capacity of spherical activated alumina compared to other adsorbents like silica gel and molecular sieves makes it a preferred choice for these applications.
What will be the Size of the Activated Alumina Market during the forecast period?
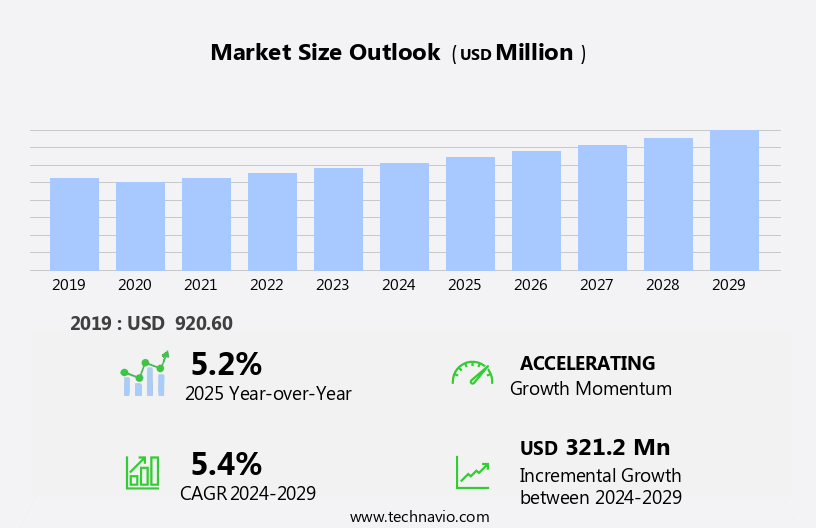
Explore in-depth regional segment analysis with market size data - historical 2019-2023 and forecasts 2025-2029 - in the full report.
Request Free Sample
The market exhibits dynamic trends, driven by the need for technical expertise in raw material sourcing and waste management. Emerging technologies, such as nanotechnology and membrane filtration, offer opportunities for product differentiation and competitive advantage. Pricing strategy and energy efficiency are essential elements of production optimization, as global demand for activated alumina continues to grow. Product lifecycle management, distribution channels, and future outlook are key aspects of business relationships and sales strategies. Industry knowledge and quality assurance are vital for market penetration, while cost reduction and service levels are essential for customer loyalty.
Risk management and growth opportunities are influenced by customer preferences and technological disruption, driving new product development and environmental impact considerations. The market is also driven by the increasing focus on sustainable water management, renewable energy, and green chemistry in various sectors. Effective supply chain management, industry standards, and return on investment are critical for manufacturing technologies and profitability in the market. Regional variations and marketing channels further shape the competitive landscape, as business relationships and sales strategies evolve to meet the needs of diverse customer bases.
How is this Activated Alumina Industry segmented?
The activated alumina industry research report provides comprehensive data (region-wise segment analysis), with forecasts and estimates in "USD million" for the period 2025-2029, as well as historical data from 2019-2023 for the following segments.
- End-user
- Oil and gas
- Petrochemicals
- Automotive
- Refractories
- Others
- Application
- Desiccant
- Adsorbent
- Catalyst support
- Others
- Grade Type
- Standard grade
- High purity grade
- Ultra-high purity grade
- Geography
- North America
- US
- Europe
- Germany
- Russia
- Middle East and Africa
- UAE
- APAC
- China
- India
- Japan
- South Korea
- South America
- Brazil
- Rest of World (ROW)
- North America
By End-user Insights
The Oil and gas segment is estimated to witness significant growth during the forecast period. Activated alumina is a valuable commodity in the oil and gas industry, serving multiple functions as an adsorbent and catalyst support. In gas drying applications, it effectively removes moisture from natural gas, LNG, and compressed air systems, preventing pipeline corrosion and safeguarding operational safety. The material's high surface area and thermal stability ensure consistent performance under varying conditions. In desulfurization processes, activated alumina functions as a catalyst support in hydroprocessing units, facilitating the removal of sulfur compounds from fuels. Its porous structure, with pore sizes ranging from nanometers to microns, is essential for adsorption processes in water purification and impurity removal.
Activated alumina's desiccant properties make it an indispensable component in industrial hygiene and air purification systems, removing volatile organic compounds (VOCs) and other impurities. Its versatility extends to environmental remediation, where it is used for arsenic and mercury removal. The market is experiencing significant growth due to increasing demand for water treatment applications, particularly in the oil & gas industry for desulfurization and water recycling. The manufacturing process involves activation through heating, resulting in a material with a high specific surface area, mechanical strength, and bulk density. Activated alumina's ability to undergo surface modification and its role as a catalyst support in chemical processing further broadens its applications. The material's adsorption capacity, chemical stability, and compatibility with industrial gases make it an essential component in various industries.
Testing methods such as BET, X-ray diffraction, scanning electron microscopy, mercury intrusion porosimetry, and thermogravimetric analysis are used to evaluate its quality and performance. Safety data sheets provide essential information on its handling, storage conditions, and potential hazards. To capitalize on market opportunities and navigate challenges effectively, companies must focus on enhancing the unique benefits of activated alumina, such as its high adsorption capacity, low cost, and wide applicability in various industries. Furthermore, government initiatives to promote water treatment and wastewater management are expected to create opportunities for market expansion.
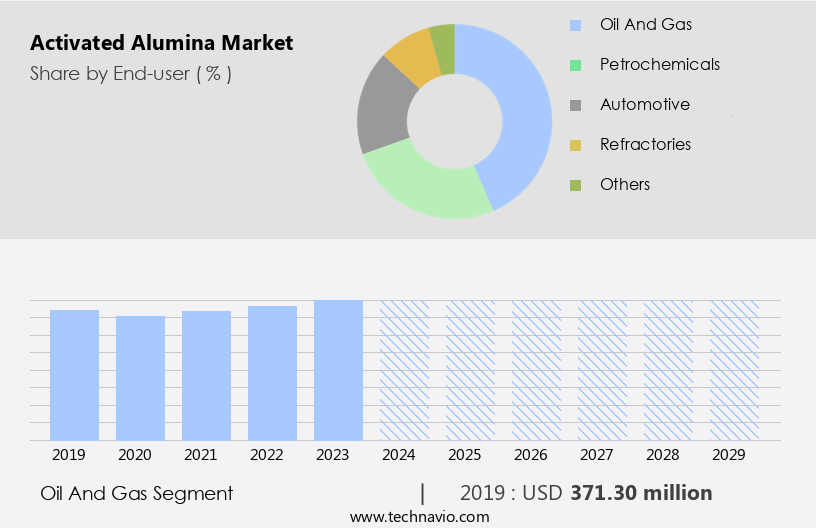
The Oil and gas segment was valued at USD 371.30 million in 2019 and showed a gradual increase during the forecast period.
Regional Analysis
APAC is estimated to contribute 42% to the growth of the global market during the forecast period.Technavio's analysts have elaborately explained the regional trends and drivers that shape the market during the forecast period.
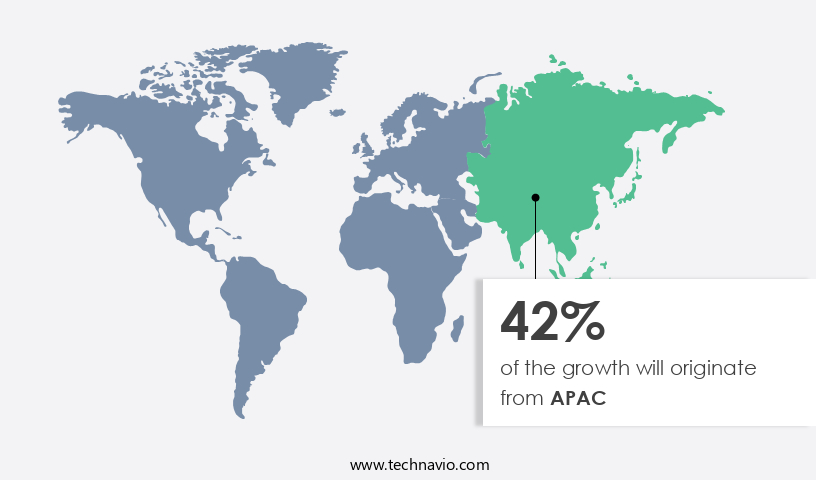
The market in Asia-Pacific (APAC) is the global leader in terms of both size and growth dynamics. This dominance can be attributed to the region's industrial expansion, water stress conditions, and strategic position in energy and electronics supply chains. The market's evolution reflects the economic dichotomy of APAC, with high-tech manufacturing in China supplying petrochemical catalysts and electronics in Guangdong, while rural water projects and gas grid expansion in India fuel demand for standard, high-purity, and ultra-high-purity alumina grades. Storage conditions and performance standards are crucial factors in the market, ensuring the maintained quality of activated alumina in various applications. Additionally, it is employed in water purification technologies for municipal and industrial water treatment, desalination, and power generation.
Drying agents are employed during the manufacturing process to remove moisture and enhance adsorption capacity. Pharmaceutical applications, such as arsenic and mercury removal, benefit from the desiccant properties of activated alumina. Environmental remediation applications, like VOC removal and gas purification, rely on the adsorption capacity and surface modification of activated alumina. In industrial processes, activated alumina is used as a catalyst support and for impurity removal in water and industrial gases. The manufacturing process involves testing methods like BET, X-ray diffraction, scanning electron microscopy, mercury intrusion porosimetry, and thermogravimetric analysis to ensure product specifications and safety data sheet compliance.
Activated alumina is available in various forms, including granules, cylinders, spheres, pellets, and powders, catering to diverse material handling and application requirements. The high surface area and mechanical strength of activated alumina make it suitable for air purification and industrial hygiene applications. Differential scanning calorimetry and thermal stability analysis are essential testing methods to assess chemical processing and thermal stability. Fluoride and mercury removal are significant applications in the market, driven by stringent regulations and growing environmental concerns. Activated alumina's ability to adsorb impurities and its chemical stability make it an ideal solution for these applications. The market is subject to continuous process control and quality control measures to maintain the desired adsorption capacity and product specifications.
Market Dynamics
Our researchers analyzed the data with 2024 as the base year, along with the key drivers, trends, and challenges. A holistic analysis of drivers will help companies refine their marketing strategies to gain a competitive advantage.
What are the Activated Alumina market drivers leading to the rise in the adoption of Industry?
- The increasing demand for effective water treatment solutions serves as the primary market driver. The market experiences significant growth due to the increasing demand for clean and safe drinking water. Activated alumina is a crucial component in water treatment systems, renowned for its superior adsorption capabilities in removing hazardous substances like fluoride, arsenic, lead, and selenium. This is particularly important in areas dealing with groundwater contamination. According to recent data from the World Health Organization (WHO) and UNICEF, approximately 2.2 billion people worldwide, or one in four, lack access to safely managed drinking water. Moreover, 115 million individuals rely on untreated surface water, emphasizing the necessity of effective water purification solutions.
- Activated alumina's performance standards are maintained through rigorous storage conditions and material handling procedures. Its drying agent properties make it an ideal desiccant in various applications, including pharmaceuticals. In pharmaceutical applications, its pore size distribution plays a significant role in ensuring efficient drug adsorption and separation processes. To evaluate the properties of activated alumina, several analytical techniques are employed, including the Brunauer-Emmett-Teller (BET) method, X-ray diffraction, and scanning electron microscopy. Mercury intrusion porosimetry is another technique used to measure the pore size distribution and surface area of activated alumina granules. These methods provide valuable insights into the material's structure and properties, ensuring consistent and reliable performance.
What are the Activated Alumina market trends shaping the Industry?
- The increasing preference for sustainable and high-efficiency adsorbents is a notable market trend. This demand stems from the growing awareness of environmental concerns and the need for energy savings in various industries. The market is experiencing notable growth due to the heightened focus on sustainability and efficiency in various industries. This trend is driven by stricter environmental regulations and the implementation of circular economy principles. In response, manufacturers are innovating advanced surface-modified alumina formulations, which exhibit improved selectivity for emerging contaminants such as per- and polyfluoroalkyl substances (PFAS), heavy metals, and pharmaceutical residues.
- Differential scanning calorimetry (DSC) and thermogravimetric analysis (TGA) are utilized in the production process to ensure consistent particle size distribution and bulk density in activated alumina cylinders and spheres. These technologies enable optimal chemical processing and enhance the overall performance of the adsorbent material. These advancements are particularly significant in water treatment applications, where there is a growing demand for effective adsorbent technologies to ensure regulatory compliance and safeguard public health. Additionally, the energy sector is contributing to this trend, as activated alumina plays a vital role in hydrogen purification and carbon capture systems.
How does Activated Alumina market face challenges during its growth?
-
Supply chain vulnerability and intensifying competition from alternative solutions are key challenges for the activated alumina market, limiting growth and threatening stability due to constrained bauxite reserves and rising substitutes. The market experiences significant competition from alternative adsorbents, including silica gel and activated carbon, which offer comparable or superior performance characteristics at more competitive prices. Traditional substitutes dominate certain applications due to their well-established supply chains and lower costs. Advanced materials like zeolites and metal-organic frameworks are gaining traction in specialized sectors, presenting a formidable challenge to activated alumina.
- The performance of activated alumina is crucial in various industries, including water purification and industrial gases, for impurity removal. Its chemical stability, high adsorption capacity, and large specific surface area make it an effective adsorbent. Mechanical strength is also a vital consideration, ensuring the material can withstand the demands of industrial processes. Quality control is essential to maintain the consistency and effectiveness of activated alumina products, whether in powder or bead form. Despite the competition, activated alumina's versatility and proven performance make it a valuable component in numerous applications.
Exclusive Customer Landscape
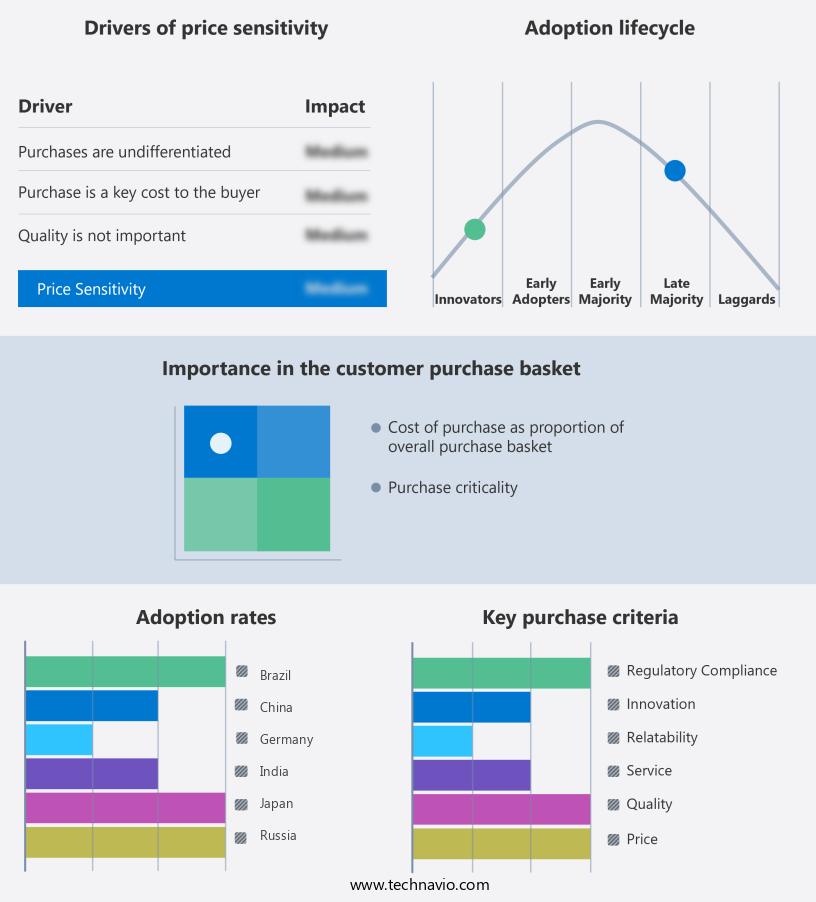
The activated alumina market forecasting report includes the adoption lifecycle of the market, covering from the innovator's stage to the laggard's stage. It focuses on adoption rates in different regions based on penetration. Furthermore, the activated alumina market report also includes key purchase criteria and drivers of price sensitivity to help companies evaluate and develop their market growth analysis strategies.
Customer Landscape
Key Companies & Market Insights
Companies are implementing various strategies, such as strategic alliances, activated alumina market forecast, partnerships, mergers and acquisitions, geographical expansion, and product/service launches, to enhance their presence in the industry.
Adsorption Technologies - The company specializes in Activated Alumina, offering key product variants in sizes like 4 MM and 3 MM as part of its global product portfolio.
The industry research and growth report includes detailed analyses of the competitive landscape of the market and information about key companies, including:
- Adsorption Technologies
- AGC Chemicals Pvt. Ltd.
- Axens Group
- BASF SE
- Bee Chems
- CHALCO Advanced Material Co., Ltd.
- Desicca Chemical Pvt. Ltd.
- Dynamic Adsorbents Inc
- Evonik Industries AG
- Guangdong Xintao Technology Co. Ltd.
- HengYe Inc.
- Honeywell International Inc.
- J M Huber Corp.
- Jiangxi OIM Chemical Co. ltd
- Luoyang Xinghua Chemical Co.Ltd
- Sialca Industries
- Smart elements GmbH
- Sorbchem India Pvt Ltd.
- Sumitomo Chemical Co. Ltd.
- Zibo Yinghe Chemical Co Ltd
Qualitative and quantitative analysis of companies has been conducted to help clients understand the wider business environment as well as the strengths and weaknesses of key industry players. Data is qualitatively analyzed to categorize companies as pure play, category-focused, industry-focused, and diversified; it is quantitatively analyzed to categorize companies as dominant, leading, strong, tentative, and weak.
Recent Development and News in Activated Alumina Market
- In January 2024, DuPont Water & Protection announced the launch of its new Activated Alumina product line, AluCycle, designed for the selective removal of fluoride and arsenic from drinking water (DuPont press release). This innovative solution marked a significant advancement in water treatment technologies.
- In March 2024, 3M and Pall Corporation entered into a strategic partnership to co-develop and commercialize activated alumina-based water filtration systems, combining 3M's water filtration expertise with Pall's separation technology (3M press release). This collaboration aimed to address the growing demand for advanced water filtration solutions.
- In May 2024, Kuraray Co. Ltd., a leading global chemical manufacturer, completed the acquisition of Activated Carbon Business from Cabot Corporation. The acquisition included Cabot's activated alumina business, expanding Kuraray's product portfolio and market presence in the water treatment industry (Kuraray press release).
- In April 2025, the European Union approved the use of activated alumina in drinking water treatment under the Drinking Water Directive, paving the way for increased adoption of this technology in Europe (European Commission press release). This regulatory approval marked a significant milestone for the market in Europe.
Research Analyst Overview
Activated alumina continues to be a dynamic and evolving market, with ongoing advancements in applications and technologies. This versatile material is widely used for various purposes, including continuous improvement in storage conditions and performance standards. As a drying agent, activated alumina plays a crucial role in pharmaceutical applications, ensuring the desiccant properties are maintained. Environmental remediation is another sector where activated alumina's adsorption capacity is harnessed, with applications in VOC removal and gas purification. Surface modification techniques enhance its efficiency in air purification and arsenic removal, making it an essential component in industrial hygiene.
Differential scanning calorimetry, x-ray diffraction, scanning electron microscopy, mercury intrusion porosimetry, and other testing methods are employed to understand the material's properties, such as pore size distribution, particle size distribution, bulk density, and specific surface area. These characteristics influence the material's performance in chemical processing, where activated alumina cylinders, spheres, pellets, and beads are used as catalyst supports or adsorbents. Manufacturing processes are continually refined to improve the material's mechanical strength, thermal stability, and abrasion resistance.
Activated alumina's role extends to impurity removal in industrial gases and water purification, making it a valuable asset in various industries. The ongoing research and development in this field ensure that activated alumina remains a dynamic and essential material, with new applications and advancements continually unfolding. The market's continuous evolution is driven by the need for improved efficiency, cost-effectiveness, and environmental sustainability, making it an exciting area for innovation and growth. Zeolites, in particular, are preferred for their molecular sieve properties and higher selectivity in gas separation and refining processes. Their adoption in the petrochemical industry, especially for sulfur removal and catalytic cracking, is gradually displacing activated alumina in key application areas.
The Activated Alumina Market is gaining traction across industries due to its versatile applications in purification and treatment. Central to this is activated alumina adsorption, a process used extensively for fluoride removal in water treatment systems. Manufacturers are offering tailored solutions including activated alumina spheres, activated alumina pellets, activated alumina powder, and activated alumina beads, each designed for specific flow rates, porosity, and capacity. Understanding gas adsorption isotherms is vital for optimizing these materials in air drying and gas purification setups. Furthermore, detailed product specifications play a crucial role in ensuring compatibility and performance across varied environments.
Dive into Technavio's robust research methodology, blending expert interviews, extensive data synthesis, and validated models for unparalleled Activated Alumina Market insights. See full methodology.
|
Market Scope |
|
|
Report Coverage |
Details |
|
Page number |
236 |
|
Base year |
2024 |
|
Historic period |
2019-2023 |
|
Forecast period |
2025-2029 |
|
Growth momentum & CAGR |
Accelerate at a CAGR of 5.4% |
|
Market growth 2025-2029 |
USD 321.2 million |
|
Market structure |
Fragmented |
|
YoY growth 2024-2025(%) |
5.2 |
|
Key countries |
China, US, India, Germany, Japan, Russia, South Korea, Brazil, UAE, and Saudi Arabia |
|
Competitive landscape |
Leading Companies, Market Positioning of Companies, Competitive Strategies, and Industry Risks |
What are the Key Data Covered in this Activated Alumina Market Research and Growth Report?
- CAGR of the Activated Alumina industry during the forecast period
- Detailed information on factors that will drive the growth and forecasting between 2025 and 2029
- Precise estimation of the size of the market and its contribution of the industry in focus to the parent market
- Accurate predictions about upcoming growth and trends and changes in consumer behaviour
- Growth of the market across APAC, North America, Europe, Middle East and Africa, and South America
- Thorough analysis of the market's competitive landscape and detailed information about companies
- Comprehensive analysis of factors that will challenge the activated alumina market growth of industry companies
We can help! Our analysts can customize this activated alumina market research report to meet your requirements.
 RIA -
RIA - 
