
AI Clinical Care Market Size 2025-2029
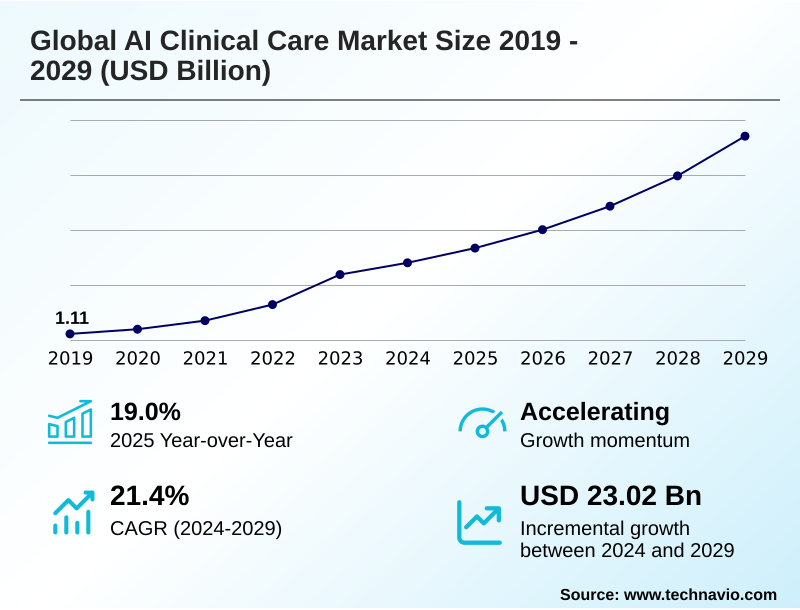
The ai clinical care market size is valued to increase by USD 23.02 billion, at a CAGR of 21.4% from 2024 to 2029. Proliferation of complex healthcare data and imperative for advanced analytics will drive the ai clinical care market.
Major Market Trends & Insights
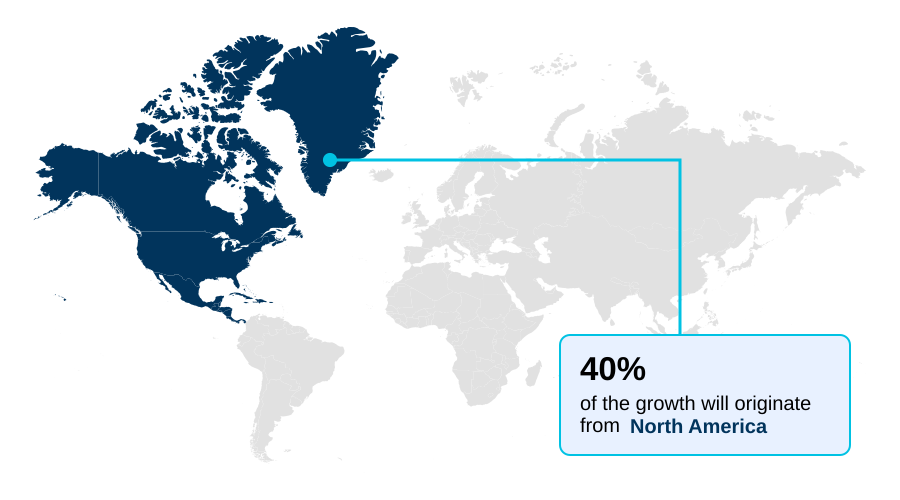
- North America dominated the market and accounted for a 40.1% growth during the forecast period.
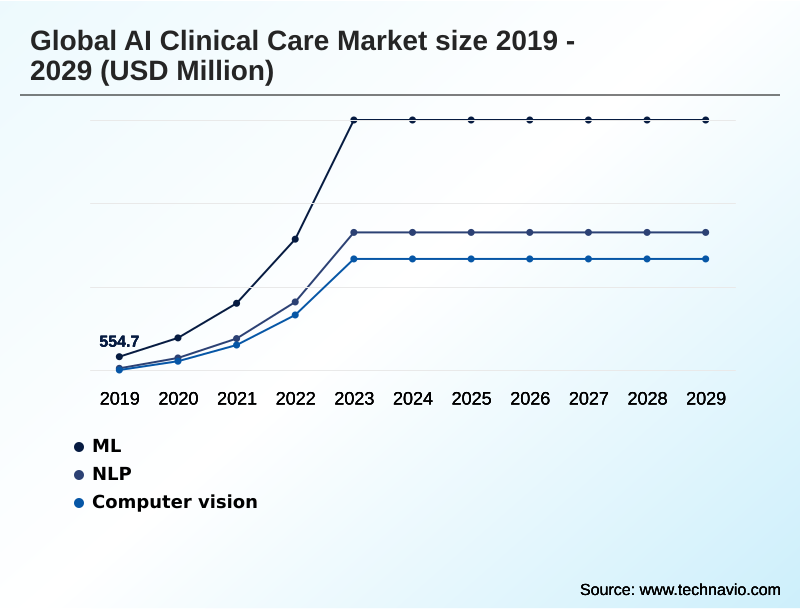
- By Technology - ML segment was valued at USD 5.83 billion in 2023
- By Application - Diagnostic imaging segment accounted for the largest market revenue share in 2023
Market Size & Forecast
- Market Opportunities: USD 35.95 billion
- Market Future Opportunities: USD 23.02 billion
- CAGR from 2024 to 2029 : 21.4%
Market Summary
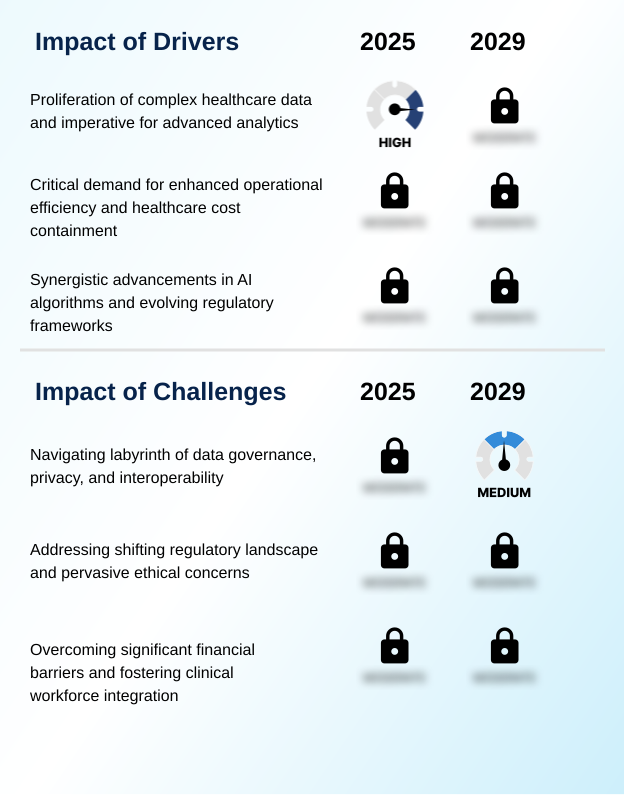
- The AI clinical care market is undergoing transformative expansion, driven by the convergence of immense healthcare datasets and powerful computational capabilities. This shift enables a move from reactive treatment to proactive, personalized health management. Key drivers include the pressing need to improve operational efficiency in strained healthcare systems and enhance the accuracy of diagnostics.
- A primary trend is the integration of generative AI into clinical workflows, automating documentation and augmenting decision-making. For instance, in a hospital setting, AI platforms analyze real-time patient data streams to predict the onset of critical conditions like sepsis, allowing for early intervention that significantly improves patient outcomes.
- These systems simultaneously optimize resource allocation by forecasting patient admission rates and managing bed capacity, enhancing patient flow. However, the market faces challenges related to data governance, patient privacy, and the need for clear interoperability standards.
- The development of explainable AI is crucial to building clinical trust, while ongoing efforts to mitigate algorithmic bias are essential for ensuring equitable care and addressing ethical concerns.
What will be the Size of the AI Clinical Care Market during the forecast period?
Get Key Insights on Market Forecast (PDF) Request Free Sample
How is the AI Clinical Care Market Segmented?
The ai clinical care industry research report provides comprehensive data (region-wise segment analysis), with forecasts and estimates in "USD million" for the period 2025-2029, as well as historical data from 2019-2023 for the following segments.
- Technology
- ML
- NLP
- Computer Vision
- Application
- Diagnostic imaging
- Predictive analytics
- Virtual health assistants
- End-user
- Hospitals
- Clinics
- Research institutions
- Telehealth providers
- Geography
- North America
- US
- Canada
- Mexico
- APAC
- China
- Japan
- India
- Europe
- Germany
- UK
- France
- South America
- Brazil
- Argentina
- Colombia
- Middle East and Africa
- Israel
- UAE
- Saudi Arabia
- Rest of World (ROW)
- North America
By Technology Insights
The ml segment is estimated to witness significant growth during the forecast period.
The market is segmented by technology, application, and geography.
Machine Learning (ML) is the dominant technology, crucial for predictive analytics and diagnostic imaging, where tools for automated polyp detection and advanced medical image segmentation have led to a 19% improvement in diagnostic error reduction.
Application segments are led by diagnostic imaging and virtual health assistants. Geographically, North America leads, but all regions grapple with data governance and health data privacy.
Establishing robust interoperability standards is vital for effective patient flow management and using real-world evidence for AI in population health. Strong AI ethics in healthcare guide innovations in AI-assisted surgery, clinical trial matching, and therapeutic intervention, ensuring responsible deployment.
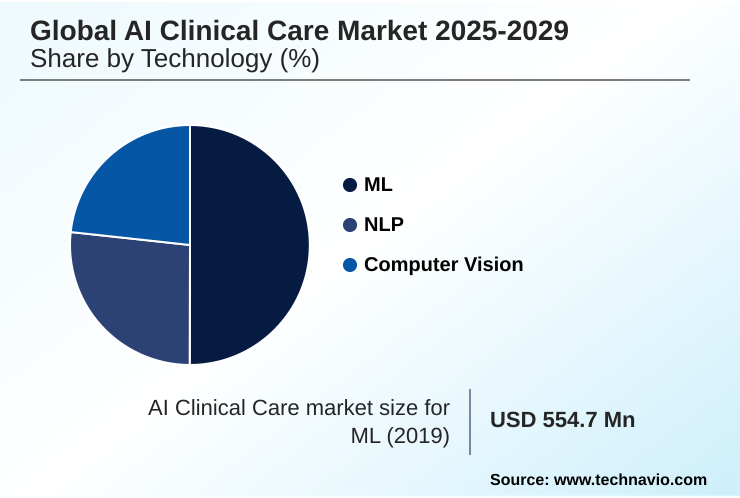
The ML segment was valued at USD 5.83 billion in 2023 and showed a gradual increase during the forecast period.
Regional Analysis
North America is estimated to contribute 40.1% to the growth of the global market during the forecast period.Technavio’s analysts have elaborately explained the regional trends and drivers that shape the market during the forecast period.
See How AI Clinical Care Market Demand is Rising in North America Request Free Sample
North America leads the market, contributing over 40% of the incremental growth, driven by advanced infrastructure and high investment in AI-enabled medical devices.
The region excels in applying deep learning algorithms to real-time data streams for applications in AI in cardiology and precision oncology.
The push for clinical data harmonization across systems facilitates complex tasks like cohort identification for trials and patient risk stratification.
In APAC, which shows the fastest growth rate, the focus is on scalable solutions that leverage genomic sequencing analysis for treatment pathway personalization. Across all regions, the implementation of health equity algorithm auditing is becoming critical.
Europe is focused on technologies like ambient clinical intelligence and automated medical coding, with deployments showing a 20% improvement in billing accuracy.
Market Dynamics
Our researchers analyzed the data with 2024 as the base year, along with the key drivers, trends, and challenges. A holistic analysis of drivers will help companies refine their marketing strategies to gain a competitive advantage.
- Strategic imperatives in healthcare are accelerating the adoption of AI for early disease detection, which leverages predictive models for patient outcomes to enable proactive interventions. A core application is the use of NLP for unstructured clinical data, transforming narrative notes into actionable insights. In diagnostics, computer vision in radiology workflow is becoming standard practice for reducing diagnostic errors with AI.
- This technology is crucial for improving hospital operational efficiency by streamlining workflows and reducing manual review times, with some facilities reporting a greater than two-fold increase in case throughput for certain imaging studies. The paradigm is shifting toward AI for personalized treatment plans, which are informed by a holistic view of the patient.
- The growth of generative AI for patient communication through virtual assistants is enhancing engagement and education. A significant focus is the AI role in chronic disease management, where AI in remote patient monitoring provides continuous oversight. The industry is also investing heavily in machine learning in drug discovery to shorten development timelines.
- Key enablers include SaaS models for clinical AI and effective clinical decision support system integration. Addressing technical and ethical hurdles, such as finding solutions for federated learning for data privacy and processes for AI algorithm validation process, is critical. Furthermore, a top priority is addressing algorithmic bias in healthcare to ensure equitable outcomes.
- The expansion of AI applications in telehealth is also broadening access to care, highlighting the cost-effectiveness of AI in healthcare when deployed thoughtfully after training AI on electronic health records. Finally, generative AI for diagnostic support acts as a cognitive assistant for clinicians.
What are the key market drivers leading to the rise in the adoption of AI Clinical Care Industry?
- The market is primarily driven by the proliferation of complex healthcare data and the corresponding imperative for advanced analytics to derive actionable clinical insights.
- The proliferation of electronic health records (EHR) provides the necessary data to drive market growth, fueling innovations in drug discovery and improvements in diagnostic accuracy.
- A clear regulatory pathway for Software as a Medical Device (SaMD) encourages development, while techniques like federated learning address data privacy concerns.
- The need for operational efficiency is a major driver, with robotic process automation (RPA) and cognitive automation streamlining administrative tasks. Technologies like AI-driven triage and clinical note summarization are reducing physician administrative time by up to 40%.
- The demand for patient-facing tools like virtual health assistants and systems for automated insulin delivery is also increasing, while developers actively work to mitigate algorithmic bias to ensure equitable outcomes across diverse populations.
What are the market trends shaping the AI Clinical Care Industry?
- A prominent market trend is the integration of generative AI for clinical documentation and diagnostic support. This is reshaping clinical workflows and augmenting decision-making processes.
- A transformative trend is the rapid integration of generative AI into clinical workflows, with large language models enhancing clinical decision support. The application of natural language processing automates documentation, while advancements in computer vision and medical imaging analysis are central to AI in radiology. These multimodal AI systems process diverse data inputs, leading to augmented clinical intelligence.
- The focus on explainable AI (XAI) is growing to ensure trust in systems performing predictive risk scoring and computational pathology. This shift enables more sophisticated predictive analytics, with some platforms improving diagnostic report generation speeds by over 50% compared to manual methods, while maintaining high accuracy rates of up to 98%.
What challenges does the AI Clinical Care Industry face during its growth?
- A key challenge affecting industry growth involves navigating the complexities of data governance, patient privacy regulations, and system interoperability.
- A significant challenge is integrating AI-powered diagnostics into existing hospital systems, which requires extensive clinical workflow optimization. The deployment of machine learning models for applications like personalized medicine and genomic data analysis faces hurdles related to data quality and infrastructure costs. Although remote patient monitoring and point-of-care diagnostics offer immense potential, their widespread adoption is hindered by reimbursement complexities.
- The development of a digital twin in healthcare or advanced AI for sepsis detection requires significant investment. Furthermore, ensuring that tools like intelligent chatbots provide clinically valid advice is a key concern. Successfully implementing care coordination platforms and tools for AI-powered drug screening or digital pathology often results in a 15% reduction in redundant testing but requires substantial upfront capital.
Exclusive Technavio Analysis on Customer Landscape
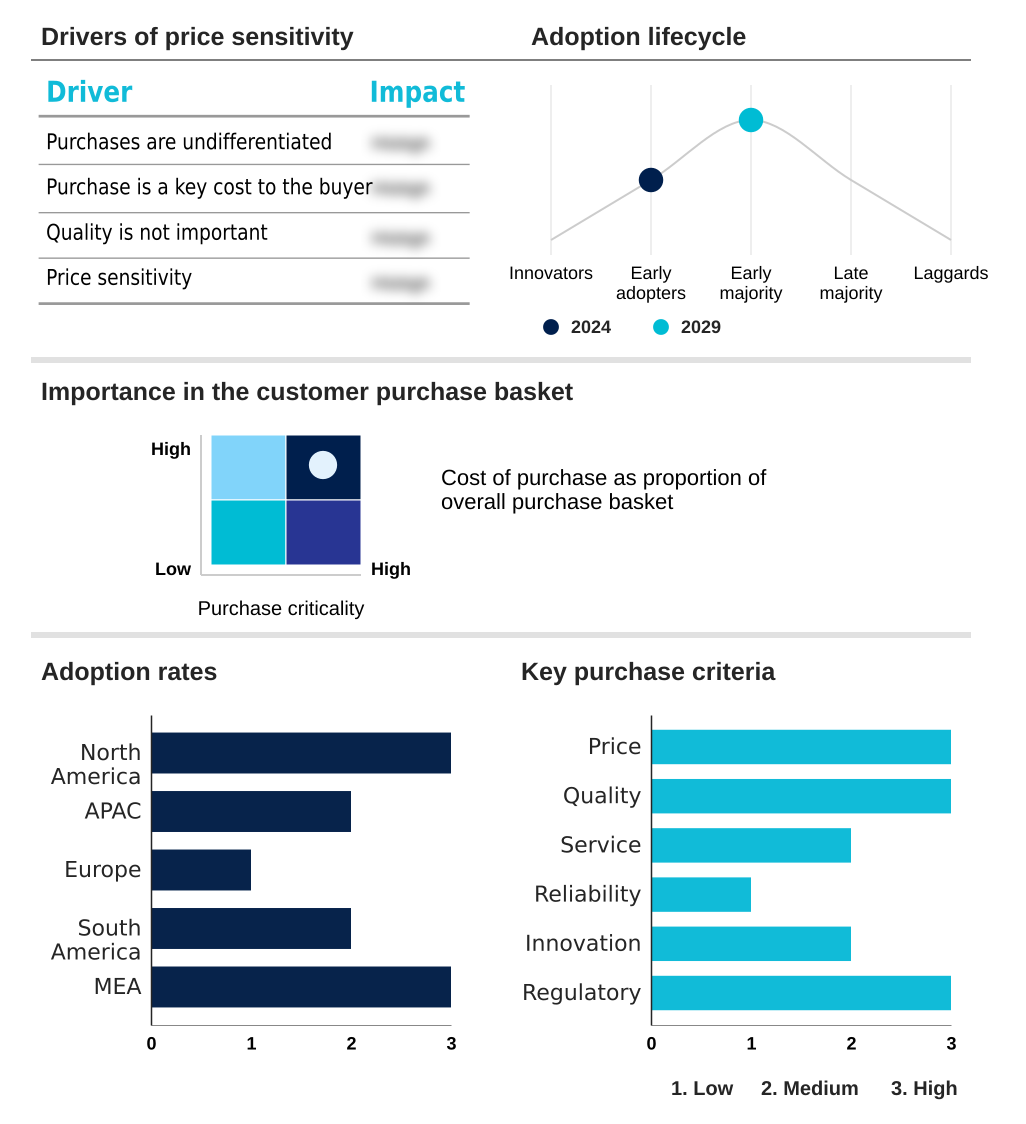
The ai clinical care market forecasting report includes the adoption lifecycle of the market, covering from the innovator’s stage to the laggard’s stage. It focuses on adoption rates in different regions based on penetration. Furthermore, the ai clinical care market report also includes key purchase criteria and drivers of price sensitivity to help companies evaluate and develop their market growth analysis strategies.
Customer Landscape of AI Clinical Care Industry
Competitive Landscape
Companies are implementing various strategies, such as strategic alliances, ai clinical care market forecast, partnerships, mergers and acquisitions, geographical expansion, and product/service launches, to enhance their presence in the industry.
Aidoc Medical Ltd. - Offerings focus on an AI operating system using multiple FDA-cleared algorithms to expedite patient treatment through advanced medical imaging analysis and improve care quality.
The industry research and growth report includes detailed analyses of the competitive landscape of the market and information about key companies, including:
- Aidoc Medical Ltd.
- Amazon Web Services Inc.
- Butterfly Network Inc.
- Epic Systems Corp.
- GE Healthcare Technologies
- Google LLC
- Koninklijke Philips NV
- Medtronic Plc
- Merative L.P.
- Microsoft Corp.
- Oracle Corp.
- Owkin Inc.
- PathAI Inc.
- Qure.ai Technologies Pvt. Ltd.
- Siemens Healthineers AG
- Tempus Labs Inc.
- Viz.ai Inc.
Qualitative and quantitative analysis of companies has been conducted to help clients understand the wider business environment as well as the strengths and weaknesses of key industry players. Data is qualitatively analyzed to categorize companies as pure play, category-focused, industry-focused, and diversified; it is quantitatively analyzed to categorize companies as dominant, leading, strong, tentative, and weak.
Recent Development and News in Ai clinical care market
- In September 2024, Prenosis Inc. received De Novo marketing authorization from the US Food and Drug Administration for its Sepsis ImmunoScore, establishing a new regulatory category for AI-based sepsis diagnosis software.
- In November 2024, AI Singapore and the National University Health System (NUHS) initiated a strategic collaboration to develop Southeast Asia's first large language model tailored for regional clinical and biomedical data.
- In January 2025, Microsoft Corp. announced the general availability of its DAX Copilot, a solution using ambient AI to automatically generate clinical summaries from physician-patient conversations, integrating directly into EHR systems.
- In April 2025, Annalise.ai secured US FDA 510(k) clearance for its Annalise Triage solution, an AI tool designed to identify and flag critical findings on chest X-rays to help radiologists prioritize urgent cases.
Dive into Technavio’s robust research methodology, blending expert interviews, extensive data synthesis, and validated models for unparalleled AI Clinical Care Market insights. See full methodology.
| Market Scope | |
|---|---|
| Page number | 299 |
| Base year | 2024 |
| Historic period | 2019-2023 |
| Forecast period | 2025-2029 |
| Growth momentum & CAGR | Accelerate at a CAGR of 21.4% |
| Market growth 2025-2029 | USD 23018.9 million |
| Market structure | Fragmented |
| YoY growth 2024-2025(%) | 19.0% |
| Key countries | US, Canada, Mexico, China, Japan, India, South Korea, Australia, Indonesia, Germany, UK, France, Italy, The Netherlands, Spain, Brazil, Argentina, Colombia, Israel, UAE, Saudi Arabia, South Africa and Turkey |
| Competitive landscape | Leading Companies, Market Positioning of Companies, Competitive Strategies, and Industry Risks |
Research Analyst Overview
- The AI clinical care market's architecture is built on machine learning models and deep learning algorithms that process real-time data streams and electronic health records (EHR) to enhance diagnostic accuracy. Key applications include medical imaging analysis, digital pathology, and AI-powered diagnostics, all governed by evolving interoperability standards.
- The drive for personalized medicine relies on sophisticated genomic data analysis and treatment pathway personalization. This necessitates strict data governance and health data privacy, often addressed through techniques like federated learning.
- For boardroom strategy, the approval pathway for Software as a Medical Device (SaMD) is a critical consideration, as regulatory clearance can improve market entry speed by up to 30% compared to traditional hardware. Innovations in natural language processing are transforming clinical documentation and enabling effective clinical trial matching and cohort identification.
- Simultaneously, tools for remote patient monitoring, AI-assisted surgery, and automated medical coding are driving clinical workflow optimization. The ultimate goal is to leverage real-world evidence for superior therapeutic intervention, while actively mitigating algorithmic bias and upholding principles of ambient clinical intelligence and patient-centric care through effective patient risk stratification.
What are the Key Data Covered in this AI Clinical Care Market Research and Growth Report?
-
What is the expected growth of the AI Clinical Care Market between 2025 and 2029?
-
USD 23.02 billion, at a CAGR of 21.4%
-
-
What segmentation does the market report cover?
-
The report is segmented by Technology (ML, NLP, Computer vision), Application (Diagnostic imaging, Predictive analytics, Virtual health assistants), End-user (Hospitals, Clinics, Research institutions, Telehealth providers) and Geography (North America, APAC, Europe, South America, Middle East and Africa)
-
-
Which regions are analyzed in the report?
-
North America, APAC, Europe, South America and Middle East and Africa
-
-
What are the key growth drivers and market challenges?
-
Proliferation of complex healthcare data and imperative for advanced analytics, Navigating labyrinth of data governance, privacy, and interoperability
-
-
Who are the major players in the AI Clinical Care Market?
-
Aidoc Medical Ltd., Amazon Web Services Inc., Butterfly Network Inc., Epic Systems Corp., GE Healthcare Technologies, Google LLC, Koninklijke Philips NV, Medtronic Plc, Merative L.P., Microsoft Corp., Oracle Corp., Owkin Inc., PathAI Inc., Qure.ai Technologies Pvt. Ltd., Siemens Healthineers AG, Tempus Labs Inc. and Viz.ai Inc.
-
Market Research Insights
- Market dynamics reflect a push for augmented clinical intelligence to achieve significant diagnostic error reduction, with some AI-enabled medical devices improving accuracy by over 20%. Care coordination platforms are optimizing patient flow management, cutting wait times by 15%. Innovations span from computational pathology and medical image segmentation to AI-driven triage.
- Patient engagement is enhanced by virtual health assistants and intelligent chatbots, while clinical tools target automated polyp detection and AI for sepsis detection. In specialized fields, AI in cardiology and precision oncology are advancing rapidly. Foundational trust is being built via explainable AI (XAI) and health equity algorithm auditing.
- Efficiency is driven by robotic process automation (RPA), cognitive automation, and clinical note summarization, supporting broader AI in population health initiatives.
We can help! Our analysts can customize this ai clinical care market research report to meet your requirements.
 RIA -
RIA - 
