AI In Medical Billing Market Analysis, Size, and Forecast 2025-2029: North America (US, Canada, and Mexico), Europe (Germany, UK, and France), APAC (China, Japan, and India), South America (Brazil, Argentina, and Colombia), Middle East and Africa (Saudi Arabia, UAE, and South Africa), and Rest of World (ROW)

AI In Medical Billing Market Analysis, Size, and Forecast 2025-2029:
North America (US, Canada, and Mexico), Europe (Germany, UK, and France), APAC (China, Japan, and India), South America (Brazil, Argentina, and Colombia), Middle East and Africa (Saudi Arabia, UAE, and South Africa), and Rest of World (ROW)

Published: Dec 2025 312 Pages SKU: IRTNTR81032

Market Overview at a Glance

$10.94 B
Market Opportunity
33.3%
CAGR 2024 - 2029
36.6%
North America Growth
$1.74 B
Cloud-based segment 2023

AI In Medical Billing Market Size 2025-2029

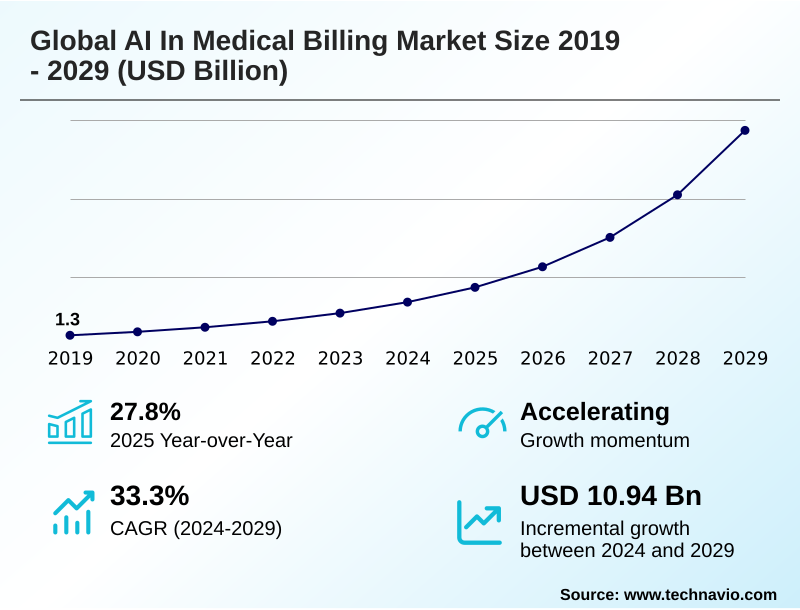
The ai in medical billing market size is valued to increase by USD 10.94 billion, at a CAGR of 33.3% from 2024 to 2029. Escalating complexity of medical coding and regulatory frameworks will drive the ai in medical billing market.

Major Market Trends & Insights

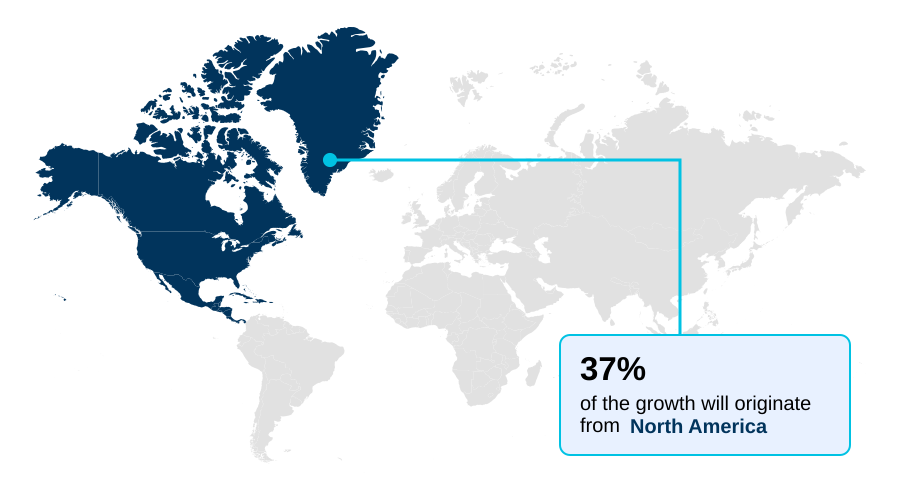
  • North America dominated the market and accounted for a 36.6% growth during the forecast period.
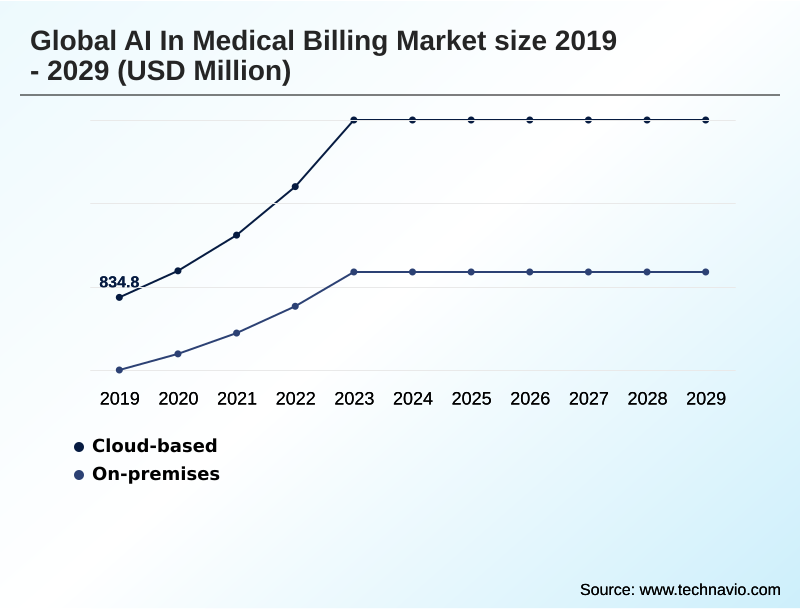
  • By Deployment - Cloud-based segment was valued at USD 1.74 billion in 2023
  • By Application - Claims processing and adjudication segment accounted for the largest market revenue share in 2023

Market Size & Forecast

  • Market Opportunities: USD 13.04 billion
  • Market Future Opportunities: USD 10.94 billion
  • CAGR from 2024 to 2029 : 33.3%

Market Summary

  • The AI in medical billing market is defined by a transformative shift toward intelligent automation to address persistent industry pressures. Escalating administrative costs, the intricate nature of medical coding complexity, and a shortage of skilled staff are compelling healthcare providers to adopt AI-powered solutions. These platforms leverage technologies like machine learning and natural language processing to enhance revenue cycle management.
  • For instance, a hospital system can deploy an AI tool for predictive denial management, which analyzes outgoing claims against historical payer behavior and complex reimbursement rules. This system flags claims with a high probability of rejection, allowing billing staff to make proactive corrections, thereby improving the clean claim rate and accelerating cash flow.
  • This move from reactive appeals to proactive error correction reduces operational overhead and allows personnel to focus on high-value tasks. The integration of generative AI in healthcare further propels this evolution, enabling automated appeal letter generation and sophisticated clinical documentation analysis, which are crucial for navigating value-based care models and ensuring financial stability.

What will be the Size of the AI In Medical Billing Market during the forecast period?

Get Key Insights on Market Forecast (PDF) Request Free Sample

How is the AI In Medical Billing Market Segmented?

The ai in medical billing industry research report provides comprehensive data (region-wise segment analysis), with forecasts and estimates in "USD million" for the period 2025-2029, as well as historical data from 2019-2023 for the following segments.

  • Deployment
    • Cloud-based
    • On-premises
  • Application
    • Claims processing and adjudication
    • Automated coding and documentation
    • Revenue analytics and forecasting
    • Fraud detection and risk scoring
    • Patient payment optimization
  • End-user
    • Hospitals and clinics
    • Healthcare payers
    • ASCs
    • Billing outsourcing firms
  • Geography
    • North America
      • US
      • Canada
      • Mexico
    • Europe
      • Germany
      • UK
      • France
    • APAC
      • China
      • Japan
      • India
    • South America
      • Brazil
      • Argentina
      • Colombia
    • Middle East and Africa
      • Saudi Arabia
      • UAE
      • South Africa
    • Rest of World (ROW)

By Deployment Insights

The cloud-based segment is estimated to witness significant growth during the forecast period.

The cloud-based deployment model, primarily delivered via cloud-based SaaS platforms, is central to the AI in medical billing market. This approach supports critical functions like predictive denial management and claim adjudication without requiring significant on-premises infrastructure.

It enables healthcare providers to achieve superior RCM workflow optimization and scalability. These platforms leverage natural language processing for clinical documentation analysis and claim scrubbing, which can automate over 90% of coding tasks.

This enhances risk adjustment accuracy and supports touchless claims processing, providing a framework for real-time compliance updates.

This model is foundational for achieving denial rate reduction and implementing effective patient financial engagement strategies that address self-pay account collections, ultimately improving cash flow forecasting.

Request Free Sample

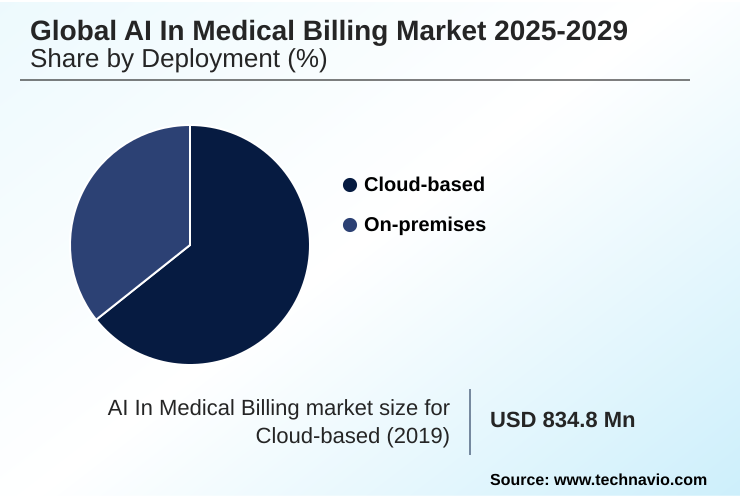
The Cloud-based segment was valued at USD 1.74 billion in 2023 and showed a gradual increase during the forecast period.

Request Free Sample

Regional Analysis

North America is estimated to contribute 36.6% to the growth of the global market during the forecast period.Technavio’s analysts have elaborately explained the regional trends and drivers that shape the market during the forecast period.

See How AI In Medical Billing Market Demand is Rising in North America Request Free Sample

The geographic landscape of the AI in medical billing market is led by North America, which accounts for over 36% of the market opportunity, driven by its complex multi-payer system and high technological adoption.

The region's focus on denial rate reduction and operational efficiency has spurred significant investment in platforms supporting computer-assisted coding and prior authorization automation.

Europe follows, with countries like Germany and the UK adopting AI to manage public and private insurance systems, emphasizing data privacy through techniques like federated learning models and data anonymization.

APAC is the fastest-growing region, with nations like India and China leveraging AI to manage large-scale public health initiatives and a burgeoning private sector.

The synergy between electronic health records and AI is critical globally, with successful implementations of upcoding detection and phantom billing analysis improving revenue integrity by over 10%.

Market Dynamics

Our researchers analyzed the data with 2024 as the base year, along with the key drivers, trends, and challenges. A holistic analysis of drivers will help companies refine their marketing strategies to gain a competitive advantage.

  • Strategically, calculating the ROI of AI in healthcare RCM is becoming a central boardroom exercise, as organizations weigh initial investment against long-term operational gains.
  • The core value is demonstrated through specific applications, such as using machine learning for claims fraud detection, which safeguards revenue integrity, and the use of AI for automating prior authorization requests, which directly reduces care delays and administrative friction. Furthermore, generative AI for drafting denial appeal letters is transforming a once manual and time-consuming process into an efficient, data-driven workflow.
  • AI platforms for revenue cycle management optimization are now essential for navigating the complexities of modern healthcare finance. The impact of AI on medical billing compliance is profound, as these systems offer dynamic updates to address shifting regulations.
  • A significant hurdle remains in integrating AI with legacy EHR systems, a task that can increase project timelines by more than 50% compared to simpler software rollouts. Overcoming the challenges of AI in medical billing, particularly around data integration and algorithmic transparency, is key to unlocking its full potential.
  • The technology's role extends to fine-tuning reimbursement through tools that help in optimizing hierarchical condition category coding with AI and automating claims adjudication with machine learning. Ultimately, the AI role in value-based care reimbursement models is to create a more efficient and accurate financial ecosystem for providers.

What are the key market drivers leading to the rise in the adoption of AI In Medical Billing Industry?

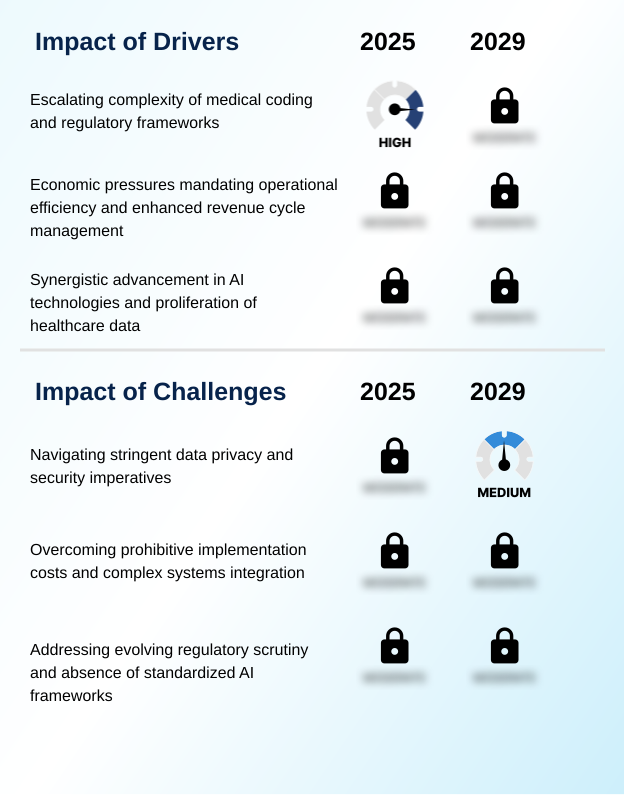
  • The escalating complexity of medical coding systems and evolving regulatory frameworks is a primary driver for the adoption of AI in medical billing.

  • Market growth is primarily driven by the convergence of advanced AI technologies and the escalating complexity of healthcare finance.
  • The proliferation of electronic health records has created vast datasets, fueling the efficacy of claims data analytics and large language models for clinical documentation analysis.
  • Economic pressures compel providers to seek solutions for denial rate reduction and RCM workflow optimization, with AI platforms delivering tangible results, such as accelerating payment cycles by up to 20%.
  • The technology directly addresses medical coding complexity, with computer-assisted coding and natural language processing automating the application of ICD-10 and CPT coding.
  • Furthermore, the shift to value-based care models makes tools for risk adjustment and hierarchical condition category coding essential for accurate reimbursement, solidifying AI's role in the industry.

What are the market trends shaping the AI In Medical Billing Industry?

  • A critical imperative for healthcare organizations is to enhance operational efficiency amid escalating administrative costs. This is driving the adoption of technological solutions to optimize complex revenue cycle management processes.

  • Key trends in the AI in medical billing market are centered on leveraging technology to address operational and regulatory pressures. The adoption of generative AI in healthcare is a transformative force, enabling sophisticated unstructured data extraction and automated appeal letter generation, which improves denial management automation.
  • This technology, often delivered via cloud-based SaaS platforms, helps providers navigate the intricacies of payer contract modeling and medical necessity criteria. A significant focus is on administrative burden reduction, with AI tools now automating tasks from point-of-care data capture to final remittance advice processing.
  • Implementations have demonstrated a marked improvement in first-pass claim acceptance rates, in some cases by over 15%, by ensuring proactive claim correction. This drive for efficiency is reshaping how healthcare organizations approach financial management and patient engagement.

What challenges does the AI In Medical Billing Industry face during its growth?

  • Navigating stringent data privacy regulations and ensuring robust cybersecurity imperatives are primary challenges affecting industry growth.

  • Significant challenges constrain the AI in medical billing market, led by stringent data privacy regulations and system integration challenges. Integrating advanced AI with legacy EHR interoperability issues often requires custom API integration, a process that can increase project costs by over 40%. The 'black box' algorithm problem raises concerns about transparency and accountability, particularly with evolving AI regulatory frameworks.
  • Healthcare organizations are cautious due to the high costs of implementation and the complexities of ensuring privacy-preserving AI through methods like federated learning models and data anonymization. Addressing potential algorithmic bias prevention is another critical hurdle to ensure equitable outcomes.
  • These factors create a difficult landscape for providers aiming to adopt solutions for chargemaster optimization and patient payment prediction while managing significant technical and compliance risks.

Exclusive Technavio Analysis on Customer Landscape

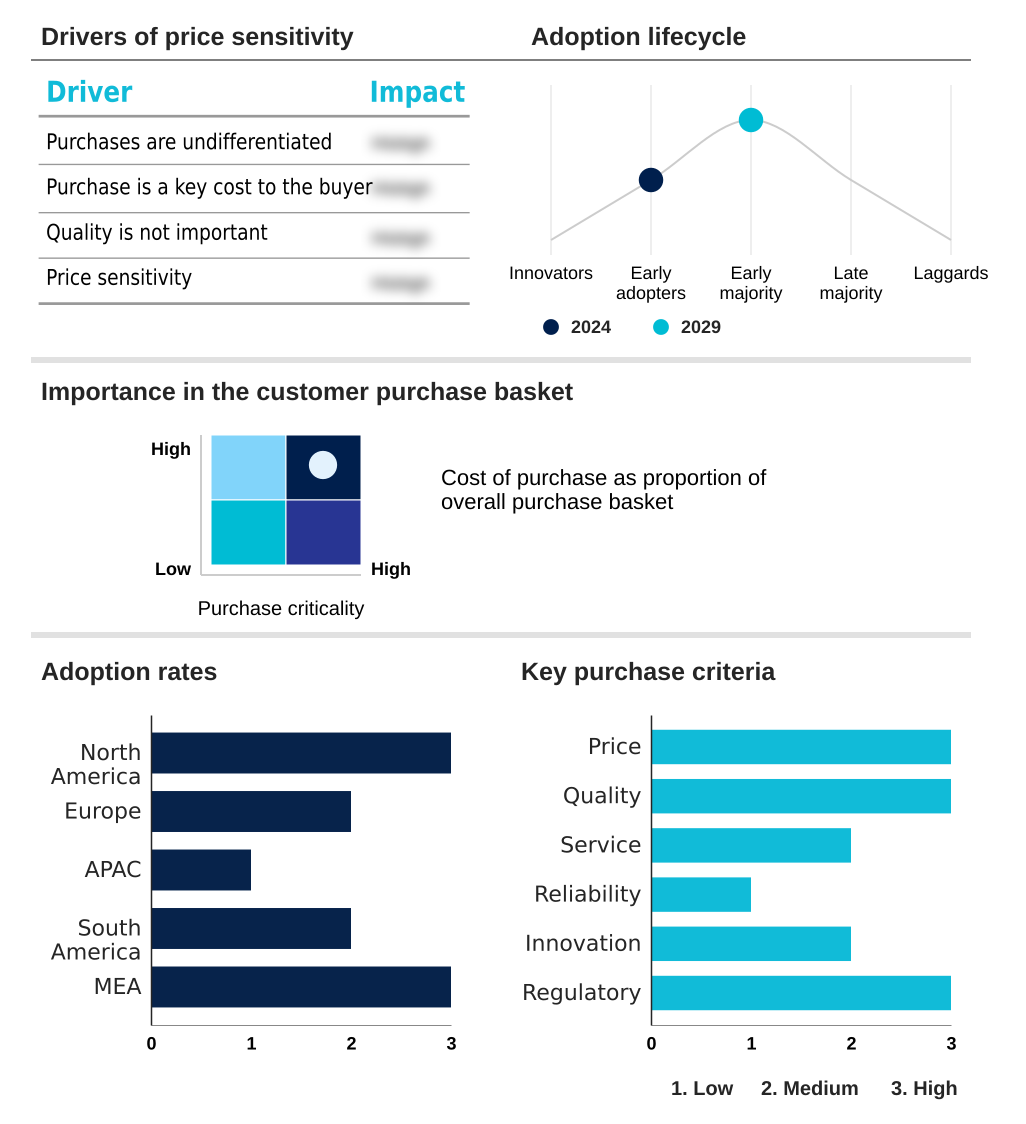
The ai in medical billing market forecasting report includes the adoption lifecycle of the market, covering from the innovator’s stage to the laggard’s stage. It focuses on adoption rates in different regions based on penetration. Furthermore, the ai in medical billing market report also includes key purchase criteria and drivers of price sensitivity to help companies evaluate and develop their market growth analysis strategies.

Customer Landscape of AI In Medical Billing Industry

Competitive Landscape

Companies are implementing various strategies, such as strategic alliances, ai in medical billing market forecast, partnerships, mergers and acquisitions, geographical expansion, and product/service launches, to enhance their presence in the industry.

Access Healthcare - The company provides technology-enabled revenue cycle management, BPO, IT, and finance and accounting services.

The industry research and growth report includes detailed analyses of the competitive landscape of the market and information about key companies, including:

  • Access Healthcare
  • Athenahealth Inc.
  • CareCloud Inc.
  • CodaMetrix
  • eClinicalWorks LLC
  • Ensemble Health Partners
  • Epic Systems Corp.
  • Fathom Health
  • Fujitsu Ltd.
  • GE Healthcare Technologies
  • Hangzhou Weiyi Health Technology Co. Ltd.
  • Infosys Ltd.
  • McKesson Corp.
  • NextGen Healthcare Inc.
  • Nym Health
  • Optum Inc.
  • R1 RCM Inc.
  • SWORD Health Technologies Inc.
  • Waystar Inc.
  • Wipro Ltd.

Qualitative and quantitative analysis of companies has been conducted to help clients understand the wider business environment as well as the strengths and weaknesses of key industry players. Data is qualitatively analyzed to categorize companies as pure play, category-focused, industry-focused, and diversified; it is quantitatively analyzed to categorize companies as dominant, leading, strong, tentative, and weak.

Recent Development and News in Ai in medical billing market

  • In September 2024, Microsoft enhanced its Azure for Healthcare cloud platform with new generative AI capabilities designed to automate clinical documentation and administrative tasks, thereby creating higher quality data for downstream AI medical billing systems.
  • In January 2025, Sutter Health announced an expanded partnership with an AI-powered RCM company to deploy artificial intelligence across its revenue cycle operations, aiming to automate workflows and improve financial outcomes.
  • In March 2025, Navina, an AI platform that structures patient data to assist physicians at the point of care, raised a significant funding round to further develop technology that supports accurate diagnosis capture for risk adjustment coding.
  • In April 2025, Waystar launched an enhanced analytics platform that utilizes predictive AI to provide healthcare organizations with more precise cash flow forecasting and root-cause analysis for payment variances.

Dive into Technavio’s robust research methodology, blending expert interviews, extensive data synthesis, and validated models for unparalleled AI In Medical Billing Market insights. See full methodology.

Market Scope
Page number 312
Base year 2024
Historic period 2019-2023
Forecast period 2025-2029
Growth momentum & CAGR Accelerate at a CAGR of 33.3%
Market growth 2025-2029 USD 10937.9 million
Market structure Fragmented
YoY growth 2024-2025(%) 27.8%
Key countries US, Canada, Mexico, Germany, UK, France, Italy, Spain, The Netherlands, China, Japan, India, South Korea, Australia, Indonesia, Brazil, Argentina, Colombia, Saudi Arabia, UAE, South Africa, Israel and Turkey
Competitive landscape Leading Companies, Market Positioning of Companies, Competitive Strategies, and Industry Risks

Request Free Sample

Research Analyst Overview

  • The AI in medical billing market is undergoing a fundamental transformation driven by the need for greater efficiency and accuracy in healthcare finance. At the core of this shift is the deployment of sophisticated technologies like natural language processing, computer-assisted coding, and robotic process automation to streamline revenue cycle management.
  • Boardroom-level decisions increasingly focus on balancing the high upfront cost of implementing these platforms against their proven ability to deliver substantial ROI through enhanced claim adjudication and predictive denial management. These systems are critical for navigating medical coding complexity and ensuring compliance with ever-changing payer-specific submission rules.
  • Key applications include prior authorization automation and advanced claims data analytics, which work in tandem with electronic health records to improve denial rate reduction. For instance, providers leveraging AI for claim scrubbing and denial root cause analysis have reported a reduction in administrative workload by up to 30%.
  • The evolution toward value-based care models further necessitates tools for precise risk adjustment and hierarchical condition category coding, making AI-driven platforms indispensable for maintaining financial health in a complex reimbursement landscape.

What are the Key Data Covered in this AI In Medical Billing Market Research and Growth Report?

  • What is the expected growth of the AI In Medical Billing Market between 2025 and 2029?

    • USD 10.94 billion, at a CAGR of 33.3%

  • What segmentation does the market report cover?

    • The report is segmented by Deployment (Cloud-based, On-premises), Application (Claims processing and adjudication, Automated coding and documentation, Revenue analytics and forecasting, Fraud detection and risk scoring, Patient payment optimization), End-user (Hospitals and clinics, Healthcare payers, ASCs, Billing outsourcing firms) and Geography (North America, Europe, APAC, South America, Middle East and Africa)

  • Which regions are analyzed in the report?

    • North America, Europe, APAC, South America and Middle East and Africa

  • What are the key growth drivers and market challenges?

    • Escalating complexity of medical coding and regulatory frameworks, Navigating stringent data privacy and security imperatives

  • Who are the major players in the AI In Medical Billing Market?

    • Access Healthcare, Athenahealth Inc., CareCloud Inc., CodaMetrix, eClinicalWorks LLC, Ensemble Health Partners, Epic Systems Corp., Fathom Health, Fujitsu Ltd., GE Healthcare Technologies, Hangzhou Weiyi Health Technology Co. Ltd., Infosys Ltd., McKesson Corp., NextGen Healthcare Inc., Nym Health, Optum Inc., R1 RCM Inc., SWORD Health Technologies Inc., Waystar Inc. and Wipro Ltd.

Market Research Insights

  • The dynamics of the AI in medical billing market are shaped by the need for RCM workflow optimization to counteract immense financial pressures. Healthcare providers are leveraging cloud-based SaaS platforms that offer automated eligibility verification and proactive claim correction, with some achieving a 25% reduction in denial rates.
  • These systems facilitate real-time compliance updates to navigate complex telehealth billing rules and out-of-network billing regulations. The adoption of AI for administrative burden reduction is critical, as it allows staff to shift focus from manual data entry to strategic denial management automation. Advanced platforms provide predictive financial insights, with implementations showing a 15% improvement in cash flow forecasting accuracy.
  • By utilizing patient propensity-to-pay models, providers can also optimize collection strategies, improving patient satisfaction scores while securing revenue.

We can help! Our analysts can customize this ai in medical billing market research report to meet your requirements.

Get in touch

1. Executive Summary

1.1 Market overview

Executive Summary - Chart on Market Overview
Executive Summary - Data Table on Market Overview
Executive Summary - Chart on Global Market Characteristics
Executive Summary - Chart on Market by Geography
Executive Summary - Chart on Market Segmentation by Deployment
Executive Summary - Chart on Market Segmentation by Application
Executive Summary - Chart on Market Segmentation by End-user
Executive Summary - Chart on Incremental Growth
Executive Summary - Data Table on Incremental Growth
Executive Summary - Chart on Company Market Positioning

2. Technavio Analysis

2.1 Analysis of price sensitivity, lifecycle, customer purchase basket, adoption rates, and purchase criteria

2.2 Criticality of inputs and Factors of differentiation

Chart on Overview on criticality of inputs and factors of differentiation

2.3 Factors of disruption

Chart on Overview on factors of disruption

2.4 Impact of drivers and challenges

Chart on Impact of drivers and challenges in 2024 and 2029

3. Market Landscape

3.1 Market ecosystem

Chart on Parent Market
Data Table on - Parent Market

3.2 Market characteristics

Chart on Market characteristics analysis

3.3 Value chain analysis

Chart on Value chain analysis

4. Market Sizing

4.1 Market definition

Data Table on Offerings of companies included in the market definition

4.2 Market segment analysis

Market segments

4.3 Market size 2024

4.4 Market outlook: Forecast for 2024-2029

Chart on Global - Market size and forecast 2024-2029 ($ million)
Data Table on Global - Market size and forecast 2024-2029 ($ million)
Chart on Global Market: Year-over-year growth 2024-2029 (%)
Data Table on Global Market: Year-over-year growth 2024-2029 (%)

5. Historic Market Size

5.1 Global AI In Medical Billing Market 2019 - 2023

Historic Market Size - Data Table on Global AI In Medical Billing Market 2019 - 2023 ($ million)

5.2 Deployment segment analysis 2019 - 2023

Historic Market Size - Deployment Segment 2019 - 2023 ($ million)

5.3 Application segment analysis 2019 - 2023

Historic Market Size - Application Segment 2019 - 2023 ($ million)

5.4 End-user segment analysis 2019 - 2023

Historic Market Size - End-user Segment 2019 - 2023 ($ million)

5.5 Geography segment analysis 2019 - 2023

Historic Market Size - Geography Segment 2019 - 2023 ($ million)

5.6 Country segment analysis 2019 - 2023

Historic Market Size - Country Segment 2019 - 2023 ($ million)

6. Five Forces Analysis

6.1 Five forces summary

Five forces analysis - Comparison between 2024 and 2029

6.2 Bargaining power of buyers

Bargaining power of buyers - Impact of key factors 2024 and 2029

6.3 Bargaining power of suppliers

Bargaining power of suppliers - Impact of key factors in 2024 and 2029

6.4 Threat of new entrants

Threat of new entrants - Impact of key factors in 2024 and 2029

6.5 Threat of substitutes

Threat of substitutes - Impact of key factors in 2024 and 2029

6.6 Threat of rivalry

Threat of rivalry - Impact of key factors in 2024 and 2029

6.7 Market condition

Chart on Market condition - Five forces 2024 and 2029

7. Market Segmentation by Deployment

7.1 Market segments

Chart on Deployment - Market share 2024-2029 (%)
Data Table on Deployment - Market share 2024-2029 (%)

7.2 Comparison by Deployment

Chart on Comparison by Deployment
Data Table on Comparison by Deployment

7.3 Cloud-based - Market size and forecast 2024-2029

Chart on Cloud-based - Market size and forecast 2024-2029 ($ million)
Data Table on Cloud-based - Market size and forecast 2024-2029 ($ million)
Chart on Cloud-based - Year-over-year growth 2024-2029 (%)
Data Table on Cloud-based - Year-over-year growth 2024-2029 (%)

7.4 On-premises - Market size and forecast 2024-2029

Chart on On-premises - Market size and forecast 2024-2029 ($ million)
Data Table on On-premises - Market size and forecast 2024-2029 ($ million)
Chart on On-premises - Year-over-year growth 2024-2029 (%)
Data Table on On-premises - Year-over-year growth 2024-2029 (%)

7.5 Market opportunity by Deployment

Market opportunity by Deployment ($ million)
Data Table on Market opportunity by Deployment ($ million)

8. Market Segmentation by Application

8.1 Market segments

Chart on Application - Market share 2024-2029 (%)
Data Table on Application - Market share 2024-2029 (%)

8.2 Comparison by Application

Chart on Comparison by Application
Data Table on Comparison by Application

8.3 Claims processing and adjudication - Market size and forecast 2024-2029

Chart on Claims processing and adjudication - Market size and forecast 2024-2029 ($ million)
Data Table on Claims processing and adjudication - Market size and forecast 2024-2029 ($ million)
Chart on Claims processing and adjudication - Year-over-year growth 2024-2029 (%)
Data Table on Claims processing and adjudication - Year-over-year growth 2024-2029 (%)

8.4 Automated coding and documentation - Market size and forecast 2024-2029

Chart on Automated coding and documentation - Market size and forecast 2024-2029 ($ million)
Data Table on Automated coding and documentation - Market size and forecast 2024-2029 ($ million)
Chart on Automated coding and documentation - Year-over-year growth 2024-2029 (%)
Data Table on Automated coding and documentation - Year-over-year growth 2024-2029 (%)

8.5 Revenue analytics and forecasting - Market size and forecast 2024-2029

Chart on Revenue analytics and forecasting - Market size and forecast 2024-2029 ($ million)
Data Table on Revenue analytics and forecasting - Market size and forecast 2024-2029 ($ million)
Chart on Revenue analytics and forecasting - Year-over-year growth 2024-2029 (%)
Data Table on Revenue analytics and forecasting - Year-over-year growth 2024-2029 (%)

8.6 Fraud detection and risk scoring - Market size and forecast 2024-2029

Chart on Fraud detection and risk scoring - Market size and forecast 2024-2029 ($ million)
Data Table on Fraud detection and risk scoring - Market size and forecast 2024-2029 ($ million)
Chart on Fraud detection and risk scoring - Year-over-year growth 2024-2029 (%)
Data Table on Fraud detection and risk scoring - Year-over-year growth 2024-2029 (%)

8.7 Patient payment optimization - Market size and forecast 2024-2029

Chart on Patient payment optimization - Market size and forecast 2024-2029 ($ million)
Data Table on Patient payment optimization - Market size and forecast 2024-2029 ($ million)
Chart on Patient payment optimization - Year-over-year growth 2024-2029 (%)
Data Table on Patient payment optimization - Year-over-year growth 2024-2029 (%)

8.8 Market opportunity by Application

Market opportunity by Application ($ million)
Data Table on Market opportunity by Application ($ million)

9. Market Segmentation by End-user

9.1 Market segments

Chart on End-user - Market share 2024-2029 (%)
Data Table on End-user - Market share 2024-2029 (%)

9.2 Comparison by End-user

Chart on Comparison by End-user
Data Table on Comparison by End-user

9.3 Hospitals and clinics - Market size and forecast 2024-2029

Chart on Hospitals and clinics - Market size and forecast 2024-2029 ($ million)
Data Table on Hospitals and clinics - Market size and forecast 2024-2029 ($ million)
Chart on Hospitals and clinics - Year-over-year growth 2024-2029 (%)
Data Table on Hospitals and clinics - Year-over-year growth 2024-2029 (%)

9.4 Healthcare payers - Market size and forecast 2024-2029

Chart on Healthcare payers - Market size and forecast 2024-2029 ($ million)
Data Table on Healthcare payers - Market size and forecast 2024-2029 ($ million)
Chart on Healthcare payers - Year-over-year growth 2024-2029 (%)
Data Table on Healthcare payers - Year-over-year growth 2024-2029 (%)

9.5 ASCs - Market size and forecast 2024-2029

Chart on ASCs - Market size and forecast 2024-2029 ($ million)
Data Table on ASCs - Market size and forecast 2024-2029 ($ million)
Chart on ASCs - Year-over-year growth 2024-2029 (%)
Data Table on ASCs - Year-over-year growth 2024-2029 (%)

9.6 Billing outsourcing firms - Market size and forecast 2024-2029

Chart on Billing outsourcing firms - Market size and forecast 2024-2029 ($ million)
Data Table on Billing outsourcing firms - Market size and forecast 2024-2029 ($ million)
Chart on Billing outsourcing firms - Year-over-year growth 2024-2029 (%)
Data Table on Billing outsourcing firms - Year-over-year growth 2024-2029 (%)

9.7 Market opportunity by End-user

Market opportunity by End-user ($ million)
Data Table on Market opportunity by End-user ($ million)

10. Customer Landscape

10.1 Customer landscape overview

Analysis of price sensitivity, lifecycle, customer purchase basket, adoption rates, and purchase criteria

11. Geographic Landscape

11.1 Geographic segmentation

Chart on Market share by geography 2024-2029 (%)
Data Table on Market share by geography 2024-2029 (%)

11.2 Geographic comparison

Chart on Geographic comparison
Data Table on Geographic comparison

11.3 North America - Market size and forecast 2024-2029

Chart on North America - Market size and forecast 2024-2029 ($ million)
Data Table on North America - Market size and forecast 2024-2029 ($ million)
Chart on North America - Year-over-year growth 2024-2029 (%)
Data Table on North America - Year-over-year growth 2024-2029 (%)
Chart on Regional Comparison - North America
Data Table on Regional Comparison - North America

11.3.1 US - Market size and forecast 2024-2029

Chart on US - Market size and forecast 2024-2029 ($ million)
Data Table on US - Market size and forecast 2024-2029 ($ million)
Chart on US - Year-over-year growth 2024-2029 (%)
Data Table on US - Year-over-year growth 2024-2029 (%)

11.3.2 Canada - Market size and forecast 2024-2029

Chart on Canada - Market size and forecast 2024-2029 ($ million)
Data Table on Canada - Market size and forecast 2024-2029 ($ million)
Chart on Canada - Year-over-year growth 2024-2029 (%)
Data Table on Canada - Year-over-year growth 2024-2029 (%)

11.3.3 Mexico - Market size and forecast 2024-2029

Chart on Mexico - Market size and forecast 2024-2029 ($ million)
Data Table on Mexico - Market size and forecast 2024-2029 ($ million)
Chart on Mexico - Year-over-year growth 2024-2029 (%)
Data Table on Mexico - Year-over-year growth 2024-2029 (%)

11.4 Europe - Market size and forecast 2024-2029

Chart on Europe - Market size and forecast 2024-2029 ($ million)
Data Table on Europe - Market size and forecast 2024-2029 ($ million)
Chart on Europe - Year-over-year growth 2024-2029 (%)
Data Table on Europe - Year-over-year growth 2024-2029 (%)
Chart on Regional Comparison - Europe
Data Table on Regional Comparison - Europe

11.4.1 Germany - Market size and forecast 2024-2029

Chart on Germany - Market size and forecast 2024-2029 ($ million)
Data Table on Germany - Market size and forecast 2024-2029 ($ million)
Chart on Germany - Year-over-year growth 2024-2029 (%)
Data Table on Germany - Year-over-year growth 2024-2029 (%)

11.4.2 UK - Market size and forecast 2024-2029

Chart on UK - Market size and forecast 2024-2029 ($ million)
Data Table on UK - Market size and forecast 2024-2029 ($ million)
Chart on UK - Year-over-year growth 2024-2029 (%)
Data Table on UK - Year-over-year growth 2024-2029 (%)

11.4.3 France - Market size and forecast 2024-2029

Chart on France - Market size and forecast 2024-2029 ($ million)
Data Table on France - Market size and forecast 2024-2029 ($ million)
Chart on France - Year-over-year growth 2024-2029 (%)
Data Table on France - Year-over-year growth 2024-2029 (%)

11.4.4 Italy - Market size and forecast 2024-2029

Chart on Italy - Market size and forecast 2024-2029 ($ million)
Data Table on Italy - Market size and forecast 2024-2029 ($ million)
Chart on Italy - Year-over-year growth 2024-2029 (%)
Data Table on Italy - Year-over-year growth 2024-2029 (%)

11.4.5 Spain - Market size and forecast 2024-2029

Chart on Spain - Market size and forecast 2024-2029 ($ million)
Data Table on Spain - Market size and forecast 2024-2029 ($ million)
Chart on Spain - Year-over-year growth 2024-2029 (%)
Data Table on Spain - Year-over-year growth 2024-2029 (%)

11.4.6 The Netherlands - Market size and forecast 2024-2029

Chart on The Netherlands - Market size and forecast 2024-2029 ($ million)
Data Table on The Netherlands - Market size and forecast 2024-2029 ($ million)
Chart on The Netherlands - Year-over-year growth 2024-2029 (%)
Data Table on The Netherlands - Year-over-year growth 2024-2029 (%)

11.5 APAC - Market size and forecast 2024-2029

Chart on APAC - Market size and forecast 2024-2029 ($ million)
Data Table on APAC - Market size and forecast 2024-2029 ($ million)
Chart on APAC - Year-over-year growth 2024-2029 (%)
Data Table on APAC - Year-over-year growth 2024-2029 (%)
Chart on Regional Comparison - APAC
Data Table on Regional Comparison - APAC

11.5.1 China - Market size and forecast 2024-2029

Chart on China - Market size and forecast 2024-2029 ($ million)
Data Table on China - Market size and forecast 2024-2029 ($ million)
Chart on China - Year-over-year growth 2024-2029 (%)
Data Table on China - Year-over-year growth 2024-2029 (%)

11.5.2 Japan - Market size and forecast 2024-2029

Chart on Japan - Market size and forecast 2024-2029 ($ million)
Data Table on Japan - Market size and forecast 2024-2029 ($ million)
Chart on Japan - Year-over-year growth 2024-2029 (%)
Data Table on Japan - Year-over-year growth 2024-2029 (%)

11.5.3 India - Market size and forecast 2024-2029

Chart on India - Market size and forecast 2024-2029 ($ million)
Data Table on India - Market size and forecast 2024-2029 ($ million)
Chart on India - Year-over-year growth 2024-2029 (%)
Data Table on India - Year-over-year growth 2024-2029 (%)

11.5.4 South Korea - Market size and forecast 2024-2029

Chart on South Korea - Market size and forecast 2024-2029 ($ million)
Data Table on South Korea - Market size and forecast 2024-2029 ($ million)
Chart on South Korea - Year-over-year growth 2024-2029 (%)
Data Table on South Korea - Year-over-year growth 2024-2029 (%)

11.5.5 Australia - Market size and forecast 2024-2029

Chart on Australia - Market size and forecast 2024-2029 ($ million)
Data Table on Australia - Market size and forecast 2024-2029 ($ million)
Chart on Australia - Year-over-year growth 2024-2029 (%)
Data Table on Australia - Year-over-year growth 2024-2029 (%)

11.5.6 Indonesia - Market size and forecast 2024-2029

Chart on Indonesia - Market size and forecast 2024-2029 ($ million)
Data Table on Indonesia - Market size and forecast 2024-2029 ($ million)
Chart on Indonesia - Year-over-year growth 2024-2029 (%)
Data Table on Indonesia - Year-over-year growth 2024-2029 (%)

11.6 South America - Market size and forecast 2024-2029

Chart on South America - Market size and forecast 2024-2029 ($ million)
Data Table on South America - Market size and forecast 2024-2029 ($ million)
Chart on South America - Year-over-year growth 2024-2029 (%)
Data Table on South America - Year-over-year growth 2024-2029 (%)
Chart on Regional Comparison - South America
Data Table on Regional Comparison - South America

11.6.1 Brazil - Market size and forecast 2024-2029

Chart on Brazil - Market size and forecast 2024-2029 ($ million)
Data Table on Brazil - Market size and forecast 2024-2029 ($ million)
Chart on Brazil - Year-over-year growth 2024-2029 (%)
Data Table on Brazil - Year-over-year growth 2024-2029 (%)

11.6.2 Argentina - Market size and forecast 2024-2029

Chart on Argentina - Market size and forecast 2024-2029 ($ million)
Data Table on Argentina - Market size and forecast 2024-2029 ($ million)
Chart on Argentina - Year-over-year growth 2024-2029 (%)
Data Table on Argentina - Year-over-year growth 2024-2029 (%)

11.6.3 Colombia - Market size and forecast 2024-2029

Chart on Colombia - Market size and forecast 2024-2029 ($ million)
Data Table on Colombia - Market size and forecast 2024-2029 ($ million)
Chart on Colombia - Year-over-year growth 2024-2029 (%)
Data Table on Colombia - Year-over-year growth 2024-2029 (%)

11.7 Middle East and Africa - Market size and forecast 2024-2029

Chart on Middle East and Africa - Market size and forecast 2024-2029 ($ million)
Data Table on Middle East and Africa - Market size and forecast 2024-2029 ($ million)
Chart on Middle East and Africa - Year-over-year growth 2024-2029 (%)
Data Table on Middle East and Africa - Year-over-year growth 2024-2029 (%)
Chart on Regional Comparison - Middle East and Africa
Data Table on Regional Comparison - Middle East and Africa

11.7.1 Saudi Arabia - Market size and forecast 2024-2029

Chart on Saudi Arabia - Market size and forecast 2024-2029 ($ million)
Data Table on Saudi Arabia - Market size and forecast 2024-2029 ($ million)
Chart on Saudi Arabia - Year-over-year growth 2024-2029 (%)
Data Table on Saudi Arabia - Year-over-year growth 2024-2029 (%)

11.7.2 UAE - Market size and forecast 2024-2029

Chart on UAE - Market size and forecast 2024-2029 ($ million)
Data Table on UAE - Market size and forecast 2024-2029 ($ million)
Chart on UAE - Year-over-year growth 2024-2029 (%)
Data Table on UAE - Year-over-year growth 2024-2029 (%)

11.7.3 South Africa - Market size and forecast 2024-2029

Chart on South Africa - Market size and forecast 2024-2029 ($ million)
Data Table on South Africa - Market size and forecast 2024-2029 ($ million)
Chart on South Africa - Year-over-year growth 2024-2029 (%)
Data Table on South Africa - Year-over-year growth 2024-2029 (%)

11.7.4 Israel - Market size and forecast 2024-2029

Chart on Israel - Market size and forecast 2024-2029 ($ million)
Data Table on Israel - Market size and forecast 2024-2029 ($ million)
Chart on Israel - Year-over-year growth 2024-2029 (%)
Data Table on Israel - Year-over-year growth 2024-2029 (%)

11.7.5 Turkey - Market size and forecast 2024-2029

Chart on Turkey - Market size and forecast 2024-2029 ($ million)
Data Table on Turkey - Market size and forecast 2024-2029 ($ million)
Chart on Turkey - Year-over-year growth 2024-2029 (%)
Data Table on Turkey - Year-over-year growth 2024-2029 (%)

11.8 Market opportunity by geography

Market opportunity by geography ($ million)
Data Tables on Market opportunity by geography ($ million)

12. Drivers, Challenges, and Opportunity

12.1 Market drivers

Escalating complexity of medical coding and regulatory frameworks
Economic pressures mandating operational efficiency and enhanced revenue cycle management
Synergistic advancement in AI technologies and proliferation of healthcare data

12.2 Market challenges

Navigating stringent data privacy and security imperatives
Overcoming prohibitive implementation costs and complex systems integration
Addressing evolving regulatory scrutiny and absence of standardized AI frameworks

12.3 Impact of drivers and challenges

Impact of drivers and challenges in 2024 and 2029

12.4 Market opportunities

Critical imperative for operational efficiency amid escalating administrative costs
Navigating increasing complexity of medical coding and regulatory compliance
Transformative impact of generative AI and LLM

13. Competitive Landscape

13.1 Overview

13.2

Overview on criticality of inputs and factors of differentiation

13.3 Landscape disruption

Overview on factors of disruption

13.4 Industry risks

Impact of key risks on business

14. Competitive Analysis

14.1 Companies profiled

Companies covered

14.2 Company ranking index

14.3 Market positioning of companies

Matrix on companies position and classification

14.4 Access Healthcare

Access Healthcare - Overview
Access Healthcare - Product / Service
Access Healthcare - Key offerings
SWOT

14.5 Athenahealth Inc.

Athenahealth Inc. - Overview
Athenahealth Inc. - Product / Service
Athenahealth Inc. - Key offerings
SWOT

14.6 CareCloud Inc.

CareCloud Inc. - Overview
CareCloud Inc. - Business segments
CareCloud Inc. - Key news
CareCloud Inc. - Key offerings
CareCloud Inc. - Segment focus
SWOT

14.7 CodaMetrix

CodaMetrix - Overview
CodaMetrix - Product / Service
CodaMetrix - Key offerings
SWOT

14.8 Ensemble Health Partners

Ensemble Health Partners - Overview
Ensemble Health Partners - Product / Service
Ensemble Health Partners - Key offerings
SWOT

14.9 Epic Systems Corp.

Epic Systems Corp. - Overview
Epic Systems Corp. - Product / Service
Epic Systems Corp. - Key offerings
SWOT

14.10 Fathom Health

Fathom Health - Overview
Fathom Health - Product / Service
Fathom Health - Key offerings
SWOT

14.11 GE Healthcare Technologies

GE Healthcare Technologies - Overview
GE Healthcare Technologies - Business segments
GE Healthcare Technologies - Key news
GE Healthcare Technologies - Key offerings
GE Healthcare Technologies - Segment focus
SWOT

14.12 Hangzhou Weiyi Health Technology Co. Ltd.

Hangzhou Weiyi Health Technology Co. Ltd. - Overview
Hangzhou Weiyi Health Technology Co. Ltd. - Product / Service
Hangzhou Weiyi Health Technology Co. Ltd. - Key offerings
SWOT

14.13 Infosys Ltd.

Infosys Ltd. - Overview
Infosys Ltd. - Business segments
Infosys Ltd. - Key news
Infosys Ltd. - Key offerings
Infosys Ltd. - Segment focus
SWOT

14.14 NextGen Healthcare Inc.

NextGen Healthcare Inc. - Overview
NextGen Healthcare Inc. - Product / Service
NextGen Healthcare Inc. - Key news
NextGen Healthcare Inc. - Key offerings
SWOT

14.15 Nym Health

Nym Health - Overview
Nym Health - Product / Service
Nym Health - Key offerings
SWOT

14.16 Optum Inc.

Optum Inc. - Overview
Optum Inc. - Product / Service
Optum Inc. - Key offerings
SWOT

14.17 R1 RCM Inc.

R1 RCM Inc. - Overview
R1 RCM Inc. - Product / Service
R1 RCM Inc. - Key offerings
SWOT

14.18 Waystar Inc.

Waystar Inc. - Overview
Waystar Inc. - Product / Service
Waystar Inc. - Key offerings
SWOT

15. Appendix

15.1 Scope of the report

Market definition
Objectives
Notes and caveats

15.2 Inclusions and exclusions checklist

Inclusions checklist
Exclusions checklist

15.3 Currency conversion rates for US$

15.4 Research methodology

15.5 Data procurement

Information sources

15.6 Data validation

15.7 Validation techniques employed for market sizing

15.8 Data synthesis

15.9 360 degree market analysis

15.10 List of abbreviations

Research Methodology

Technavio presents a detailed picture of the market by way of study, synthesis, and summation of data from multiple sources. The analysts have presented the various facets of the market with a particular focus on identifying the key industry influencers. The data thus presented is comprehensive, reliable, and the result of extensive research, both primary and secondary.

INFORMATION SOURCES

Primary sources

  • Manufacturers and suppliers
  • Channel partners
  • Industry experts
  • Strategic decision makers

Secondary sources

  • Industry journals and periodicals
  • Government data
  • Financial reports of key industry players
  • Historical data
  • Press releases

DATA ANALYSIS

Data Synthesis

  • Collation of data
  • Estimation of key figures
  • Analysis of derived insights

Data Validation

  • Triangulation with data models
  • Reference against proprietary databases
  • Corroboration with industry experts

REPORT WRITING

Qualitative

  • Market drivers
  • Market challenges
  • Market trends
  • Five forces analysis

Quantitative

  • Market size and forecast
  • Market segmentation
  • Geographical insights
  • Competitive landscape

Interested in this report?

Get your sample now to see our research methodology and insights!

Download Now

Frequently Asked Questions

AI In Medical Billing market growth will increase by USD 10937.9 million during 2025-2029.

The AI In Medical Billing market is expected to grow at a CAGR of 33.3% during 2025-2029.

AI In Medical Billing market is segmented by Deployment (Cloud-based, On-premises) Application (Claims processing and adjudication, Automated coding and documentation, Revenue analytics and forecasting, Fraud detection and risk scoring, Patient payment optimization) End-user (Hospitals and clinics, Healthcare payers, ASCs, Billing outsourcing firms)

Access Healthcare, Athenahealth Inc., CareCloud Inc., CodaMetrix, eClinicalWorks LLC, Ensemble Health Partners, Epic Systems Corp., Fathom Health, Fujitsu Ltd., GE Healthcare Technologies, Hangzhou Weiyi Health Technology Co. Ltd., Infosys Ltd., McKesson Corp., NextGen Healthcare Inc., Nym Health, Optum Inc., R1 RCM Inc., SWORD Health Technologies Inc., Waystar Inc., Wipro Ltd. are a few of the key vendors in the AI In Medical Billing market.

North America will register the highest growth rate of 36.6% among the other regions. Therefore, the AI In Medical Billing market in North America is expected to garner significant business opportunities for the vendors during the forecast period.

US, Canada, Mexico, Germany, UK, France, Italy, Spain, The Netherlands, China, Japan, India, South Korea, Australia, Indonesia, Brazil, Argentina, Colombia, Saudi Arabia, UAE, South Africa, Israel, Turkey

  • Escalating complexity of medical coding and regulatory frameworks is the driving factor this market.

The AI In Medical Billing market vendors should focus on grabbing business opportunities from the Deployment segment as it accounted for the largest market share in the base year.