AI Kitchen Market Analysis, Size, and Forecast 2025-2029: North America (US, Canada, and Mexico), Europe (Germany, UK, and Italy), APAC (China, South Korea, and Japan), South America (Brazil, Argentina, and Colombia), Middle East and Africa (South Africa, UAE, and Israel), and Rest of World (ROW)

AI Kitchen Market Analysis, Size, and Forecast 2025-2029:
North America (US, Canada, and Mexico), Europe (Germany, UK, and Italy), APAC (China, South Korea, and Japan), South America (Brazil, Argentina, and Colombia), Middle East and Africa (South Africa, UAE, and Israel), and Rest of World (ROW)

Published: Dec 2025 299 Pages SKU: IRTNTR81017

Market Overview at a Glance

$48.35 B
Market Opportunity
21.7%
CAGR 2024 - 2029
34%
North America Growth
$9.87 B
Refrigerator segment 2023

AI Kitchen Market Size 2025-2029

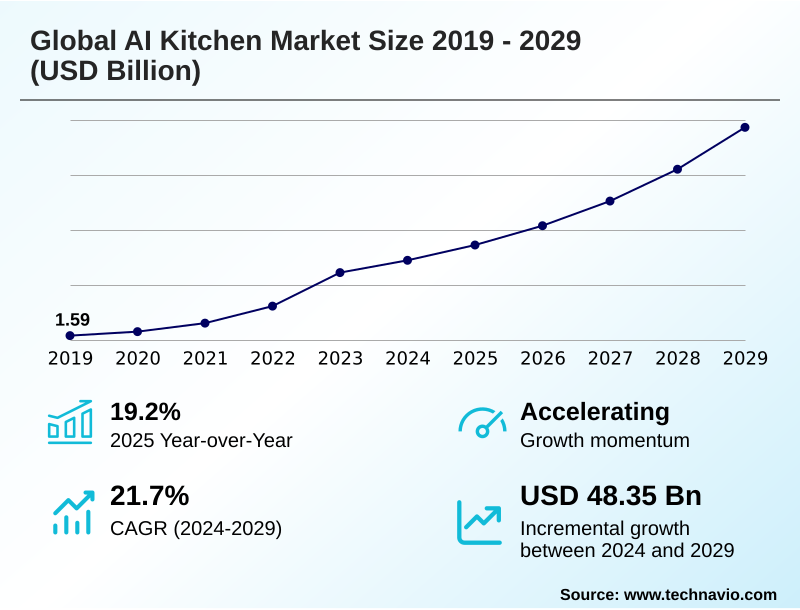
The ai kitchen market size is valued to increase by USD 48.35 billion, at a CAGR of 21.7% from 2024 to 2029. Increasing consumer demand for convenience and automation will drive the ai kitchen market.

Major Market Trends & Insights

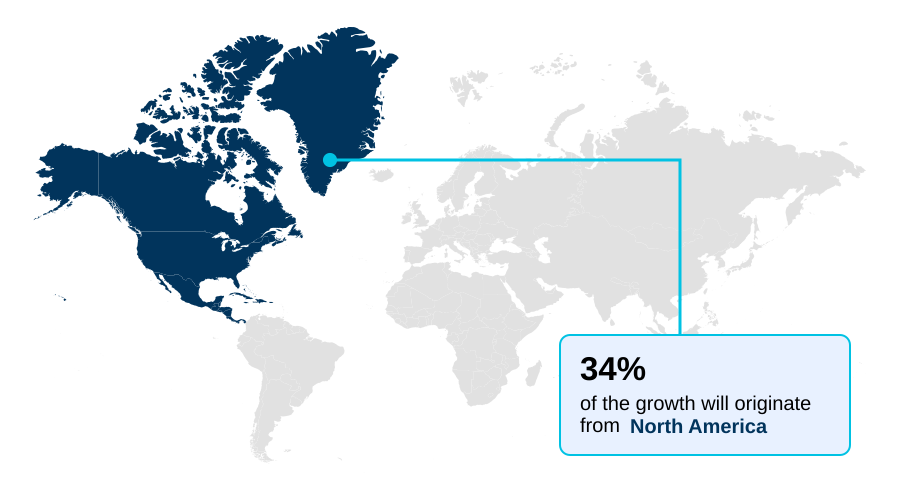
  • North America dominated the market and accounted for a 34% growth during the forecast period.
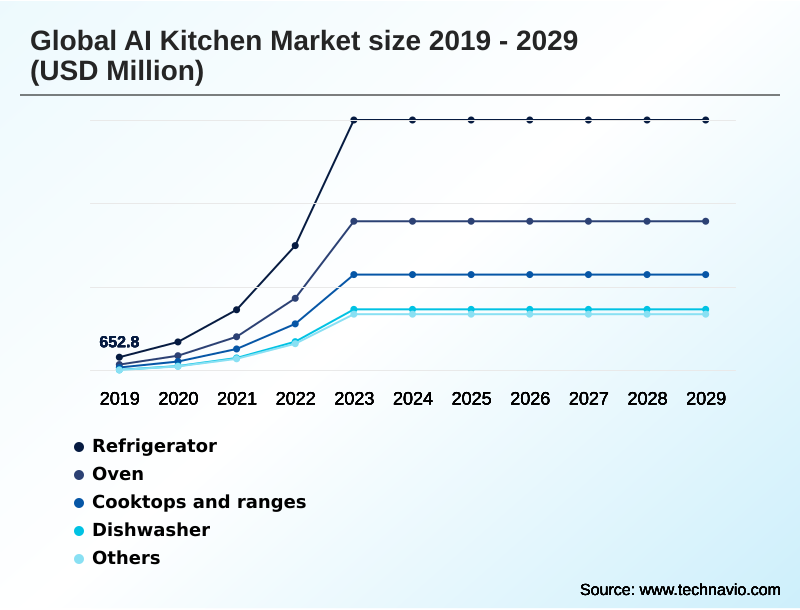
  • By Product Type - Refrigerator segment was valued at USD 9.87 billion in 2023
  • By Application - Residential segment accounted for the largest market revenue share in 2023

Market Size & Forecast

  • Market Opportunities: USD 75.74 billion
  • Market Future Opportunities: USD 48.35 billion
  • CAGR from 2024 to 2029 : 21.7%

Market Summary

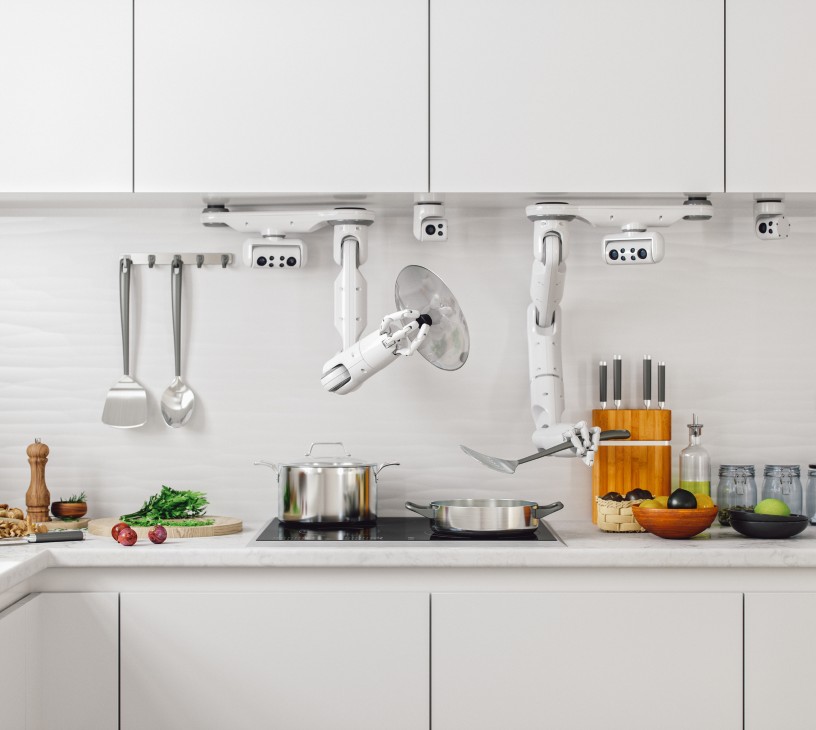
  • The AI kitchen market is redefining culinary spaces by transforming them from areas of manual labor into highly efficient, automated environments. This shift is propelled by the integration of technologies like natural language processing and smart sensor technology, which enable a new class of appliances to offer proactive assistance and hyper-personalization.
  • For instance, commercial kitchens are leveraging AI for intelligent inventory tracking and automated cooking cycles, which not only ensures meal consistency but also drives significant food waste reduction. This data-driven food management leads to better resource consumption optimization.
  • However, the path to mass adoption involves addressing the high initial cost of robotic cooking systems and ensuring seamless smart appliance interoperability between different brands. The evolution toward a cohesive smart home ecosystem, where the kitchen acts as a central hub, depends on robust IoT connectivity protocols and intuitive conversational interfaces that simplify the user experience.
  • The ultimate goal is a kitchen that provides personalized nutritional guidance and predictive maintenance alerts, making daily routines more convenient.

What will be the Size of the AI Kitchen Market during the forecast period?

Get Key Insights on Market Forecast (PDF) Request Free Sample

How is the AI Kitchen Market Segmented?

The ai kitchen industry research report provides comprehensive data (region-wise segment analysis), with forecasts and estimates in "USD million" for the period 2025-2029, as well as historical data from 2019-2023 for the following segments.

  • Product type
    • Refrigerator
    • Oven
    • Cooktops and ranges
    • Dishwasher
    • Others
  • Application
    • Residential
    • Commercial
  • Distribution channel
    • Specialty stores
    • Online channels
    • Hypermarkets and supermarkets
  • Geography
    • North America
      • US
      • Canada
      • Mexico
    • Europe
      • Germany
      • UK
      • Italy
    • APAC
      • China
      • South Korea
      • Japan
    • South America
      • Brazil
      • Argentina
      • Colombia
    • Middle East and Africa
      • South Africa
      • UAE
      • Israel
    • Rest of World (ROW)

By Product Type Insights

The refrigerator segment is estimated to witness significant growth during the forecast period.

The refrigerator segment is evolving into an intelligent food management hub, central to the AI kitchen. This transformation leverages computer vision cameras and advanced machine learning algorithms for intelligent inventory tracking and AI-enhanced food preservation.

Key functions include data-driven food management and automated grocery list creation, which are pivotal for food waste reduction. Systems offering a personalized cooking experience and connected oven recipe suggestions are becoming standard.

This adaptive user preference learning, which can identify over 33 different food items with 95% accuracy, optimizes resource consumption and enhances AI-guided culinary techniques.

The integration within a broader smart home ecosystem is critical, enabling proactive assistance and seamless communication through established IoT connectivity protocols and advanced AI kitchen appliance integration for a cohesive user experience.

Request Free Sample

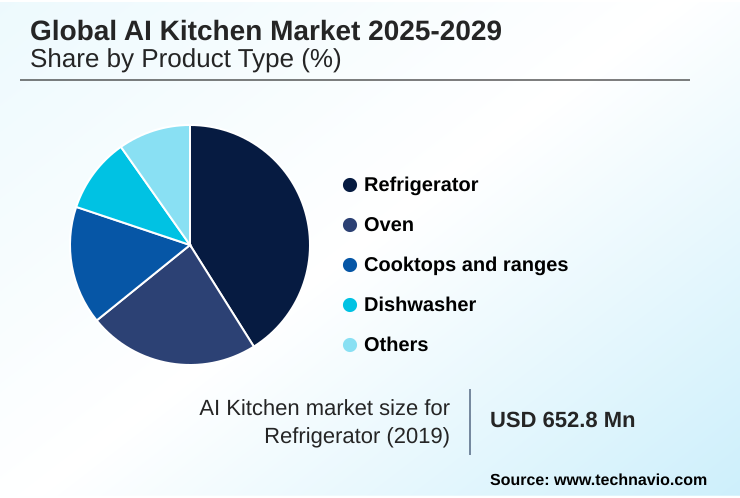
The Refrigerator segment was valued at USD 9.87 billion in 2023 and showed a gradual increase during the forecast period.

Request Free Sample

Regional Analysis

North America is estimated to contribute 34% to the growth of the global market during the forecast period.Technavio’s analysts have elaborately explained the regional trends and drivers that shape the market during the forecast period.

See How AI Kitchen Market Demand is Rising in North America Request Free Sample

The geographic landscape of the market is diverse, with regional priorities shaping technology adoption.

In North America, which accounts for nearly 34% of the incremental growth, demand is driven by convenience, leading to a focus on seamless grocery ordering and smart home automation kitchen features.

Europe prioritizes sustainability and kitchen energy optimization AI, with regulations compelling efficiency gains; certain AI-driven appliances have achieved a 15% reduction in energy use.

The APAC region, led by innovation hubs in South Korea and China, is a nexus for advanced development in AI-powered food pairing and sophisticated smart kitchen user interface design.

This region pioneers concepts like the smart home AI agent, setting global benchmarks for what is technologically feasible in the market.

Market Dynamics

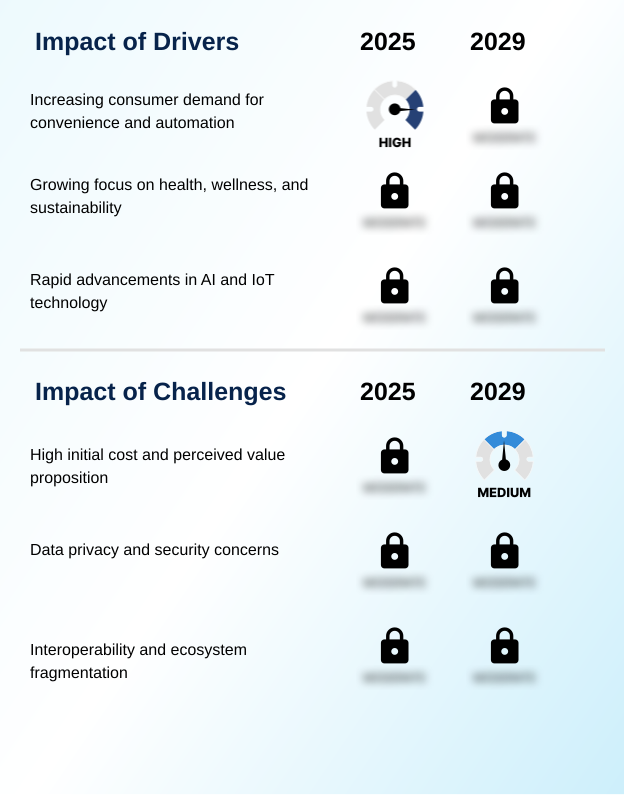
Our researchers analyzed the data with 2024 as the base year, along with the key drivers, trends, and challenges. A holistic analysis of drivers will help companies refine their marketing strategies to gain a competitive advantage.

  • The AI kitchen market presents a multifaceted value proposition, with the benefits of AI in commercial kitchens being particularly compelling. Commercial kitchen automation using AI robotics is already improving efficiency and consistency, with AI-driven cooking for consistent results leading to operational gains of over 15% compared to manual methods.
  • In the residential sector, a key driver is how AI reduces household food waste through intelligent tracking and alerts. As consumers evaluate options, comparing AI kitchen platform ecosystems becomes critical, as does understanding the user data security in connected kitchen appliances. The future of generative AI in cooking promises creative recipe modification and more natural interactions.
  • However, this raises privacy concerns with AI kitchen cameras, which must be addressed to build trust. Furthermore, AI-powered nutritional tracking in smart kitchens, especially when integrating health trackers with AI kitchens, offers significant wellness benefits. Interoperability challenges in smart kitchens remain a hurdle, but the role of IoT in AI kitchen development is key to creating unified experiences.
  • For an aging population, AI kitchen technology for elderly assistance is an important emerging application. Innovations like the smart oven with food recognition technology, smart refrigerator automated food ordering, and AI-based predictive maintenance for appliances are making kitchens more autonomous.
  • The technology enables AI for personalized dietary plan generation, moving beyond simple AI kitchen voice assistant query examples to create truly helpful systems.

What are the key market drivers leading to the rise in the adoption of AI Kitchen Industry?

  • The primary driver for market expansion is the escalating consumer demand for convenience and automated solutions that streamline household management.

  • Growing consumer demand for convenience is a primary market driver, with features like automated recipe personalization and proactive appliance alerts simplifying daily routines.
  • The focus on health and wellness is also significant, as AI-driven nutritional analysis and integration with fitness trackers are enabling personalized cooking experiences; meal plans generated by these systems show a 15% higher adherence rate than traditional methods.
  • Relentless technological advancement, particularly in smart sensor technology and voice-activated cooking capabilities, underpins this growth.
  • The ability to perform remote appliance monitoring and receive predictive appliance diagnostics adds a layer of practicality and long-term value for consumers, making the AI kitchen an increasingly attractive investment.

What are the market trends shaping the AI Kitchen Industry?

  • The market is witnessing a definitive shift from basic automation toward hyper-personalization and proactive assistance. This evolution transforms appliances into intelligent partners that anticipate user needs and tailor experiences accordingly.

  • A defining trend is the shift toward hyper-personalization and proactive assistance, transforming appliances into intelligent partners. The integration of generative AI is creating more intuitive conversational interfaces, with some platforms generating custom recipes 50% faster than manual methods. This AI-powered meal planning is central to the modern smart kitchen.
  • Another key trend is the emphasis on sustainability, with intelligent food management and AI-enhanced food preservation features helping to reduce household food spoilage by up to 40%. The development of comprehensive connected cooking platforms and robotic cooking systems enables a more seamless intelligent cooking workflow, supported by smart appliance firmware updates that continuously improve functionality and the smart kitchen experience.

What challenges does the AI Kitchen Industry face during its growth?

  • A significant challenge affecting widespread market adoption is the high initial cost of AI-enabled appliances and the difficulty in conveying a clear value proposition to mass-market consumers.

  • A major challenge is the high initial cost, with the price premium for AI-enabled appliances often 40-60% higher than standard models, creating a significant barrier for mass adoption. Data privacy and security are also critical concerns, as the collection of sensitive user information heightens the need for robust smart kitchen data privacy protocols.
  • Furthermore, ecosystem fragmentation due to a lack of smart appliance interoperability complicates the user experience, with over 70% of households using mixed-brand appliances reporting integration issues. Overcoming these hurdles, which include addressing smart kitchen safety features and ensuring reliable automated cooking parameter adjustment, is essential for future market expansion and building consumer trust in AI-optimized energy consumption claims.

Exclusive Technavio Analysis on Customer Landscape

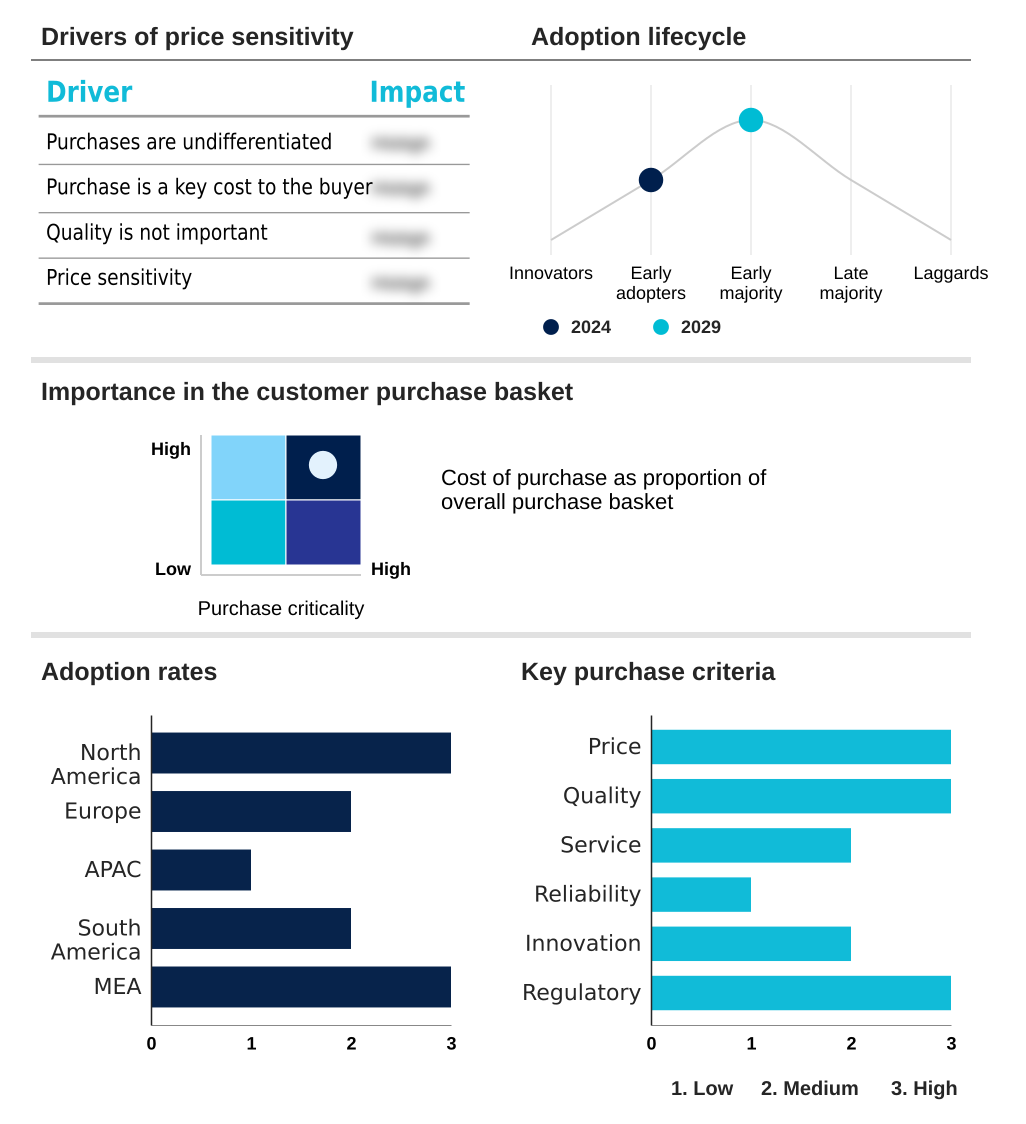
The ai kitchen market forecasting report includes the adoption lifecycle of the market, covering from the innovator’s stage to the laggard’s stage. It focuses on adoption rates in different regions based on penetration. Furthermore, the ai kitchen market report also includes key purchase criteria and drivers of price sensitivity to help companies evaluate and develop their market growth analysis strategies.

Customer Landscape of AI Kitchen Industry

Competitive Landscape

Companies are implementing various strategies, such as strategic alliances, ai kitchen market forecast, partnerships, mergers and acquisitions, geographical expansion, and product/service launches, to enhance their presence in the industry.

AB Electrolux - Key offerings focus on embedding intelligence across appliance lines, creating interconnected ecosystems that provide predictive assistance, automated cooking, and personalized user experiences.

The industry research and growth report includes detailed analyses of the competitive landscape of the market and information about key companies, including:

  • AB Electrolux
  • Breville Group Ltd.
  • BSH Home Appliances Ltd.
  • Fisher and Paykel Appliances Ltd.
  • FRIGIDAIRE
  • General Electric Co.
  • Haier Smart Home Co. Ltd.
  • Hisense International Co. Ltd.
  • Koninklijke Philips NV
  • LG Electronics Inc.
  • Miele and Cie. KG
  • Panasonic Holdings Corp.
  • Robert Bosch GmbH
  • Samsung Electronics Co. Ltd.
  • Sharp Consumer Electronics Poland sp. z o.o.
  • Siemens AG
  • THERMADOR
  • Toshiba Corp.
  • Whirlpool Corp.
  • Zhuhai Gree Electric Appliances Co. Ltd.

Qualitative and quantitative analysis of companies has been conducted to help clients understand the wider business environment as well as the strengths and weaknesses of key industry players. Data is qualitatively analyzed to categorize companies as pure play, category-focused, industry-focused, and diversified; it is quantitatively analyzed to categorize companies as dominant, leading, strong, tentative, and weak.

Recent Development and News in Ai kitchen market

  • In August, 2024, Samsung Electronics launched its Samsung Food platform, an AI-powered application for personalized meal planning and recipe discovery that integrates with its smart appliances.
  • In September, 2024, GE Appliances introduced its Profile Smart Mixer with Auto Sense, a product that embeds AI to automatically adjust mixing speed and duration for optimal consistency.
  • In January, 2025, LG Electronics announced its development of a multi-modal generative AI smart home agent designed to power its future appliances with advanced conversational capabilities.
  • In February, 2025, GE Appliances announced a strategic partnership with Instacart, enabling users to facilitate direct grocery ordering from their smart refrigerators to create a seamless procurement process.

Dive into Technavio’s robust research methodology, blending expert interviews, extensive data synthesis, and validated models for unparalleled AI Kitchen Market insights. See full methodology.

Market Scope
Page number 299
Base year 2024
Historic period 2019-2023
Forecast period 2025-2029
Growth momentum & CAGR Accelerate at a CAGR of 21.7%
Market growth 2025-2029 USD 48354.8 million
Market structure Fragmented
YoY growth 2024-2025(%) 19.2%
Key countries US, Canada, Mexico, Germany, UK, Italy, The Netherlands, France, Spain, China, South Korea, Japan, India, Australia, Indonesia, Brazil, Argentina, Colombia, South Africa, UAE, Israel, Saudi Arabia and Turkey
Competitive landscape Leading Companies, Market Positioning of Companies, Competitive Strategies, and Industry Risks

Request Free Sample

Research Analyst Overview

  • The AI kitchen market is rapidly evolving from a collection of standalone smart devices to a fully integrated smart home ecosystem. This transition is powered by core technologies including computer vision cameras and sophisticated machine learning algorithms that enable features like intelligent inventory tracking, automated cooking cycles, and personalized nutritional guidance.
  • The implementation of AI Pro Cooking technology and adaptive cooking algorithms delivers consistent culinary results, a key factor driving consumer adoption. Boardroom-level strategy is now focused on developing proprietary platforms versus embracing open IoT connectivity protocols to capture market share.
  • Innovations such as generative AI integration for AI-driven recipe generation and multi-modal AI agents with conversational interfaces are redefining the user experience. Features like guided cooking modes and proactive assistance for food waste reduction are becoming standard. Moreover, AI-assisted cooking has demonstrated a capacity to reduce food preparation errors by up to 20%, providing a quantifiable return on investment.
  • The inclusion of predictive maintenance capabilities further enhances the value proposition, solidifying the kitchen's role as an intelligent, responsive environment.

What are the Key Data Covered in this AI Kitchen Market Research and Growth Report?

  • What is the expected growth of the AI Kitchen Market between 2025 and 2029?

    • USD 48.35 billion, at a CAGR of 21.7%

  • What segmentation does the market report cover?

    • The report is segmented by Product Type (Refrigerator, Oven, Cooktops and ranges, Dishwasher, Others), Application (Residential, Commercial), Distribution Channel (Specialty stores, Online channels, Hypermarkets and supermarkets) and Geography (North America, Europe, APAC, South America, Middle East and Africa)

  • Which regions are analyzed in the report?

    • North America, Europe, APAC, South America and Middle East and Africa

  • What are the key growth drivers and market challenges?

    • Increasing consumer demand for convenience and automation, High initial cost and perceived value proposition

  • Who are the major players in the AI Kitchen Market?

    • AB Electrolux, Breville Group Ltd., BSH Home Appliances Ltd., Fisher and Paykel Appliances Ltd., FRIGIDAIRE, General Electric Co., Haier Smart Home Co. Ltd., Hisense International Co. Ltd., Koninklijke Philips NV, LG Electronics Inc., Miele and Cie. KG, Panasonic Holdings Corp., Robert Bosch GmbH, Samsung Electronics Co. Ltd., Sharp Consumer Electronics Poland sp. z o.o., Siemens AG, THERMADOR, Toshiba Corp., Whirlpool Corp. and Zhuhai Gree Electric Appliances Co. Ltd.

Market Research Insights

  • Market dynamics are shaped by a push toward holistic AI kitchen appliance integration and enhanced smart kitchen resource management. The focus is on delivering tangible outcomes through context-aware kitchen automation and AI for dietary management, which drives consumer adoption. For instance, systems featuring AI-based food spoilage detection have demonstrated the ability to reduce household food waste by up to 30%.
  • Similarly, intelligent dishwasher cycles that utilize real-time sensor data can lower water consumption by 20% compared to conventional models, addressing both economic and environmental concerns.
  • This emphasis on performance is further evident in AI cooking precision control, where automated parameter adjustments ensure consistent results, strengthening the value proposition beyond basic connectivity and making the voice-controlled kitchen environment more practical and efficient.

We can help! Our analysts can customize this ai kitchen market research report to meet your requirements.

Get in touch

1. Executive Summary

1.1 Market overview

Executive Summary - Chart on Market Overview
Executive Summary - Data Table on Market Overview
Executive Summary - Chart on Global Market Characteristics
Executive Summary - Chart on Market by Geography
Executive Summary - Chart on Market Segmentation by Product Type
Executive Summary - Chart on Market Segmentation by Application
Executive Summary - Chart on Market Segmentation by Distribution Channel
Executive Summary - Chart on Incremental Growth
Executive Summary - Data Table on Incremental Growth
Executive Summary - Chart on Company Market Positioning

2. Technavio Analysis

2.1 Analysis of price sensitivity, lifecycle, customer purchase basket, adoption rates, and purchase criteria

2.2 Criticality of inputs and Factors of differentiation

Chart on Overview on criticality of inputs and factors of differentiation

2.3 Factors of disruption

Chart on Overview on factors of disruption

2.4 Impact of drivers and challenges

Chart on Impact of drivers and challenges in 2024 and 2029

3. Market Landscape

3.1 Market ecosystem

Chart on Parent Market
Data Table on - Parent Market

3.2 Market characteristics

Chart on Market characteristics analysis

3.3 Value chain analysis

Chart on Value chain analysis

4. Market Sizing

4.1 Market definition

Data Table on Offerings of companies included in the market definition

4.2 Market segment analysis

Market segments

4.3 Market size 2024

4.4 Market outlook: Forecast for 2024-2029

Chart on Global - Market size and forecast 2024-2029 ($ million)
Data Table on Global - Market size and forecast 2024-2029 ($ million)
Chart on Global Market: Year-over-year growth 2024-2029 (%)
Data Table on Global Market: Year-over-year growth 2024-2029 (%)

5. Historic Market Size

5.1 Global AI Kitchen Market 2019 - 2023

Historic Market Size - Data Table on Global AI Kitchen Market 2019 - 2023 ($ million)

5.2 Product Type segment analysis 2019 - 2023

Historic Market Size - Product Type Segment 2019 - 2023 ($ million)

5.3 Application segment analysis 2019 - 2023

Historic Market Size - Application Segment 2019 - 2023 ($ million)

5.4 Distribution Channel segment analysis 2019 - 2023

Historic Market Size - Distribution Channel Segment 2019 - 2023 ($ million)

5.5 Geography segment analysis 2019 - 2023

Historic Market Size - Geography Segment 2019 - 2023 ($ million)

5.6 Country segment analysis 2019 - 2023

Historic Market Size - Country Segment 2019 - 2023 ($ million)

6. Five Forces Analysis

6.1 Five forces summary

Five forces analysis - Comparison between 2024 and 2029

6.2 Bargaining power of buyers

Bargaining power of buyers - Impact of key factors 2024 and 2029

6.3 Bargaining power of suppliers

Bargaining power of suppliers - Impact of key factors in 2024 and 2029

6.4 Threat of new entrants

Threat of new entrants - Impact of key factors in 2024 and 2029

6.5 Threat of substitutes

Threat of substitutes - Impact of key factors in 2024 and 2029

6.6 Threat of rivalry

Threat of rivalry - Impact of key factors in 2024 and 2029

6.7 Market condition

Chart on Market condition - Five forces 2024 and 2029

7. Market Segmentation by Product Type

7.1 Market segments

Chart on Product Type - Market share 2024-2029 (%)
Data Table on Product Type - Market share 2024-2029 (%)

7.2 Comparison by Product Type

Chart on Comparison by Product Type
Data Table on Comparison by Product Type

7.3 Refrigerator - Market size and forecast 2024-2029

Chart on Refrigerator - Market size and forecast 2024-2029 ($ million)
Data Table on Refrigerator - Market size and forecast 2024-2029 ($ million)
Chart on Refrigerator - Year-over-year growth 2024-2029 (%)
Data Table on Refrigerator - Year-over-year growth 2024-2029 (%)

7.4 Oven - Market size and forecast 2024-2029

Chart on Oven - Market size and forecast 2024-2029 ($ million)
Data Table on Oven - Market size and forecast 2024-2029 ($ million)
Chart on Oven - Year-over-year growth 2024-2029 (%)
Data Table on Oven - Year-over-year growth 2024-2029 (%)

7.5 Cooktops and ranges - Market size and forecast 2024-2029

Chart on Cooktops and ranges - Market size and forecast 2024-2029 ($ million)
Data Table on Cooktops and ranges - Market size and forecast 2024-2029 ($ million)
Chart on Cooktops and ranges - Year-over-year growth 2024-2029 (%)
Data Table on Cooktops and ranges - Year-over-year growth 2024-2029 (%)

7.6 Dishwasher - Market size and forecast 2024-2029

Chart on Dishwasher - Market size and forecast 2024-2029 ($ million)
Data Table on Dishwasher - Market size and forecast 2024-2029 ($ million)
Chart on Dishwasher - Year-over-year growth 2024-2029 (%)
Data Table on Dishwasher - Year-over-year growth 2024-2029 (%)

7.7 Others - Market size and forecast 2024-2029

Chart on Others - Market size and forecast 2024-2029 ($ million)
Data Table on Others - Market size and forecast 2024-2029 ($ million)
Chart on Others - Year-over-year growth 2024-2029 (%)
Data Table on Others - Year-over-year growth 2024-2029 (%)

7.8 Market opportunity by Product Type

Market opportunity by Product Type ($ million)
Data Table on Market opportunity by Product Type ($ million)

8. Market Segmentation by Application

8.1 Market segments

Chart on Application - Market share 2024-2029 (%)
Data Table on Application - Market share 2024-2029 (%)

8.2 Comparison by Application

Chart on Comparison by Application
Data Table on Comparison by Application

8.3 Residential - Market size and forecast 2024-2029

Chart on Residential - Market size and forecast 2024-2029 ($ million)
Data Table on Residential - Market size and forecast 2024-2029 ($ million)
Chart on Residential - Year-over-year growth 2024-2029 (%)
Data Table on Residential - Year-over-year growth 2024-2029 (%)

8.4 Commercial - Market size and forecast 2024-2029

Chart on Commercial - Market size and forecast 2024-2029 ($ million)
Data Table on Commercial - Market size and forecast 2024-2029 ($ million)
Chart on Commercial - Year-over-year growth 2024-2029 (%)
Data Table on Commercial - Year-over-year growth 2024-2029 (%)

8.5 Market opportunity by Application

Market opportunity by Application ($ million)
Data Table on Market opportunity by Application ($ million)

9. Market Segmentation by Distribution Channel

9.1 Market segments

Chart on Distribution Channel - Market share 2024-2029 (%)
Data Table on Distribution Channel - Market share 2024-2029 (%)

9.2 Comparison by Distribution Channel

Chart on Comparison by Distribution Channel
Data Table on Comparison by Distribution Channel

9.3 Specialty stores - Market size and forecast 2024-2029

Chart on Specialty stores - Market size and forecast 2024-2029 ($ million)
Data Table on Specialty stores - Market size and forecast 2024-2029 ($ million)
Chart on Specialty stores - Year-over-year growth 2024-2029 (%)
Data Table on Specialty stores - Year-over-year growth 2024-2029 (%)

9.4 Online channels - Market size and forecast 2024-2029

Chart on Online channels - Market size and forecast 2024-2029 ($ million)
Data Table on Online channels - Market size and forecast 2024-2029 ($ million)
Chart on Online channels - Year-over-year growth 2024-2029 (%)
Data Table on Online channels - Year-over-year growth 2024-2029 (%)

9.5 Hypermarkets and supermarkets - Market size and forecast 2024-2029

Chart on Hypermarkets and supermarkets - Market size and forecast 2024-2029 ($ million)
Data Table on Hypermarkets and supermarkets - Market size and forecast 2024-2029 ($ million)
Chart on Hypermarkets and supermarkets - Year-over-year growth 2024-2029 (%)
Data Table on Hypermarkets and supermarkets - Year-over-year growth 2024-2029 (%)

9.6 Market opportunity by Distribution Channel

Market opportunity by Distribution Channel ($ million)
Data Table on Market opportunity by Distribution Channel ($ million)

10. Customer Landscape

10.1 Customer landscape overview

Analysis of price sensitivity, lifecycle, customer purchase basket, adoption rates, and purchase criteria

11. Geographic Landscape

11.1 Geographic segmentation

Chart on Market share by geography 2024-2029 (%)
Data Table on Market share by geography 2024-2029 (%)

11.2 Geographic comparison

Chart on Geographic comparison
Data Table on Geographic comparison

11.3 North America - Market size and forecast 2024-2029

Chart on North America - Market size and forecast 2024-2029 ($ million)
Data Table on North America - Market size and forecast 2024-2029 ($ million)
Chart on North America - Year-over-year growth 2024-2029 (%)
Data Table on North America - Year-over-year growth 2024-2029 (%)
Chart on Regional Comparison - North America
Data Table on Regional Comparison - North America

11.3.1 US - Market size and forecast 2024-2029

Chart on US - Market size and forecast 2024-2029 ($ million)
Data Table on US - Market size and forecast 2024-2029 ($ million)
Chart on US - Year-over-year growth 2024-2029 (%)
Data Table on US - Year-over-year growth 2024-2029 (%)

11.3.2 Canada - Market size and forecast 2024-2029

Chart on Canada - Market size and forecast 2024-2029 ($ million)
Data Table on Canada - Market size and forecast 2024-2029 ($ million)
Chart on Canada - Year-over-year growth 2024-2029 (%)
Data Table on Canada - Year-over-year growth 2024-2029 (%)

11.3.3 Mexico - Market size and forecast 2024-2029

Chart on Mexico - Market size and forecast 2024-2029 ($ million)
Data Table on Mexico - Market size and forecast 2024-2029 ($ million)
Chart on Mexico - Year-over-year growth 2024-2029 (%)
Data Table on Mexico - Year-over-year growth 2024-2029 (%)

11.4 Europe - Market size and forecast 2024-2029

Chart on Europe - Market size and forecast 2024-2029 ($ million)
Data Table on Europe - Market size and forecast 2024-2029 ($ million)
Chart on Europe - Year-over-year growth 2024-2029 (%)
Data Table on Europe - Year-over-year growth 2024-2029 (%)
Chart on Regional Comparison - Europe
Data Table on Regional Comparison - Europe

11.4.1 Germany - Market size and forecast 2024-2029

Chart on Germany - Market size and forecast 2024-2029 ($ million)
Data Table on Germany - Market size and forecast 2024-2029 ($ million)
Chart on Germany - Year-over-year growth 2024-2029 (%)
Data Table on Germany - Year-over-year growth 2024-2029 (%)

11.4.2 UK - Market size and forecast 2024-2029

Chart on UK - Market size and forecast 2024-2029 ($ million)
Data Table on UK - Market size and forecast 2024-2029 ($ million)
Chart on UK - Year-over-year growth 2024-2029 (%)
Data Table on UK - Year-over-year growth 2024-2029 (%)

11.4.3 Italy - Market size and forecast 2024-2029

Chart on Italy - Market size and forecast 2024-2029 ($ million)
Data Table on Italy - Market size and forecast 2024-2029 ($ million)
Chart on Italy - Year-over-year growth 2024-2029 (%)
Data Table on Italy - Year-over-year growth 2024-2029 (%)

11.4.4 The Netherlands - Market size and forecast 2024-2029

Chart on The Netherlands - Market size and forecast 2024-2029 ($ million)
Data Table on The Netherlands - Market size and forecast 2024-2029 ($ million)
Chart on The Netherlands - Year-over-year growth 2024-2029 (%)
Data Table on The Netherlands - Year-over-year growth 2024-2029 (%)

11.4.5 France - Market size and forecast 2024-2029

Chart on France - Market size and forecast 2024-2029 ($ million)
Data Table on France - Market size and forecast 2024-2029 ($ million)
Chart on France - Year-over-year growth 2024-2029 (%)
Data Table on France - Year-over-year growth 2024-2029 (%)

11.4.6 Spain - Market size and forecast 2024-2029

Chart on Spain - Market size and forecast 2024-2029 ($ million)
Data Table on Spain - Market size and forecast 2024-2029 ($ million)
Chart on Spain - Year-over-year growth 2024-2029 (%)
Data Table on Spain - Year-over-year growth 2024-2029 (%)

11.5 APAC - Market size and forecast 2024-2029

Chart on APAC - Market size and forecast 2024-2029 ($ million)
Data Table on APAC - Market size and forecast 2024-2029 ($ million)
Chart on APAC - Year-over-year growth 2024-2029 (%)
Data Table on APAC - Year-over-year growth 2024-2029 (%)
Chart on Regional Comparison - APAC
Data Table on Regional Comparison - APAC

11.5.1 China - Market size and forecast 2024-2029

Chart on China - Market size and forecast 2024-2029 ($ million)
Data Table on China - Market size and forecast 2024-2029 ($ million)
Chart on China - Year-over-year growth 2024-2029 (%)
Data Table on China - Year-over-year growth 2024-2029 (%)

11.5.2 South Korea - Market size and forecast 2024-2029

Chart on South Korea - Market size and forecast 2024-2029 ($ million)
Data Table on South Korea - Market size and forecast 2024-2029 ($ million)
Chart on South Korea - Year-over-year growth 2024-2029 (%)
Data Table on South Korea - Year-over-year growth 2024-2029 (%)

11.5.3 Japan - Market size and forecast 2024-2029

Chart on Japan - Market size and forecast 2024-2029 ($ million)
Data Table on Japan - Market size and forecast 2024-2029 ($ million)
Chart on Japan - Year-over-year growth 2024-2029 (%)
Data Table on Japan - Year-over-year growth 2024-2029 (%)

11.5.4 India - Market size and forecast 2024-2029

Chart on India - Market size and forecast 2024-2029 ($ million)
Data Table on India - Market size and forecast 2024-2029 ($ million)
Chart on India - Year-over-year growth 2024-2029 (%)
Data Table on India - Year-over-year growth 2024-2029 (%)

11.5.5 Australia - Market size and forecast 2024-2029

Chart on Australia - Market size and forecast 2024-2029 ($ million)
Data Table on Australia - Market size and forecast 2024-2029 ($ million)
Chart on Australia - Year-over-year growth 2024-2029 (%)
Data Table on Australia - Year-over-year growth 2024-2029 (%)

11.5.6 Indonesia - Market size and forecast 2024-2029

Chart on Indonesia - Market size and forecast 2024-2029 ($ million)
Data Table on Indonesia - Market size and forecast 2024-2029 ($ million)
Chart on Indonesia - Year-over-year growth 2024-2029 (%)
Data Table on Indonesia - Year-over-year growth 2024-2029 (%)

11.6 South America - Market size and forecast 2024-2029

Chart on South America - Market size and forecast 2024-2029 ($ million)
Data Table on South America - Market size and forecast 2024-2029 ($ million)
Chart on South America - Year-over-year growth 2024-2029 (%)
Data Table on South America - Year-over-year growth 2024-2029 (%)
Chart on Regional Comparison - South America
Data Table on Regional Comparison - South America

11.6.1 Brazil - Market size and forecast 2024-2029

Chart on Brazil - Market size and forecast 2024-2029 ($ million)
Data Table on Brazil - Market size and forecast 2024-2029 ($ million)
Chart on Brazil - Year-over-year growth 2024-2029 (%)
Data Table on Brazil - Year-over-year growth 2024-2029 (%)

11.6.2 Argentina - Market size and forecast 2024-2029

Chart on Argentina - Market size and forecast 2024-2029 ($ million)
Data Table on Argentina - Market size and forecast 2024-2029 ($ million)
Chart on Argentina - Year-over-year growth 2024-2029 (%)
Data Table on Argentina - Year-over-year growth 2024-2029 (%)

11.6.3 Colombia - Market size and forecast 2024-2029

Chart on Colombia - Market size and forecast 2024-2029 ($ million)
Data Table on Colombia - Market size and forecast 2024-2029 ($ million)
Chart on Colombia - Year-over-year growth 2024-2029 (%)
Data Table on Colombia - Year-over-year growth 2024-2029 (%)

11.7 Middle East and Africa - Market size and forecast 2024-2029

Chart on Middle East and Africa - Market size and forecast 2024-2029 ($ million)
Data Table on Middle East and Africa - Market size and forecast 2024-2029 ($ million)
Chart on Middle East and Africa - Year-over-year growth 2024-2029 (%)
Data Table on Middle East and Africa - Year-over-year growth 2024-2029 (%)
Chart on Regional Comparison - Middle East and Africa
Data Table on Regional Comparison - Middle East and Africa

11.7.1 South Africa - Market size and forecast 2024-2029

Chart on South Africa - Market size and forecast 2024-2029 ($ million)
Data Table on South Africa - Market size and forecast 2024-2029 ($ million)
Chart on South Africa - Year-over-year growth 2024-2029 (%)
Data Table on South Africa - Year-over-year growth 2024-2029 (%)

11.7.2 UAE - Market size and forecast 2024-2029

Chart on UAE - Market size and forecast 2024-2029 ($ million)
Data Table on UAE - Market size and forecast 2024-2029 ($ million)
Chart on UAE - Year-over-year growth 2024-2029 (%)
Data Table on UAE - Year-over-year growth 2024-2029 (%)

11.7.3 Israel - Market size and forecast 2024-2029

Chart on Israel - Market size and forecast 2024-2029 ($ million)
Data Table on Israel - Market size and forecast 2024-2029 ($ million)
Chart on Israel - Year-over-year growth 2024-2029 (%)
Data Table on Israel - Year-over-year growth 2024-2029 (%)

11.7.4 Saudi Arabia - Market size and forecast 2024-2029

Chart on Saudi Arabia - Market size and forecast 2024-2029 ($ million)
Data Table on Saudi Arabia - Market size and forecast 2024-2029 ($ million)
Chart on Saudi Arabia - Year-over-year growth 2024-2029 (%)
Data Table on Saudi Arabia - Year-over-year growth 2024-2029 (%)

11.7.5 Turkey - Market size and forecast 2024-2029

Chart on Turkey - Market size and forecast 2024-2029 ($ million)
Data Table on Turkey - Market size and forecast 2024-2029 ($ million)
Chart on Turkey - Year-over-year growth 2024-2029 (%)
Data Table on Turkey - Year-over-year growth 2024-2029 (%)

11.8 Market opportunity by geography

Market opportunity by geography ($ million)
Data Tables on Market opportunity by geography ($ million)

12. Drivers, Challenges, and Opportunity

12.1 Market drivers

Increasing consumer demand for convenience and automation
Growing focus on health, wellness, and sustainability
Rapid advancements in AI and IoT technology

12.2 Market challenges

High initial cost and perceived value proposition
Data privacy and security concerns
Interoperability and ecosystem fragmentation

12.3 Impact of drivers and challenges

Impact of drivers and challenges in 2024 and 2029

12.4 Market opportunities

Hyper-personalization and proactive assistance
Integration of generative AI for enhanced user experience
Emphasis on sustainability and food waste reduction

13. Competitive Landscape

13.1 Overview

13.2

Overview on criticality of inputs and factors of differentiation

13.3 Landscape disruption

Overview on factors of disruption

13.4 Industry risks

Impact of key risks on business

14. Competitive Analysis

14.1 Companies profiled

Companies covered

14.2 Company ranking index

14.3 Market positioning of companies

Matrix on companies position and classification

14.4 AB Electrolux

AB Electrolux - Overview
AB Electrolux - Business segments
AB Electrolux - Key news
AB Electrolux - Key offerings
AB Electrolux - Segment focus
SWOT

14.5 BSH Home Appliances Ltd.

BSH Home Appliances Ltd. - Overview
BSH Home Appliances Ltd. - Product / Service
BSH Home Appliances Ltd. - Key offerings
SWOT

14.6 Fisher and Paykel Appliances Ltd.

Fisher and Paykel Appliances Ltd. - Overview
Fisher and Paykel Appliances Ltd. - Product / Service
Fisher and Paykel Appliances Ltd. - Key offerings
SWOT

14.7 General Electric Co.

General Electric Co. - Overview
General Electric Co. - Business segments
General Electric Co. - Key news
General Electric Co. - Key offerings
General Electric Co. - Segment focus
SWOT

14.8 Haier Smart Home Co. Ltd.

Haier Smart Home Co. Ltd. - Overview
Haier Smart Home Co. Ltd. - Business segments
Haier Smart Home Co. Ltd. - Key offerings
Haier Smart Home Co. Ltd. - Segment focus
SWOT

14.9 Koninklijke Philips NV

Koninklijke Philips NV - Overview
Koninklijke Philips NV - Business segments
Koninklijke Philips NV - Key news
Koninklijke Philips NV - Key offerings
Koninklijke Philips NV - Segment focus
SWOT

14.10 LG Electronics Inc.

LG Electronics Inc. - Overview
LG Electronics Inc. - Product / Service
LG Electronics Inc. - Key offerings
SWOT

14.11 Miele and Cie. KG

Miele and Cie. KG - Overview
Miele and Cie. KG - Product / Service
Miele and Cie. KG - Key offerings
SWOT

14.12 Panasonic Holdings Corp.

Panasonic Holdings Corp. - Overview
Panasonic Holdings Corp. - Business segments
Panasonic Holdings Corp. - Key news
Panasonic Holdings Corp. - Key offerings
Panasonic Holdings Corp. - Segment focus
SWOT

14.13 Robert Bosch GmbH

Robert Bosch GmbH - Overview
Robert Bosch GmbH - Product / Service
Robert Bosch GmbH - Key news
Robert Bosch GmbH - Key offerings
SWOT

14.14 Samsung Electronics Co. Ltd.

Samsung Electronics Co. Ltd. - Overview
Samsung Electronics Co. Ltd. - Business segments
Samsung Electronics Co. Ltd. - Key news
Samsung Electronics Co. Ltd. - Key offerings
Samsung Electronics Co. Ltd. - Segment focus
SWOT

14.15 Sharp Consumer Electronics Poland sp. z o.o.

Sharp Consumer Electronics Poland sp. z o.o. - Overview
Sharp Consumer Electronics Poland sp. z o.o. - Product / Service
Sharp Consumer Electronics Poland sp. z o.o. - Key offerings
SWOT

14.16 Siemens AG

Siemens AG - Overview
Siemens AG - Business segments
Siemens AG - Key news
Siemens AG - Key offerings
Siemens AG - Segment focus
SWOT

14.17 THERMADOR

THERMADOR - Overview
THERMADOR - Product / Service
THERMADOR - Key offerings
SWOT

14.18 Whirlpool Corp.

Whirlpool Corp. - Overview
Whirlpool Corp. - Business segments
Whirlpool Corp. - Key offerings
Whirlpool Corp. - Segment focus
SWOT

15. Appendix

15.1 Scope of the report

Market definition
Objectives
Notes and caveats

15.2 Inclusions and exclusions checklist

Inclusions checklist
Exclusions checklist

15.3 Currency conversion rates for US$

15.4 Research methodology

15.5 Data procurement

Information sources

15.6 Data validation

15.7 Validation techniques employed for market sizing

15.8 Data synthesis

15.9 360 degree market analysis

15.10 List of abbreviations

Research Methodology

Technavio presents a detailed picture of the market by way of study, synthesis, and summation of data from multiple sources. The analysts have presented the various facets of the market with a particular focus on identifying the key industry influencers. The data thus presented is comprehensive, reliable, and the result of extensive research, both primary and secondary.

INFORMATION SOURCES

Primary sources

  • Manufacturers and suppliers
  • Channel partners
  • Industry experts
  • Strategic decision makers

Secondary sources

  • Industry journals and periodicals
  • Government data
  • Financial reports of key industry players
  • Historical data
  • Press releases

DATA ANALYSIS

Data Synthesis

  • Collation of data
  • Estimation of key figures
  • Analysis of derived insights

Data Validation

  • Triangulation with data models
  • Reference against proprietary databases
  • Corroboration with industry experts

REPORT WRITING

Qualitative

  • Market drivers
  • Market challenges
  • Market trends
  • Five forces analysis

Quantitative

  • Market size and forecast
  • Market segmentation
  • Geographical insights
  • Competitive landscape

Interested in this report?

Get your sample now to see our research methodology and insights!

Download Now

Frequently Asked Questions

AI Kitchen market growth will increase by USD 48354.8 million during 2025-2029.

The AI Kitchen market is expected to grow at a CAGR of 21.7% during 2025-2029.

AI Kitchen market is segmented by Product type (Refrigerator, Oven, Cooktops and ranges, Dishwasher, Others) Application (Residential, Commercial) Distribution channel (Specialty stores, Online channels, Hypermarkets and supermarkets)

AB Electrolux, Breville Group Ltd., BSH Home Appliances Ltd., Fisher and Paykel Appliances Ltd., FRIGIDAIRE, General Electric Co., Haier Smart Home Co. Ltd., Hisense International Co. Ltd., Koninklijke Philips NV, LG Electronics Inc., Miele and Cie. KG, Panasonic Holdings Corp., Robert Bosch GmbH, Samsung Electronics Co. Ltd., Sharp Consumer Electronics Poland sp. z o.o., Siemens AG, THERMADOR, Toshiba Corp., Whirlpool Corp., Zhuhai Gree Electric Appliances Co. Ltd. are a few of the key vendors in the AI Kitchen market.

North America will register the highest growth rate of 34% among the other regions. Therefore, the AI Kitchen market in North America is expected to garner significant business opportunities for the vendors during the forecast period.

US, Canada, Mexico, Germany, UK, Italy, The Netherlands, France, Spain, China, South Korea, Japan, India, Australia, Indonesia, Brazil, Argentina, Colombia, South Africa, UAE, Israel, Saudi Arabia, Turkey

  • Increasing consumer demand for convenience and automation is the driving factor this market.

The AI Kitchen market vendors should focus on grabbing business opportunities from the Product type segment as it accounted for the largest market share in the base year.