AI Services Market Analysis, Size, and Forecast 2025-2029: North America (US, Canada, and Mexico), APAC (China, Japan, and India), Europe (Germany, UK, and France), South America (Brazil, Argentina, and Colombia), Middle East and Africa (Saudi Arabia, UAE, and South Africa), and Rest of World (ROW)

AI Services Market Analysis, Size, and Forecast 2025-2029:
North America (US, Canada, and Mexico), APAC (China, Japan, and India), Europe (Germany, UK, and France), South America (Brazil, Argentina, and Colombia), Middle East and Africa (Saudi Arabia, UAE, and South Africa), and Rest of World (ROW)

Published: Dec 2025 295 Pages SKU: IRTNTR81037

Market Overview at a Glance

$112.95 B
Market Opportunity
43.3%
CAGR 2024 - 2029
37.2%
North America Growth
$11.56 B
Large enterprises segment 2023

AI Services Market Size 2025-2029

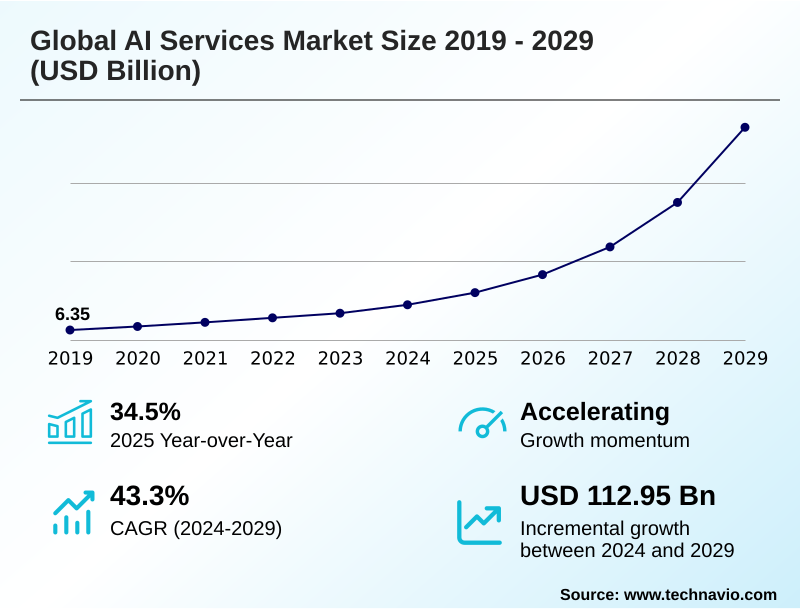
The ai services market size is valued to increase by USD 112.95 billion, at a CAGR of 43.3% from 2024 to 2029. Proliferation of generative AI and large language models will drive the ai services market.

Major Market Trends & Insights

  • North America dominated the market and accounted for a 37.2% growth during the forecast period.
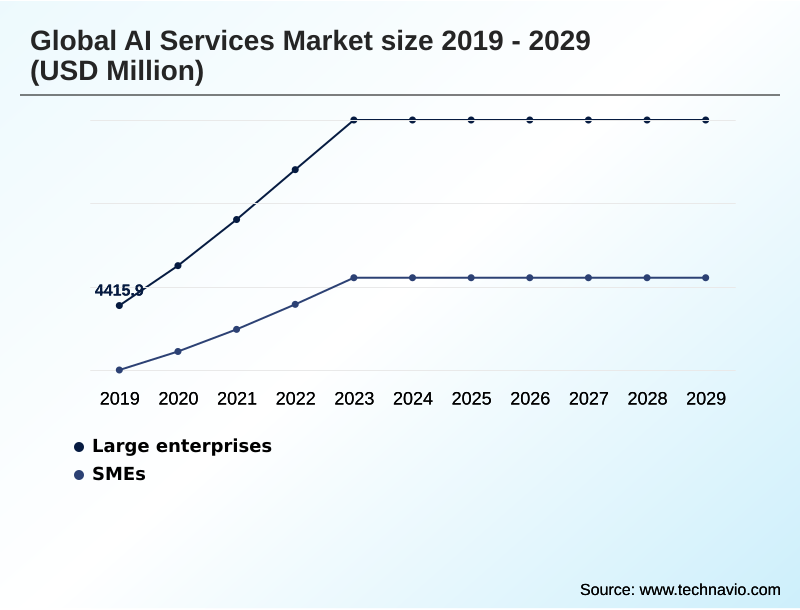
  • By Organization Size - Large enterprises segment was valued at USD 11.56 billion in 2023
  • By Type - Software as a service segment accounted for the largest market revenue share in 2023

Market Size & Forecast

  • Market Opportunities: USD 129.01 billion
  • Market Future Opportunities: USD 112.95 billion
  • CAGR from 2024 to 2029 : 43.3%

Market Summary

  • The AI services market is undergoing a period of unprecedented and transformative growth, moving beyond niche applications and into the core of mainstream enterprise strategy. This expansion is largely propelled by the maturation and widespread accessibility of artificial intelligence technologies.
  • Following a period of intense research and development, the market has reached an inflection point where the practical, commercial application of large language models and other generative systems is not only viable but essential for competitive positioning.
  • Businesses across diverse sectors are actively seeking ai services for enterprise workflows to enhance operational efficiency, personalize customer experiences, and unlock new revenue streams. The prevailing trend is a decisive shift from experimental pilot programs to full-scale strategic integration of AI into fundamental business processes, such as ai-powered supply chain route optimization.
  • This dynamic is illustrated by the strategies of major technology corporations and a maturing enterprise ai strategy for smes. The market is focused on practical, domain-specific applications that enhance human capability and automate routine tasks across all major business functions, from finance to human resources, requiring a blend of technical AI knowledge and deep domain expertise.

What will be the Size of the AI Services Market during the forecast period?

Get Key Insights on Market Forecast (PDF) Request Free Sample

How is the AI Services Market Segmented?

The ai services industry research report provides comprehensive data (region-wise segment analysis), with forecasts and estimates in "USD million" for the period 2025-2029, as well as historical data from 2019-2023 for the following segments.

  • Organization size
    • Large enterprises
    • SMEs
  • Type
    • Software as a service
    • Platform as a service
    • Infrastructure as a service
  • End-user
    • Healthcare
    • BFSI
    • Retail
    • Manufacturing
    • Transportation
  • Geography
    • North America
      • US
      • Canada
      • Mexico
    • APAC
      • China
      • Japan
      • India
    • Europe
      • Germany
      • UK
      • France
    • South America
      • Brazil
      • Argentina
      • Colombia
    • Middle East and Africa
      • Saudi Arabia
      • UAE
      • South Africa
    • Rest of World (ROW)

By Organization Size Insights

The large enterprises segment is estimated to witness significant growth during the forecast period.

Large enterprises are the primary drivers of market revenue, pursuing strategic ai implementation of enterprise-grade ai solutions to secure competitive advantages. Their adoption extends beyond experimentation, focusing on ai for operational efficiency and the deployment of large language models (llms).

These organizations engage in complex projects, including bespoke ai model development and autonomous systems integration, which necessitates a thorough ai implementation cost analysis.

They leverage ai infrastructure as a service (iaas) for scalability and require robust ai governance frameworks for compliance. This commitment is evidenced by initiatives in ai in financial risk management where firms report a 25% improvement in threat detection accuracy.

The focus is on transformative programs involving ai readiness assessment and mlops platform integration for ai-powered workflow automation.

Request Free Sample

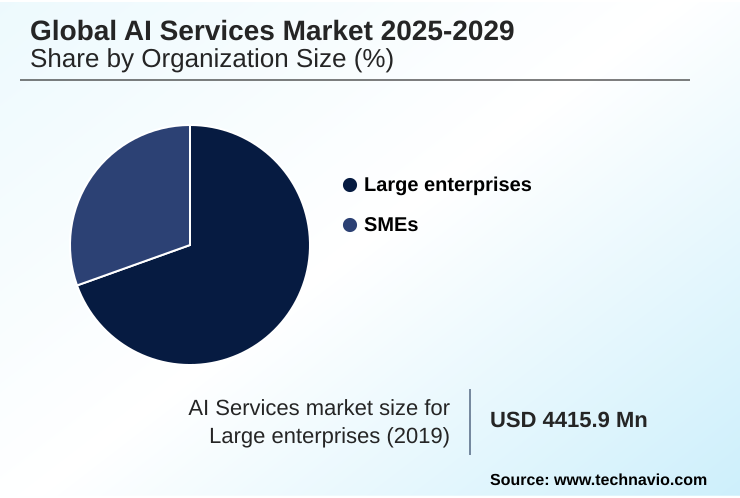
The Large enterprises segment was valued at USD 11.56 billion in 2023 and showed a gradual increase during the forecast period.

Request Free Sample

Regional Analysis

North America is estimated to contribute 37.2% to the growth of the global market during the forecast period.Technavio’s analysts have elaborately explained the regional trends and drivers that shape the market during the forecast period.

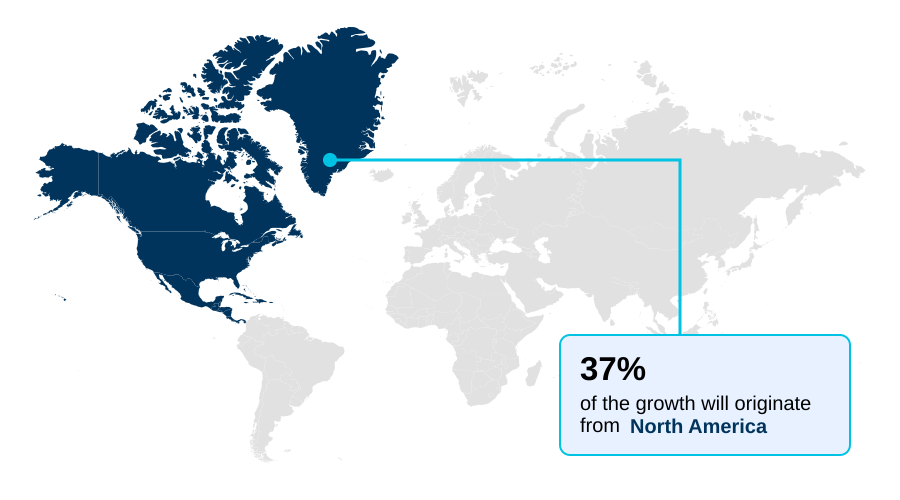
See How AI Services Market Demand is Rising in North America Request Free Sample

The geographic landscape is led by North America, where a mature enterprise ai adoption strategy prioritizes ai workload optimization and cloud ai service integration.

Enterprises in this region heavily invest in computer vision systems and ai-driven supply chain optimization, achieving up to a 15% reduction in logistics costs.

The APAC region is the fastest-growing market, with government initiatives accelerating the adoption of federated learning models and custom silicon accelerators.

In Europe, the focus is on regulatory alignment and ai model security, driving demand for solutions that address data poisoning mitigation.

Across all regions, ai systems integration with legacy platforms is a key service requirement, alongside managed ai infrastructure and ai model fine-tuning to create tools like stateful ai assistants for ai for retail personalization.

Market Dynamics

Our researchers analyzed the data with 2024 as the base year, along with the key drivers, trends, and challenges. A holistic analysis of drivers will help companies refine their marketing strategies to gain a competitive advantage.

  • As organizations advance their digital transformation journeys, the focus shifts to deploying ai services for enterprise workflows. A central consideration is the cost of implementing large language models, which requires a careful analysis of both infrastructural spend and talent acquisition.
  • A critical priority is building secure generative ai applications, which involves a secure ai model lifecycle management approach to protect against emerging threats. The demand for specialized expertise is evident in sectors like healthcare, with a significant increase in projects for ai model development for healthcare.
  • Many developers are realizing the benefits of paas for ai development, as it accelerates timelines and simplifies the process of optimizing ai workloads on cloud. The complexities of managing ai infrastructure as a service are driving many to seek specialized partners. Developing a cohesive enterprise ai strategy for smes is becoming crucial for smaller players to remain competitive.
  • For larger retailers, scaling ai services for retail is key to enabling ai-driven personalization in e-commerce. Similarly, there are notable generative ai use cases in finance, from automated reporting to client interaction.
  • The verticalized ai for manufacturing sector is driving ai predictive maintenance for industry 4.0, where digitally mature factories are now resolving potential equipment failures twice as fast as those using traditional methods. The debate over comparing open-source and commercial llms continues, while regulatory challenges in ai deployment shape implementation choices.
  • The use of generative ai for software development is boosting productivity, guided by ethical ai implementation best practices. Finally, ai-powered supply chain route optimization and developing human-centric conversational ai are delivering tangible operational efficiencies and improved customer satisfaction.

What are the key market drivers leading to the rise in the adoption of AI Services Industry?

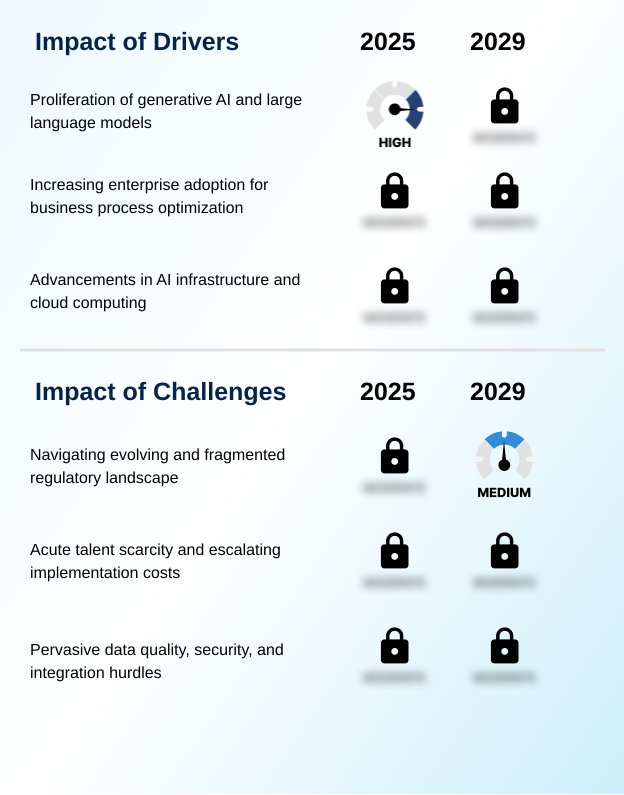
  • The proliferation of generative AI and powerful large language models is a key driver propelling growth and investment in the AI services market.

  • The democratization of ai supercomputing access through cloud-based ai platforms is a significant market driver.
  • These platforms, often structured as ai platform as a service (paas), enable organizations to leverage powerful natural language processing (nlp) and develop domain-specific ai models without massive upfront investment.
  • This trend is fueling data monetization with ai, as companies can now process vast datasets to create verticalized ai solutions. For instance, ai in healthcare diagnostics has shown the ability to analyze medical images 40% faster than manual methods.
  • The rise of powerful open-source ai models further spurs innovation, though it also increases the need for model evasion defense and secure ai development.
  • This ecosystem is supported by advances in ai-specific semiconductors and allows for greater ai solution customization in tools like conversational ai platforms.

What are the market trends shaping the AI Services Industry?

  • A primary trend influencing the market is the proliferation of generative AI, coupled with its accelerating adoption across enterprises for strategic implementation and business process optimization.

  • A primary trend is the infusion of generative ai systems into mainstream enterprise software, delivered through accessible ai software as a service (saas) models. This facilitates ai for business process optimization, with firms reporting up to a 30% reduction in cycle times for content creation.
  • Concurrently, the demand for predictive analytics models is surging, especially for ai for predictive maintenance in industrial settings, where deployments have cut unplanned downtime by 18%. The pursuit of scalable ai deployment is fueling innovation in machine learning operations (mlops) and the use of ai application development apis.
  • This trend emphasizes human-centric ai design and advanced prompt engineering techniques, enabling more intuitive interaction with complex systems like ai-powered digital twins for ai for logistics optimization and algorithmic trading systems which rely on precise data-driven decision making.

What challenges does the AI Services Industry face during its growth?

  • Navigating the complex, fragmented, and rapidly evolving regulatory landscape presents a key challenge to the seamless growth of the AI services industry.

  • A key challenge is ensuring ai ethics and compliance, as fragmented ai regulatory compliance frameworks create operational hurdles. Enterprises are increasingly demanding trustworthy ai systems and explainable ai (xai), making responsible ai deployment a prerequisite for adoption.
  • The scarcity of expertise in areas like ai infrastructure management and ai model lifecycle management inflates costs, with specialist salaries being 50% higher than traditional IT roles. These hurdles are compounded by the technical complexity of establishing data lakehouse architecture needed for ai in smart manufacturing and ai-powered drug discovery.
  • While managed ai services can mitigate some of this burden, the industry-wide push for ai talent development is critical for long-term growth and effective implementation of automated quality control and ai-powered customer service systems.

Exclusive Technavio Analysis on Customer Landscape

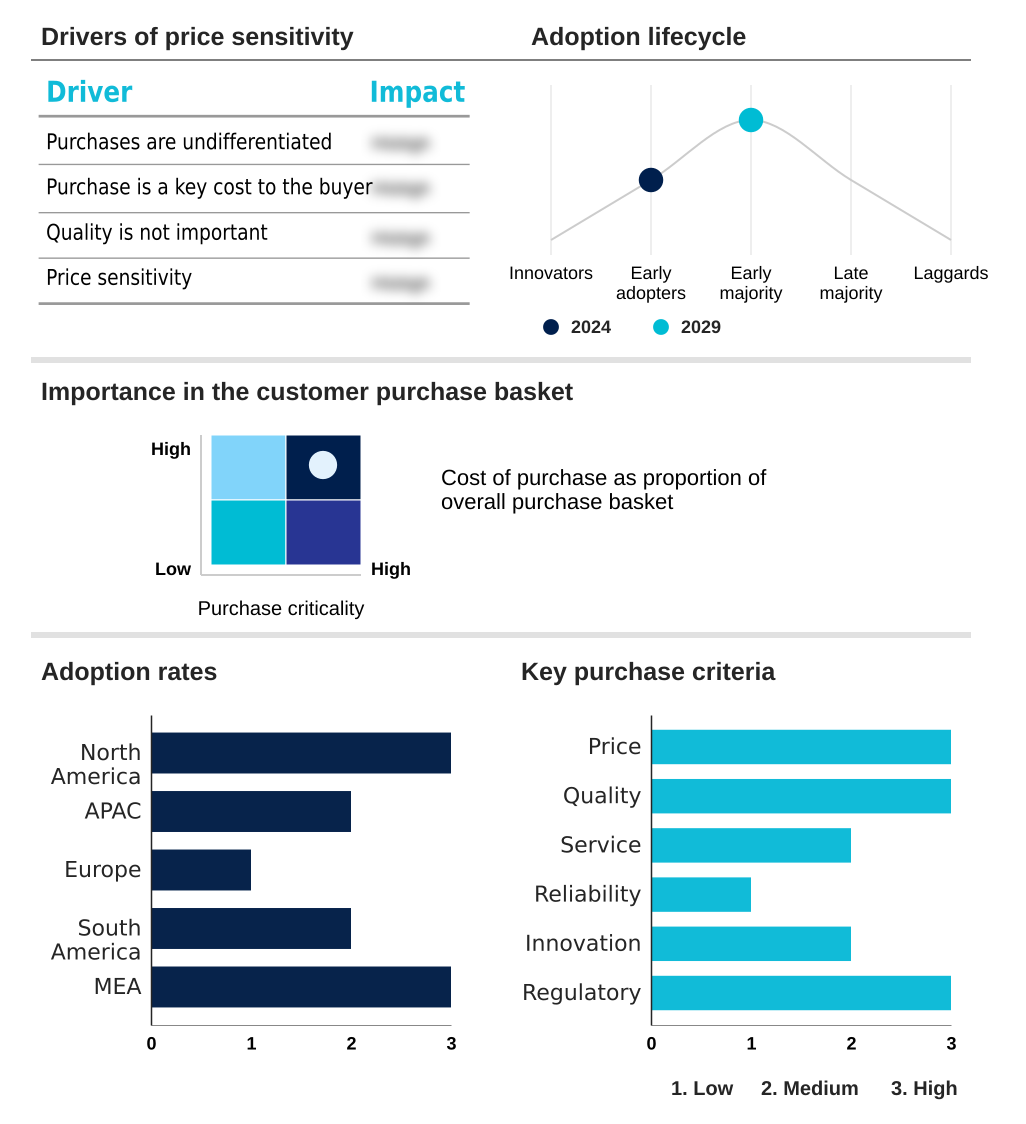
The ai services market forecasting report includes the adoption lifecycle of the market, covering from the innovator’s stage to the laggard’s stage. It focuses on adoption rates in different regions based on penetration. Furthermore, the ai services market report also includes key purchase criteria and drivers of price sensitivity to help companies evaluate and develop their market growth analysis strategies.

Customer Landscape of AI Services Industry

Competitive Landscape

Companies are implementing various strategies, such as strategic alliances, ai services market forecast, partnerships, mergers and acquisitions, geographical expansion, and product/service launches, to enhance their presence in the industry.

Amazon.com Inc. - Key offerings include managed services, custom model development, and access to scalable AI platforms and APIs for integration into enterprise workflows.

The industry research and growth report includes detailed analyses of the competitive landscape of the market and information about key companies, including:

  • Amazon.com Inc.
  • Anthropic
  • Apple Inc.
  • Baidu Inc.
  • Cohere
  • Crusoe Energy Systems LLC
  • Databricks Inc.
  • DeepL SE
  • Eleven Labs Inc.
  • Glean Technologies Inc.
  • Google LLC
  • Hugging Face
  • IBM Corp.
  • Lambda Inc.
  • Microsoft Corp.
  • Mistral AI
  • OpenAI
  • Stability AI
  • Tencent Holdings Ltd.

Qualitative and quantitative analysis of companies has been conducted to help clients understand the wider business environment as well as the strengths and weaknesses of key industry players. Data is qualitatively analyzed to categorize companies as pure play, category-focused, industry-focused, and diversified; it is quantitatively analyzed to categorize companies as dominant, leading, strong, tentative, and weak.

Recent Development and News in Ai services market

  • In September, 2024, Databricks announced its plan to acquire Tabular, a data management startup, to enhance data lakehouse architectures for large-scale AI.
  • In November, 2024, Microsoft announced the general availability of its Security Copilot, an AI assistant designed to augment cybersecurity professionals' capabilities in threat detection and response.
  • In January, 2025, the Indian government approved the IndiaAI Mission, a national program with a substantial budget to build a robust domestic AI ecosystem through public-private partnerships.
  • In March, 2025, NVIDIA announced its Blackwell architecture, a next-generation platform promising a significant performance increase for AI training and inference workloads, driving the next wave of infrastructure upgrades.

Dive into Technavio’s robust research methodology, blending expert interviews, extensive data synthesis, and validated models for unparalleled AI Services Market insights. See full methodology.

Market Scope
Page number 295
Base year 2024
Historic period 2019-2023
Forecast period 2025-2029
Growth momentum & CAGR Accelerate at a CAGR of 43.3%
Market growth 2025-2029 USD 112948.6 million
Market structure Fragmented
YoY growth 2024-2025(%) 34.5%
Key countries US, Canada, Mexico, China, Japan, India, Australia, South Korea, Indonesia, Germany, UK, France, The Netherlands, Italy, Spain, Brazil, Argentina, Colombia, Saudi Arabia, UAE, South Africa, Israel and Turkey
Competitive landscape Leading Companies, Market Positioning of Companies, Competitive Strategies, and Industry Risks

Request Free Sample

Research Analyst Overview

  • The AI services market is defined by a rapid shift from theoretical applications to practical, value-driven deployments. The proliferation of generative ai systems and large language models (llms) is compelling boardrooms to re-evaluate digital strategies, moving beyond simple ai-driven process automation to full-scale transformation.
  • A key boardroom focus is on ai governance frameworks and ai ethics and compliance to navigate risks. This evolution is enabled by a tiered technology stack, starting with ai infrastructure management and the choice between ai infrastructure as a service (iaas) and building on custom silicon accelerators.
  • On top of this, cloud-based ai platforms offer ai platform as a service (paas) for bespoke ai model development and ai model fine-tuning. Machine learning operations (mlops) are critical for managing the lifecycle of predictive analytics models and natural language processing (nlp) applications.
  • End-user solutions, delivered as ai software as a service (saas), range from conversational ai platforms to verticalized ai solutions for ai-powered drug discovery and algorithmic trading systems. Businesses are implementing ai-driven hyper-personalization and automated quality control using computer vision systems. This creates a need for managed ai services, ai readiness assessment, and prompt engineering techniques to build stateful ai assistants.
  • Security, addressed through data poisoning mitigation and model evasion defense, is paramount, as is the demand for explainable ai (xai). This integration, seen in ai-powered digital twins and ai-driven supply chain optimization, leads to tangible outcomes, with some firms achieving a 20% improvement in forecast accuracy.
  • The market is maturing towards autonomous systems integration supported by federated learning models and data lakehouse architecture for ai workload optimization.

What are the Key Data Covered in this AI Services Market Research and Growth Report?

  • What is the expected growth of the AI Services Market between 2025 and 2029?

    • USD 112.95 billion, at a CAGR of 43.3%

  • What segmentation does the market report cover?

    • The report is segmented by Organization Size (Large enterprises, SMEs), Type (Software as a service, Platform as a service, Infrastructure as a service), End-user (Healthcare, BFSI, Retail, Manufacturing, Transportation) and Geography (North America, APAC, Europe, South America, Middle East and Africa)

  • Which regions are analyzed in the report?

    • North America, APAC, Europe, South America and Middle East and Africa

  • What are the key growth drivers and market challenges?

    • Proliferation of generative AI and large language models, Navigating evolving and fragmented regulatory landscape

  • Who are the major players in the AI Services Market?

    • Amazon.com Inc., Anthropic, Apple Inc., Baidu Inc., Cohere, Crusoe Energy Systems LLC, Databricks Inc., DeepL SE, Eleven Labs Inc., Glean Technologies Inc., Google LLC, Hugging Face, IBM Corp., Lambda Inc., Microsoft Corp., Mistral AI, OpenAI, Stability AI and Tencent Holdings Ltd.

Market Research Insights

  • The AI services market is characterized by a rapid shift toward strategic ai implementation that delivers measurable business outcomes. A focus on ai for operational efficiency is paramount, with deployments in manufacturing yielding an 18% reduction in unplanned downtime through predictive maintenance.
  • Enterprises are increasingly adopting a human-centric ai design for ai-powered customer service solutions, which has improved customer satisfaction scores by over 25%. Data monetization with ai is another key dynamic, where data-driven decision making is enhanced by sophisticated analytical models.
  • The move toward responsible ai deployment is shaping procurement criteria, as organizations seek trustworthy ai systems that comply with emerging regulations. This is driving demand for ai solution customization and cloud ai service integration to ensure both performance and governance.

We can help! Our analysts can customize this ai services market research report to meet your requirements.

Get in touch

1. Executive Summary

1.1 Market overview

Executive Summary - Chart on Market Overview
Executive Summary - Data Table on Market Overview
Executive Summary - Chart on Global Market Characteristics
Executive Summary - Chart on Market by Geography
Executive Summary - Chart on Market Segmentation by Organization Size
Executive Summary - Chart on Market Segmentation by Type
Executive Summary - Chart on Market Segmentation by End-user
Executive Summary - Chart on Incremental Growth
Executive Summary - Data Table on Incremental Growth
Executive Summary - Chart on Company Market Positioning

2. Technavio Analysis

2.1 Analysis of price sensitivity, lifecycle, customer purchase basket, adoption rates, and purchase criteria

2.2 Criticality of inputs and Factors of differentiation

Chart on Overview on criticality of inputs and factors of differentiation

2.3 Factors of disruption

Chart on Overview on factors of disruption

2.4 Impact of drivers and challenges

Chart on Impact of drivers and challenges in 2024 and 2029

3. Market Landscape

3.1 Market ecosystem

Chart on Parent Market
Data Table on - Parent Market

3.2 Market characteristics

Chart on Market characteristics analysis

3.3 Value chain analysis

Chart on Value chain analysis

4. Market Sizing

4.1 Market definition

Data Table on Offerings of companies included in the market definition

4.2 Market segment analysis

Market segments

4.3 Market size 2024

4.4 Market outlook: Forecast for 2024-2029

Chart on Global - Market size and forecast 2024-2029 ($ million)
Data Table on Global - Market size and forecast 2024-2029 ($ million)
Chart on Global Market: Year-over-year growth 2024-2029 (%)
Data Table on Global Market: Year-over-year growth 2024-2029 (%)

5. Historic Market Size

5.1 Global AI Services Market 2019 - 2023

Historic Market Size - Data Table on Global AI Services Market 2019 - 2023 ($ million)

5.2 Organization Size segment analysis 2019 - 2023

Historic Market Size - Organization Size Segment 2019 - 2023 ($ million)

5.3 Type segment analysis 2019 - 2023

Historic Market Size - Type Segment 2019 - 2023 ($ million)

5.4 End-user segment analysis 2019 - 2023

Historic Market Size - End-user Segment 2019 - 2023 ($ million)

5.5 Geography segment analysis 2019 - 2023

Historic Market Size - Geography Segment 2019 - 2023 ($ million)

5.6 Country segment analysis 2019 - 2023

Historic Market Size - Country Segment 2019 - 2023 ($ million)

6. Five Forces Analysis

6.1 Five forces summary

Five forces analysis - Comparison between 2024 and 2029

6.2 Bargaining power of buyers

Bargaining power of buyers - Impact of key factors 2024 and 2029

6.3 Bargaining power of suppliers

Bargaining power of suppliers - Impact of key factors in 2024 and 2029

6.4 Threat of new entrants

Threat of new entrants - Impact of key factors in 2024 and 2029

6.5 Threat of substitutes

Threat of substitutes - Impact of key factors in 2024 and 2029

6.6 Threat of rivalry

Threat of rivalry - Impact of key factors in 2024 and 2029

6.7 Market condition

Chart on Market condition - Five forces 2024 and 2029

7. Market Segmentation by Organization Size

7.1 Market segments

Chart on Market Segmentation by Organization Size - Market share 2024-2029 (%)
Data Table on Market Segmentation by Organization Size - Market share 2024-2029 (%)

7.2 Comparison by Market Segmentation by Organization Size

Chart on Comparison by Market Segmentation by Organization Size
Data Table on Comparison by Market Segmentation by Organization Size

7.3 Large enterprises - Market size and forecast 2024-2029

Chart on Large enterprises - Market size and forecast 2024-2029 ($ million)
Data Table on Large enterprises - Market size and forecast 2024-2029 ($ million)
Chart on Large enterprises - Year-over-year growth 2024-2029 (%)
Data Table on Large enterprises - Year-over-year growth 2024-2029 (%)

7.4 SMEs - Market size and forecast 2024-2029

Chart on SMEs - Market size and forecast 2024-2029 ($ million)
Data Table on SMEs - Market size and forecast 2024-2029 ($ million)
Chart on SMEs - Year-over-year growth 2024-2029 (%)
Data Table on SMEs - Year-over-year growth 2024-2029 (%)

7.5 Market opportunity by Market Segmentation by Organization Size

Market opportunity by Market Segmentation by Organization Size ($ million)
Data Table on Market opportunity by Market Segmentation by Organization Size ($ million)

8. Market Segmentation by Type

8.1 Market segments

Chart on Type - Market share 2024-2029 (%)
Data Table on Type - Market share 2024-2029 (%)

8.2 Comparison by Type

Chart on Comparison by Type
Data Table on Comparison by Type

8.3 Software as a service - Market size and forecast 2024-2029

Chart on Software as a service - Market size and forecast 2024-2029 ($ million)
Data Table on Software as a service - Market size and forecast 2024-2029 ($ million)
Chart on Software as a service - Year-over-year growth 2024-2029 (%)
Data Table on Software as a service - Year-over-year growth 2024-2029 (%)

8.4 Platform as a service - Market size and forecast 2024-2029

Chart on Platform as a service - Market size and forecast 2024-2029 ($ million)
Data Table on Platform as a service - Market size and forecast 2024-2029 ($ million)
Chart on Platform as a service - Year-over-year growth 2024-2029 (%)
Data Table on Platform as a service - Year-over-year growth 2024-2029 (%)

8.5 Infrastructure as a service - Market size and forecast 2024-2029

Chart on Infrastructure as a service - Market size and forecast 2024-2029 ($ million)
Data Table on Infrastructure as a service - Market size and forecast 2024-2029 ($ million)
Chart on Infrastructure as a service - Year-over-year growth 2024-2029 (%)
Data Table on Infrastructure as a service - Year-over-year growth 2024-2029 (%)

8.6 Market opportunity by Type

Market opportunity by Type ($ million)
Data Table on Market opportunity by Type ($ million)

9. Market Segmentation by End-user

9.1 Market segments

Chart on End-user - Market share 2024-2029 (%)
Data Table on End-user - Market share 2024-2029 (%)

9.2 Comparison by End-user

Chart on Comparison by End-user
Data Table on Comparison by End-user

9.3 Healthcare - Market size and forecast 2024-2029

Chart on Healthcare - Market size and forecast 2024-2029 ($ million)
Data Table on Healthcare - Market size and forecast 2024-2029 ($ million)
Chart on Healthcare - Year-over-year growth 2024-2029 (%)
Data Table on Healthcare - Year-over-year growth 2024-2029 (%)

9.4 BFSI - Market size and forecast 2024-2029

Chart on BFSI - Market size and forecast 2024-2029 ($ million)
Data Table on BFSI - Market size and forecast 2024-2029 ($ million)
Chart on BFSI - Year-over-year growth 2024-2029 (%)
Data Table on BFSI - Year-over-year growth 2024-2029 (%)

9.5 Retail - Market size and forecast 2024-2029

Chart on Retail - Market size and forecast 2024-2029 ($ million)
Data Table on Retail - Market size and forecast 2024-2029 ($ million)
Chart on Retail - Year-over-year growth 2024-2029 (%)
Data Table on Retail - Year-over-year growth 2024-2029 (%)

9.6 Manufacturing - Market size and forecast 2024-2029

Chart on Manufacturing - Market size and forecast 2024-2029 ($ million)
Data Table on Manufacturing - Market size and forecast 2024-2029 ($ million)
Chart on Manufacturing - Year-over-year growth 2024-2029 (%)
Data Table on Manufacturing - Year-over-year growth 2024-2029 (%)

9.7 Transportation - Market size and forecast 2024-2029

Chart on Transportation - Market size and forecast 2024-2029 ($ million)
Data Table on Transportation - Market size and forecast 2024-2029 ($ million)
Chart on Transportation - Year-over-year growth 2024-2029 (%)
Data Table on Transportation - Year-over-year growth 2024-2029 (%)

9.8 Market opportunity by End-user

Market opportunity by End-user ($ million)
Data Table on Market opportunity by End-user ($ million)

10. Customer Landscape

10.1 Customer landscape overview

Analysis of price sensitivity, lifecycle, customer purchase basket, adoption rates, and purchase criteria

11. Geographic Landscape

11.1 Geographic segmentation

Chart on Market share by geography 2024-2029 (%)
Data Table on Market share by geography 2024-2029 (%)

11.2 Geographic comparison

Chart on Geographic comparison
Data Table on Geographic comparison

11.3 North America - Market size and forecast 2024-2029

Chart on North America - Market size and forecast 2024-2029 ($ million)
Data Table on North America - Market size and forecast 2024-2029 ($ million)
Chart on North America - Year-over-year growth 2024-2029 (%)
Data Table on North America - Year-over-year growth 2024-2029 (%)
Chart on Regional Comparison - North America
Data Table on Regional Comparison - North America

11.3.1 US - Market size and forecast 2024-2029

Chart on US - Market size and forecast 2024-2029 ($ million)
Data Table on US - Market size and forecast 2024-2029 ($ million)
Chart on US - Year-over-year growth 2024-2029 (%)
Data Table on US - Year-over-year growth 2024-2029 (%)

11.3.2 Canada - Market size and forecast 2024-2029

Chart on Canada - Market size and forecast 2024-2029 ($ million)
Data Table on Canada - Market size and forecast 2024-2029 ($ million)
Chart on Canada - Year-over-year growth 2024-2029 (%)
Data Table on Canada - Year-over-year growth 2024-2029 (%)

11.3.3 Mexico - Market size and forecast 2024-2029

Chart on Mexico - Market size and forecast 2024-2029 ($ million)
Data Table on Mexico - Market size and forecast 2024-2029 ($ million)
Chart on Mexico - Year-over-year growth 2024-2029 (%)
Data Table on Mexico - Year-over-year growth 2024-2029 (%)

11.4 APAC - Market size and forecast 2024-2029

Chart on APAC - Market size and forecast 2024-2029 ($ million)
Data Table on APAC - Market size and forecast 2024-2029 ($ million)
Chart on APAC - Year-over-year growth 2024-2029 (%)
Data Table on APAC - Year-over-year growth 2024-2029 (%)
Chart on Regional Comparison - APAC
Data Table on Regional Comparison - APAC

11.4.1 China - Market size and forecast 2024-2029

Chart on China - Market size and forecast 2024-2029 ($ million)
Data Table on China - Market size and forecast 2024-2029 ($ million)
Chart on China - Year-over-year growth 2024-2029 (%)
Data Table on China - Year-over-year growth 2024-2029 (%)

11.4.2 Japan - Market size and forecast 2024-2029

Chart on Japan - Market size and forecast 2024-2029 ($ million)
Data Table on Japan - Market size and forecast 2024-2029 ($ million)
Chart on Japan - Year-over-year growth 2024-2029 (%)
Data Table on Japan - Year-over-year growth 2024-2029 (%)

11.4.3 India - Market size and forecast 2024-2029

Chart on India - Market size and forecast 2024-2029 ($ million)
Data Table on India - Market size and forecast 2024-2029 ($ million)
Chart on India - Year-over-year growth 2024-2029 (%)
Data Table on India - Year-over-year growth 2024-2029 (%)

11.4.4 Australia - Market size and forecast 2024-2029

Chart on Australia - Market size and forecast 2024-2029 ($ million)
Data Table on Australia - Market size and forecast 2024-2029 ($ million)
Chart on Australia - Year-over-year growth 2024-2029 (%)
Data Table on Australia - Year-over-year growth 2024-2029 (%)

11.4.5 South Korea - Market size and forecast 2024-2029

Chart on South Korea - Market size and forecast 2024-2029 ($ million)
Data Table on South Korea - Market size and forecast 2024-2029 ($ million)
Chart on South Korea - Year-over-year growth 2024-2029 (%)
Data Table on South Korea - Year-over-year growth 2024-2029 (%)

11.4.6 Indonesia - Market size and forecast 2024-2029

Chart on Indonesia - Market size and forecast 2024-2029 ($ million)
Data Table on Indonesia - Market size and forecast 2024-2029 ($ million)
Chart on Indonesia - Year-over-year growth 2024-2029 (%)
Data Table on Indonesia - Year-over-year growth 2024-2029 (%)

11.5 Europe - Market size and forecast 2024-2029

Chart on Europe - Market size and forecast 2024-2029 ($ million)
Data Table on Europe - Market size and forecast 2024-2029 ($ million)
Chart on Europe - Year-over-year growth 2024-2029 (%)
Data Table on Europe - Year-over-year growth 2024-2029 (%)
Chart on Regional Comparison - Europe
Data Table on Regional Comparison - Europe

11.5.1 Germany - Market size and forecast 2024-2029

Chart on Germany - Market size and forecast 2024-2029 ($ million)
Data Table on Germany - Market size and forecast 2024-2029 ($ million)
Chart on Germany - Year-over-year growth 2024-2029 (%)
Data Table on Germany - Year-over-year growth 2024-2029 (%)

11.5.2 UK - Market size and forecast 2024-2029

Chart on UK - Market size and forecast 2024-2029 ($ million)
Data Table on UK - Market size and forecast 2024-2029 ($ million)
Chart on UK - Year-over-year growth 2024-2029 (%)
Data Table on UK - Year-over-year growth 2024-2029 (%)

11.5.3 France - Market size and forecast 2024-2029

Chart on France - Market size and forecast 2024-2029 ($ million)
Data Table on France - Market size and forecast 2024-2029 ($ million)
Chart on France - Year-over-year growth 2024-2029 (%)
Data Table on France - Year-over-year growth 2024-2029 (%)

11.5.4 The Netherlands - Market size and forecast 2024-2029

Chart on The Netherlands - Market size and forecast 2024-2029 ($ million)
Data Table on The Netherlands - Market size and forecast 2024-2029 ($ million)
Chart on The Netherlands - Year-over-year growth 2024-2029 (%)
Data Table on The Netherlands - Year-over-year growth 2024-2029 (%)

11.5.5 Italy - Market size and forecast 2024-2029

Chart on Italy - Market size and forecast 2024-2029 ($ million)
Data Table on Italy - Market size and forecast 2024-2029 ($ million)
Chart on Italy - Year-over-year growth 2024-2029 (%)
Data Table on Italy - Year-over-year growth 2024-2029 (%)

11.5.6 Spain - Market size and forecast 2024-2029

Chart on Spain - Market size and forecast 2024-2029 ($ million)
Data Table on Spain - Market size and forecast 2024-2029 ($ million)
Chart on Spain - Year-over-year growth 2024-2029 (%)
Data Table on Spain - Year-over-year growth 2024-2029 (%)

11.6 South America - Market size and forecast 2024-2029

Chart on South America - Market size and forecast 2024-2029 ($ million)
Data Table on South America - Market size and forecast 2024-2029 ($ million)
Chart on South America - Year-over-year growth 2024-2029 (%)
Data Table on South America - Year-over-year growth 2024-2029 (%)
Chart on Regional Comparison - South America
Data Table on Regional Comparison - South America

11.6.1 Brazil - Market size and forecast 2024-2029

Chart on Brazil - Market size and forecast 2024-2029 ($ million)
Data Table on Brazil - Market size and forecast 2024-2029 ($ million)
Chart on Brazil - Year-over-year growth 2024-2029 (%)
Data Table on Brazil - Year-over-year growth 2024-2029 (%)

11.6.2 Argentina - Market size and forecast 2024-2029

Chart on Argentina - Market size and forecast 2024-2029 ($ million)
Data Table on Argentina - Market size and forecast 2024-2029 ($ million)
Chart on Argentina - Year-over-year growth 2024-2029 (%)
Data Table on Argentina - Year-over-year growth 2024-2029 (%)

11.6.3 Colombia - Market size and forecast 2024-2029

Chart on Colombia - Market size and forecast 2024-2029 ($ million)
Data Table on Colombia - Market size and forecast 2024-2029 ($ million)
Chart on Colombia - Year-over-year growth 2024-2029 (%)
Data Table on Colombia - Year-over-year growth 2024-2029 (%)

11.7 Middle East and Africa - Market size and forecast 2024-2029

Chart on Middle East and Africa - Market size and forecast 2024-2029 ($ million)
Data Table on Middle East and Africa - Market size and forecast 2024-2029 ($ million)
Chart on Middle East and Africa - Year-over-year growth 2024-2029 (%)
Data Table on Middle East and Africa - Year-over-year growth 2024-2029 (%)
Chart on Regional Comparison - Middle East and Africa
Data Table on Regional Comparison - Middle East and Africa

11.7.1 Saudi Arabia - Market size and forecast 2024-2029

Chart on Saudi Arabia - Market size and forecast 2024-2029 ($ million)
Data Table on Saudi Arabia - Market size and forecast 2024-2029 ($ million)
Chart on Saudi Arabia - Year-over-year growth 2024-2029 (%)
Data Table on Saudi Arabia - Year-over-year growth 2024-2029 (%)

11.7.2 UAE - Market size and forecast 2024-2029

Chart on UAE - Market size and forecast 2024-2029 ($ million)
Data Table on UAE - Market size and forecast 2024-2029 ($ million)
Chart on UAE - Year-over-year growth 2024-2029 (%)
Data Table on UAE - Year-over-year growth 2024-2029 (%)

11.7.3 South Africa - Market size and forecast 2024-2029

Chart on South Africa - Market size and forecast 2024-2029 ($ million)
Data Table on South Africa - Market size and forecast 2024-2029 ($ million)
Chart on South Africa - Year-over-year growth 2024-2029 (%)
Data Table on South Africa - Year-over-year growth 2024-2029 (%)

11.7.4 Israel - Market size and forecast 2024-2029

Chart on Israel - Market size and forecast 2024-2029 ($ million)
Data Table on Israel - Market size and forecast 2024-2029 ($ million)
Chart on Israel - Year-over-year growth 2024-2029 (%)
Data Table on Israel - Year-over-year growth 2024-2029 (%)

11.7.5 Turkey - Market size and forecast 2024-2029

Chart on Turkey - Market size and forecast 2024-2029 ($ million)
Data Table on Turkey - Market size and forecast 2024-2029 ($ million)
Chart on Turkey - Year-over-year growth 2024-2029 (%)
Data Table on Turkey - Year-over-year growth 2024-2029 (%)

11.8 Market opportunity by geography

Market opportunity by geography ($ million)
Data Tables on Market opportunity by geography ($ million)

12. Drivers, Challenges, and Opportunity

12.1 Market drivers

Proliferation of generative AI and large language models
Increasing enterprise adoption for business process optimization
Advancements in AI infrastructure and cloud computing

12.2 Market challenges

Navigating evolving and fragmented regulatory landscape
Acute talent scarcity and escalating implementation costs
Pervasive data quality, security, and integration hurdles

12.3 Impact of drivers and challenges

Impact of drivers and challenges in 2024 and 2029

12.4 Market opportunities

Proliferation of generative AI and enterprise adoption
Intensified focus on data monetization and operational efficiency
Demand for verticalized AI and specialized industry solutions

13. Competitive Landscape

13.1 Overview

13.2

Overview on criticality of inputs and factors of differentiation

13.3 Landscape disruption

Overview on factors of disruption

13.4 Industry risks

Impact of key risks on business

14. Competitive Analysis

14.1 Companies profiled

Companies covered

14.2 Company ranking index

14.3 Market positioning of companies

Matrix on companies position and classification

14.4 Amazon.com Inc.

Amazon.com Inc. - Overview
Amazon.com Inc. - Business segments
Amazon.com Inc. - Key news
Amazon.com Inc. - Key offerings
Amazon.com Inc. - Segment focus
SWOT

14.5 Anthropic

Anthropic - Overview
Anthropic - Product / Service
Anthropic - Key offerings
SWOT

14.6 Apple Inc.

Apple Inc. - Overview
Apple Inc. - Business segments
Apple Inc. - Key news
Apple Inc. - Key offerings
Apple Inc. - Segment focus
SWOT

14.7 Baidu Inc.

Baidu Inc. - Overview
Baidu Inc. - Business segments
Baidu Inc. - Key offerings
Baidu Inc. - Segment focus
SWOT

14.8 Cohere

Cohere - Overview
Cohere - Product / Service
Cohere - Key offerings
SWOT

14.9 Databricks Inc.

Databricks Inc. - Overview
Databricks Inc. - Product / Service
Databricks Inc. - Key offerings
SWOT

14.10 DeepL SE

DeepL SE - Overview
DeepL SE - Product / Service
DeepL SE - Key offerings
SWOT

14.11 Google LLC

Google LLC - Overview
Google LLC - Product / Service
Google LLC - Key offerings
SWOT

14.12 IBM Corp.

IBM Corp. - Overview
IBM Corp. - Business segments
IBM Corp. - Key news
IBM Corp. - Key offerings
IBM Corp. - Segment focus
SWOT

14.13 Lambda Inc.

Lambda Inc. - Overview
Lambda Inc. - Product / Service
Lambda Inc. - Key offerings
SWOT

14.14 Microsoft Corp.

Microsoft Corp. - Overview
Microsoft Corp. - Business segments
Microsoft Corp. - Key news
Microsoft Corp. - Key offerings
Microsoft Corp. - Segment focus
SWOT

14.15 OpenAI

OpenAI - Overview
OpenAI - Product / Service
OpenAI - Key offerings
SWOT

14.16 Stability AI

Stability AI - Overview
Stability AI - Product / Service
Stability AI - Key offerings
SWOT

14.17 Tencent Holdings Ltd.

Tencent Holdings Ltd. - Overview
Tencent Holdings Ltd. - Business segments
Tencent Holdings Ltd. - Key news
Tencent Holdings Ltd. - Key offerings
Tencent Holdings Ltd. - Segment focus
SWOT

15. Appendix

15.1 Scope of the report

Market definition
Objectives
Notes and caveats

15.2 Inclusions and exclusions checklist

Inclusions checklist
Exclusions checklist

15.3 Currency conversion rates for US$

15.4 Research methodology

15.5 Data procurement

Information sources

15.6 Data validation

15.7 Validation techniques employed for market sizing

15.8 Data synthesis

15.9 360 degree market analysis

15.10 List of abbreviations

Research Methodology

Technavio presents a detailed picture of the market by way of study, synthesis, and summation of data from multiple sources. The analysts have presented the various facets of the market with a particular focus on identifying the key industry influencers. The data thus presented is comprehensive, reliable, and the result of extensive research, both primary and secondary.

INFORMATION SOURCES

Primary sources

  • Manufacturers and suppliers
  • Channel partners
  • Industry experts
  • Strategic decision makers

Secondary sources

  • Industry journals and periodicals
  • Government data
  • Financial reports of key industry players
  • Historical data
  • Press releases

DATA ANALYSIS

Data Synthesis

  • Collation of data
  • Estimation of key figures
  • Analysis of derived insights

Data Validation

  • Triangulation with data models
  • Reference against proprietary databases
  • Corroboration with industry experts

REPORT WRITING

Qualitative

  • Market drivers
  • Market challenges
  • Market trends
  • Five forces analysis

Quantitative

  • Market size and forecast
  • Market segmentation
  • Geographical insights
  • Competitive landscape

Interested in this report?

Get your sample now to see our research methodology and insights!

Download Now

Frequently Asked Questions

AI Services market growth will increase by USD 112948.6 million during 2025-2029.

The AI Services market is expected to grow at a CAGR of 43.3% during 2025-2029.

AI Services market is segmented by Organization size (Large enterprises, SMEs) Type (Software as a service, Platform as a service, Infrastructure as a service) End-user (Healthcare, BFSI, Retail, Manufacturing, Transportation)

Amazon.com Inc., Anthropic, Apple Inc., Baidu Inc., Cohere, Crusoe Energy Systems LLC, Databricks Inc., DeepL SE, Eleven Labs Inc., Glean Technologies Inc., Google LLC, Hugging Face, IBM Corp., Lambda Inc., Microsoft Corp., Mistral AI, OpenAI, Stability AI, Tencent Holdings Ltd. are a few of the key vendors in the AI Services market.

North America will register the highest growth rate of 37.2% among the other regions. Therefore, the AI Services market in North America is expected to garner significant business opportunities for the vendors during the forecast period.

US, Canada, Mexico, China, Japan, India, Australia, South Korea, Indonesia, Germany, UK, France, The Netherlands, Italy, Spain, Brazil, Argentina, Colombia, Saudi Arabia, UAE, South Africa, Israel, Turkey

  • Proliferation of generative AI and large language models is the driving factor this market.

The AI Services market vendors should focus on grabbing business opportunities from the Organization size segment as it accounted for the largest market share in the base year.