Alcohol Infused Sparkling Water Market Analysis, Size, and Forecast 2024-2028: North America (US and Canada), Europe (France, Germany, Italy, and UK), Middle East and Africa (Egypt, KSA, Oman, and UAE), APAC (China, India, and Japan), South America (Argentina and Brazil), and Rest of World (ROW)

Alcohol Infused Sparkling Water Market Analysis, Size, and Forecast 2024-2028:
North America (US and Canada), Europe (France, Germany, Italy, and UK), Middle East and Africa (Egypt, KSA, Oman, and UAE), APAC (China, India, and Japan), South America (Argentina and Brazil), and Rest of World (ROW)

Published: Feb 2024 158 Pages SKU: IRTNTR70121

Market Overview at a Glance

$714.39 Mn
Market Opportunity
14.12%
CAGR
12.92
YoY growth 2023-2024(%)

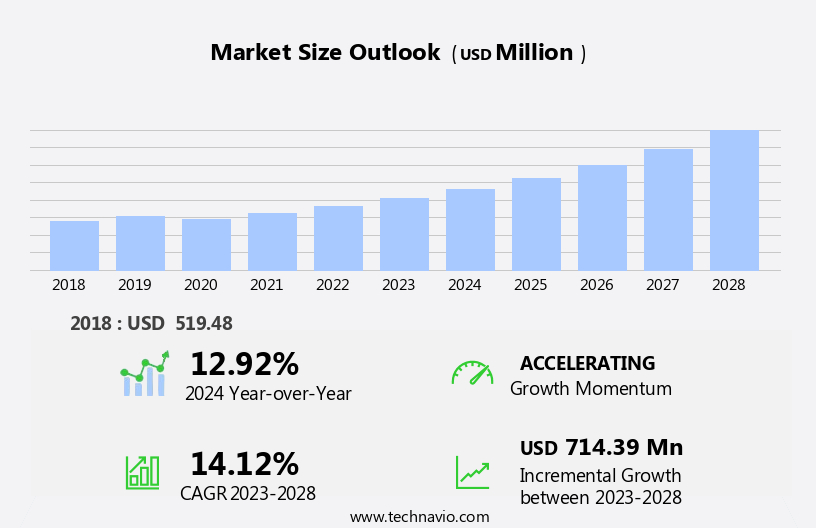
Alcohol Infused Sparkling Water Market Size 2024-2028

The alcohol infused sparkling water market size is forecast to increase by USD 714.39 million at a CAGR of 14.12% between 2023 and 2028.

  • The market is experiencing significant growth, driven primarily by the rising demand for low-calorie alcoholic beverages. Consumers are increasingly seeking healthier alternatives to traditional alcoholic drinks, and alcoholic sparkling water offers a solution with fewer calories and added health benefits from the infusion of real fruits. However, this market faces challenges as well. One major obstacle is the ongoing campaigns against alcohol consumption, which may deter some consumers from purchasing these products. Despite this, companies can capitalize on the market's opportunities by focusing on innovation and differentiation. For instance, offering unique fruit flavors or low-alcohol content could attract health-conscious consumers looking for a refreshing and socially acceptable beverage option.
  • In conclusion, the market is poised for growth, with the increasing preference for low-calorie beverages and the use of real fruits as key drivers. However, companies must navigate the challenge of negative perceptions surrounding alcohol consumption to effectively tap into this market.

What will be the Size of the Alcohol Infused Sparkling Water Market during the forecast period?

Alcohol Infused Sparkling Water Market Size

 Request Free Sample

  • The alcohol-infused sparkling water market continues to evolve, with various sectors adopting this innovative beverage category. Sustainable packaging is a growing concern, as Gen Z consumers demand eco-friendly solutions. Distribution channels expand, with online retailers and convenience stores joining traditional retail outlets. Alcohol infusion varies from subtle to strong, catering to diverse consumer preferences. Natural flavors and taste profiles, including fruit and botanical extracts, add to the product differentiation. Craft cocktails and canned cocktails offer a convenient solution for off-premise consumption, while cocktail mixers and subscription services provide a personalized experience. Premium spirits and wine spritzers appeal to the health-conscious and socially active.
  • Product innovation is key, with functional beverages and spirit-based options entering the market. Brand positioning is crucial, as companies navigate alcohol regulations and consumer trends. Price sensitivity and brand loyalty influence purchasing decisions. Social media marketing and influencer partnerships shape consumer perception. Innovation pipelines remain robust, with digital marketing and sensory evaluation playing essential roles. The market research reveals a dynamic landscape, with on-premise consumption and bars and restaurants adapting to the trend. Consumer insights indicate a shift towards lower sugar content and a focus on lifestyle trends. The continuous unfolding of market activities underscores the importance of staying attuned to evolving patterns and consumer preferences.

How is this Alcohol Infused Sparkling Water Industry segmented?

The alcohol infused sparkling water industry research report provides comprehensive data (region-wise segment analysis), with forecasts and estimates in "USD million" for the period 2024-2028, as well as historical data from 2018-2022 for the following segments.

  • Distribution Channel
    • Off-premises
    • On-premises
  • Packaging
    • Canned
    • Bottled
  • Product Type
    • Low Alcohol
    • Zero Alcohol
  • Flavor
    • Fruit-Based
    • Herbal
    • Spiced
  • Geography
    • North America
      • US
      • Canada
    • Europe
      • France
      • Germany
      • Italy
      • UK
    • Middle East and Africa
      • Egypt
      • KSA
      • Oman
      • UAE
    • APAC
      • China
      • India
      • Japan
    • South America
      • Argentina
      • Brazil
    • Rest of World (ROW)

By Distribution Channel Insights

The off-premises segment is estimated to witness significant growth during the forecast period.

Alcoholic infused sparkling water has gained significant traction in the beverage market, particularly among young adults and health-conscious consumers. This category of beverages offers a unique blend of natural flavors, alcohol infusion, and carbonation, catering to various taste preferences. The distribution channels for these beverages include retail outlets, convenience stores, and online retailers. Retail outlets such as supermarkets and hypermarkets, like Tesco Plc, Carrefour SA, and Target Brands, provide a wide range of options for consumers. The rise of online sales, driven by the increasing penetration of the Internet, has further expanded distribution channels for these beverages.

Natural fruit flavors and botanical extracts are popular choices for alcoholic infused sparkling water, aligning with the health and wellness trend. Product differentiation and competitive advantage are key strategies for brands, with premium spirits and craft cocktail inspirations setting them apart. Canned cocktails and cocktail mixers are also gaining popularity for their convenience and portability. Subscription services offer regular deliveries, enhancing brand loyalty and customer engagement. Off-premise consumption, including social drinking and lifestyle trends, has contributed to the growth of alcoholic infused sparkling water. However, regulations regarding alcohol content and marketing campaigns require careful brand positioning.

Innovation pipelines include wine spritzers, hard seltzers, and functional beverages. Price sensitivity and packaging design are crucial factors influencing consumer decisions. Social media marketing and influencer collaborations are effective marketing strategies for reaching Gen Z audiences. Innovation continues to drive the market, with sensory evaluation playing a significant role in product development. Brands are focusing on product innovation, including new flavor profiles and lower sugar content, to cater to evolving consumer preferences. Bars and restaurants are also incorporating alcoholic infused sparkling water into their menus, further expanding the market. Grocery stores and spirit-based beverage retailers are key retail channels, offering a wide range of options for consumers.

Alcohol Infused Sparkling Water Market Size

Request Free Sample

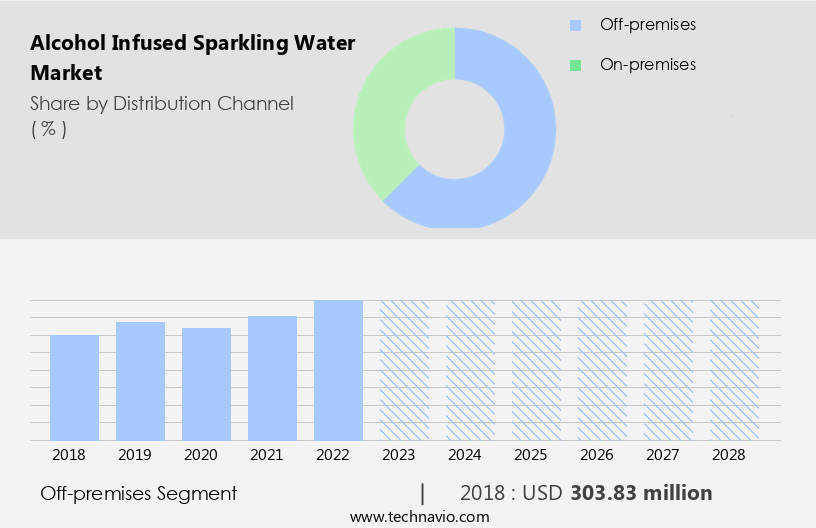
The Off-premises segment was valued at USD 303.83 million in 2018 and showed a gradual increase during the forecast period.

Regional Analysis

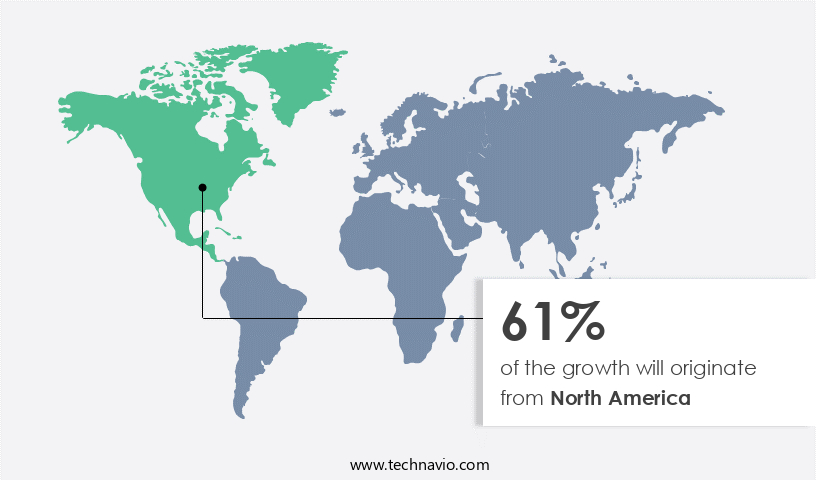
North America is estimated to contribute 61% to the growth of the global market during the forecast period.Technavio's analysts have elaborately explained the regional trends and drivers that shape the market during the forecast period.

Alcohol Infused Sparkling Water Market Share by Geography

 Request Free Sample

The alcoholic infused sparkling water market in North America is experiencing significant growth, particularly in the US, driven by shifting consumer demographics and preferences. Younger generations, including Gen Z, are increasingly seeking low-alcohol options for social drinking, aligning with health and wellness trends. This trend is fueled by the convenience of ordering through digital channels and the availability of major brewers such as AB InBev, Molson Coors, and Boston Beer. Natural flavors and taste profiles are key differentiators, with offerings ranging from fruit flavors to botanical extracts. Product innovation includes hard seltzers, canned cocktails, and cocktail mixers, as well as wine spritzers and spirit-based beverages.

Retail outlets, including convenience stores and grocery stores, cater to the demand, while bars and restaurants offer on-premise consumption. Subscription services and influencer marketing are effective strategies for reaching consumers. Alcohol regulations and sensory evaluation are crucial considerations for market entrants. The market research indicates a focus on product differentiation and competitive advantage, with premium spirits and functional beverages gaining popularity. Digital marketing and social media are essential tools for reaching consumers, while price sensitivity and packaging design remain key factors in brand positioning. Overall, the market is dynamic, with a strong innovation pipeline and a growing consumer base.

Market Dynamics

The Alcohol Infused Sparkling Water Market is booming with functional hard seltzers like probiotic-infused seltzers and vitamin-enriched seltzers, appealing to health-conscious consumers. Innovations such as AI-optimized flavor profiles, spicy jalapeño hard seltzer, and customizable seltzer flavors enhance social gatherings and casual dining. Eco-friendly canning, biodegradable packaging, and zero-waste production align with sustainable sourcing and blockchain-verified ingredients. Low-calorie hard seltzer and gluten-free hard seltzer cater to millennials and fitness enthusiasts, while augmented reality labels and smart can designs elevate branding. Subscription beverage services and premium hard seltzer brands drive online sales and nightclub appeal, with best hard seltzer suppliers delivering non-GMO seltzers and high-alcohol seltzer for festival beverages.

Our researchers analyzed the data with 2023 as the base year, along with the key drivers, trends, and challenges. A holistic analysis of drivers will help companies refine their marketing strategies to gain a competitive advantage.

What are the key market drivers leading to the rise in the adoption of Alcohol Infused Sparkling Water Industry?

  • The increasing preference for low-calorie alcoholic beverages is the primary market driver, as consumers seek healthier alternatives without compromising on their social drinking habits. 
  • The alcoholic beverage industry has seen a shift towards healthier and more convenient options, driving the growth of the market. Consumers are increasingly seeking low-calorie, low-carb, and gluten-free alternatives, leading breweries and manufacturers to introduce new natural flavors in their alcohol-infused sparkling water offerings. For instance, White Claw from Mark Anthony Group provides consumers with a range of natural flavors such as black cherry, raspberry, and natural lime, while keeping the carbohydrate count low at 2gm and the calorie count at 100 per 12oz serving with a 5% ABV. This trend is fueled by consumers' preference for healthier alcoholic beverages, growing awareness of the nutritional value of beverages, and the increasing popularity of moderation in drinking.
  • Distribution channels, including retail outlets, convenience stores, and subscription services, have expanded to cater to the rising demand for canned cocktails and cocktail mixers. The market dynamics are further influenced by the popularity of sustainable packaging and the appeal of craft cocktails, which align with the health-conscious and eco-conscious mindset of consumers, particularly among the Gen Z demographic. Overall, the market for alcohol infused sparkling water is expected to continue its growth trajectory as consumers seek out lighter, healthier, and more convenient alcoholic beverage options.

What are the market trends shaping the Alcohol Infused Sparkling Water Industry?

  • The use of real fruits in alcoholic seltzer beverages is gaining popularity as a market trend. This emerging trend reflects a growing consumer preference for natural and authentic ingredients in their alcoholic beverages.
  • The market for alcoholic sparkling water, a popular choice among health-conscious consumers seeking low-calorie and low-carb options, is experiencing significant growth. Beyond alcohol content, innovative flavors and natural ingredients are driving consumer interest. In response to increasing competition, companies are differentiating their offerings by introducing hard sparkling water with real fruits and no added sugars. For instance, Briggs Hard Seltzer launched three new products in 2018, including Briggs Hard Seltzer Pineapple and Briggs Hard Seltzer Grapefruit, all made with 100% real fruit, 5% alcohol, and no artificial flavors or preservatives. These product innovations provide a competitive advantage, catering to the evolving preferences of consumers in the health and wellness sector.
  • Market research indicates that off-premise consumption, particularly through online retailers, is on the rise for these beverages. Casual dining establishments are also embracing hard sparkling water, further expanding its reach. Influencer marketing and consumer insights continue to shape the market dynamics, making it an exciting space for growth in the health-conscious beverage industry.

What challenges does the Alcohol Infused Sparkling Water Industry face during its growth?

  • The growth of the industry is significantly impacted by campaigns advocating for reduced alcohol consumption. 
  • The alcoholic infused sparkling water market faces challenges due to growing consumer awareness and concerns regarding the health effects of alcohol, particularly among young adults. Social organizations in the US, such as the Substance Abuse and Mental Health Services Administration (SAMHSA), are launching campaigns to minimize underage drinking and substance use. SAMHSA's 'Talk. They Hear You.' initiative empowers parents and caregivers to educate children about the risks of alcohol and other substances. This trend reflects broader lifestyle trends towards healthier choices and increased focus on functional beverages. Brands in the market must effectively position themselves to appeal to this demographic, utilizing digital marketing strategies and innovative flavor profiles, including botanical extracts.
  • Alcohol regulations also impact market dynamics, necessitating careful brand positioning and value proposition development. Despite these challenges, the market continues to grow, driven by consumer trends towards social drinking and the appeal of sparkling water as a refreshing and lower-alcohol alternative to traditional alcoholic beverages.

Exclusive Customer Landscape

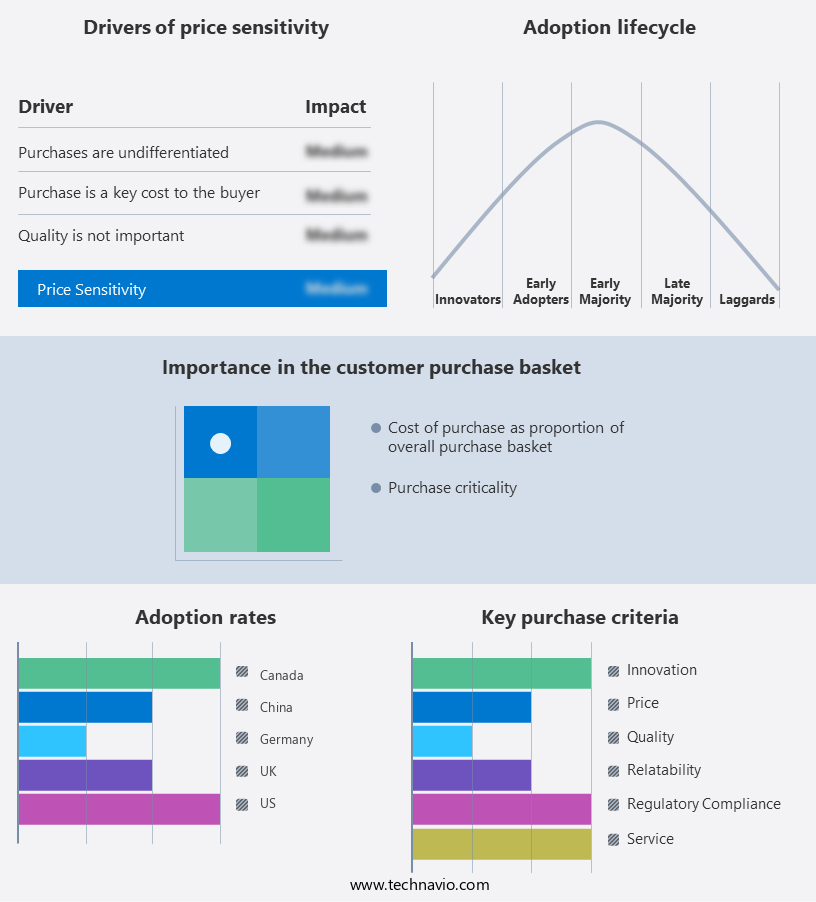
The alcohol infused sparkling water market forecasting report includes the adoption lifecycle of the market, covering from the innovator's stage to the laggard's stage. It focuses on adoption rates in different regions based on penetration. Furthermore, the alcohol infused sparkling water market report also includes key purchase criteria and drivers of price sensitivity to help companies evaluate and develop their market growth analysis strategies.

Alcohol Infused Sparkling Water Market Share by Geography

 Customer Landscape

Key Companies & Market Insights

Companies are implementing various strategies, such as strategic alliances, alcohol infused sparkling water market forecast, partnerships, mergers and acquisitions, geographical expansion, and product/service launches, to enhance their presence in the industry.

Anheuser-Busch InBev SA/NV - The company introduces a line of alcoholic sparkling water products, including organic hard seltzers, under its Michelob Ultra brand. These beverages offer a unique fusion of refreshment and alcohol content, appealing to health-conscious consumers seeking an alternative to traditional alcoholic beverages.

The industry research and growth report includes detailed analyses of the competitive landscape of the market and information about key companies, including:

  • Anheuser-Busch InBev SA/NV
  • Asahi Group Holdings Ltd.
  • Boston Beer Co. Inc.
  • Brown-Forman Corp.
  • Carlsberg A/S
  • Coca-Cola Co.
  • Constellation Brands Inc.
  • Diageo Plc
  • E. & J. Gallo Winery
  • Heineken NV
  • Kirin Holdings Co. Ltd.
  • Mark Anthony Brands
  • Molson Coors Beverage Co.
  • Naked Collective Ltd.
  • PepsiCo Inc.
  • Pernod Ricard SA
  • Phusion Projects LLC
  • Polar Beverages
  • Suntory Holdings Ltd.
  • White Claw Seltzer Works

Qualitative and quantitative analysis of companies has been conducted to help clients understand the wider business environment as well as the strengths and weaknesses of key industry players. Data is qualitatively analyzed to categorize companies as pure play, category-focused, industry-focused, and diversified; it is quantitatively analyzed to categorize companies as dominant, leading, strong, tentative, and weak.

Recent Development and News in Alcohol Infused Sparkling Water Market

  • In February 2024, major beverage company Anheuser-Busch InBev (AB InBev) announced the global launch of its new alcoholic sparkling water brand, Bon & Viv SpikedSeltzer, extending its market presence in the growing alcohol-infused beverage sector (Anheuser-Busch InBev press release). This strategic move aimed to cater to the increasing consumer preference for low-calorie, low-alcohol beverage options.
  • In October 2024, Molson Coors Beverage Company and Starbucks Corporation entered into a strategic partnership to produce and distribute Starbucks' new line of Hard Seltzer beverages, Starbucks Hard Seltzer, under the Molson Coors umbrella (Molson Coors Beverage Company press release). This collaboration combined the brand recognition of Starbucks with Molson Coors' expertise in brewing and distribution, targeting the expanding alcohol-infused beverage market.
  • In March 2025, Boston Beer Company, the leading craft brewer in the U.S., reported a significant investment of USD100 million to expand its production capacity for its Truly Hard Seltzer brand (Boston Beer Company SEC filing). This investment demonstrated the company's commitment to meeting the growing demand for alcohol-infused sparkling water and maintaining its market leadership.
  • In July 2024, the Alcohol and Tobacco Tax and Trade Bureau (TTB), the U.S. Regulatory agency responsible for alcohol, approved the labeling of White Claw's new Hard Seltzer product line, White Claw Hard Seltzer Surge, which contains higher alcohol content (TTB approval notice). This approval marked a significant shift in the market, as it expanded the offerings within the alcohol-infused sparkling water segment to cater to consumers seeking stronger beverage options.

Research Analyst Overview

The alcohol-infused sparkling water market showcases dynamic innovation, with taste perception playing a pivotal role in the development of new products. Brands employ infusion technology and various carbonation methods to create unique aroma profiles, catering to evolving consumer preferences. The industry trends favor aluminum cans due to their lightweight and recyclable nature, enhancing customer retention and brand awareness. Storage conditions are meticulously managed to preserve the sales performance and shelf life of these beverages. Non-alcoholic options continue to gain traction, as innovation roadmaps expand to include plant-based ingredients and alternative flavor compounds. Brand storytelling and product positioning are essential for growth strategies, targeting a diverse audience seeking healthier and more sophisticated alcohol alternatives.

The future of the market hinges on continued innovation, as companies explore new flavor extraction techniques and explore glass bottles for premium offerings. Consumer preferences for sustainable packaging materials also influence the use of eco-friendly materials in the market.

Dive into Technavio's robust research methodology, blending expert interviews, extensive data synthesis, and validated models for unparalleled Alcohol Infused Sparkling Water Market insights. See full methodology.

Market Scope

Report Coverage

Details

Page number

158

Base year

2023

Historic period

2018-2022

Forecast period

2024-2028

Growth momentum & CAGR

Accelerate at a CAGR of 14.12%

Market growth 2024-2028

USD 714.39 million

Market structure

Fragmented

YoY growth 2023-2024(%)

12.92

Key countries

US, Canada, Germany, UK, Italy, France, China, India, Japan, Brazil, Egypt, UAE, Oman, Argentina, KSA, UAE, Brazil, and Rest of World (ROW)

Competitive landscape

Leading Companies, Market Positioning of Companies, Competitive Strategies, and Industry Risks

Request Free Sample

What are the Key Data Covered in this Alcohol Infused Sparkling Water Market Research and Growth Report?

  • CAGR of the Alcohol Infused Sparkling Water industry during the forecast period
  • Detailed information on factors that will drive the growth and forecasting between 2024 and 2028
  • Precise estimation of the size of the market and its contribution of the industry in focus to the parent market
  • Accurate predictions about upcoming growth and trends and changes in consumer behaviour
  • Growth of the market across North America, Europe, APAC, South America, and Middle East and Africa
  • Thorough analysis of the market's competitive landscape and detailed information about companies
  • Comprehensive analysis of factors that will challenge the alcohol infused sparkling water market growth of industry companies

We can help! Our analysts can customize this alcohol infused sparkling water market research report to meet your requirements.

Get in touch

1 Executive Summary

  • 1.1 Market overview
    • Exhibit 01: Executive Summary – Chart on Market Overview
    • Exhibit 02: Executive Summary – Data Table on Market Overview
    • Exhibit 03: Executive Summary – Chart on Global Market Characteristics
    • Exhibit 04: Executive Summary – Chart on Market by Geography
    • Exhibit 05: Executive Summary – Chart on Market Segmentation by Distribution Channel
    • Exhibit 06: Executive Summary – Chart on Market Segmentation by Packaging
    • Exhibit 07: Executive Summary – Chart on Incremental Growth
    • Exhibit 08: Executive Summary – Data Table on Incremental Growth
    • Exhibit 09: Executive Summary – Chart on Vendor Market Positioning

2 Market Landscape

  • 2.1 Market ecosystem
    • Exhibit 10: Parent market
    • Exhibit 11: Market Characteristics

3 Market Sizing

  • 3.1 Market definition
    • Exhibit 12: Offerings of vendors included in the market definition
  • 3.2 Market segment analysis
    • Exhibit 13: Market segments
  • 3.3 Market size 2023
    • 3.4 Market outlook: Forecast for 2023-2028
      • Exhibit 14: Chart on Global - Market size and forecast 2023-2028 ($ million)
      • Exhibit 15: Data Table on Global - Market size and forecast 2023-2028 ($ million)
      • Exhibit 16: Chart on Global Market: Year-over-year growth 2023-2028 (%)
      • Exhibit 17: Data Table on Global Market: Year-over-year growth 2023-2028 (%)

    4 Historic Market Size

    • 4.1 Global alcohol infused sparkling water market 2018 - 2022
      • Exhibit 18: Historic Market Size – Data Table on global alcohol infused sparkling water market 2018 - 2022 ($ million)
    • 4.2 Distribution Channel Segment Analysis 2018 - 2022
      • Exhibit 19: Historic Market Size – Distribution Channel Segment 2018 - 2022 ($ million)
    • 4.3 Packaging Segment Analysis 2018 - 2022
      • Exhibit 20: Historic Market Size – Packaging Segment 2018 - 2022 ($ million)
    • 4.4 Geography Segment Analysis 2018 - 2022
      • Exhibit 21: Historic Market Size – Geography Segment 2018 - 2022 ($ million)
    • 4.5 Country Segment Analysis 2018 - 2022
      • Exhibit 22: Historic Market Size – Country Segment 2018 - 2022 ($ million)

    5 Five Forces Analysis

    • 5.1 Five forces summary
      • Exhibit 23: Five forces analysis - Comparison between 2023 and 2028
    • 5.2 Bargaining power of buyers
      • Exhibit 24: Chart on Bargaining power of buyers – Impact of key factors 2023 and 2028
    • 5.3 Bargaining power of suppliers
      • Exhibit 25: Bargaining power of suppliers – Impact of key factors in 2023 and 2028
    • 5.4 Threat of new entrants
      • Exhibit 26: Threat of new entrants – Impact of key factors in 2023 and 2028
    • 5.5 Threat of substitutes
      • Exhibit 27: Threat of substitutes – Impact of key factors in 2023 and 2028
    • 5.6 Threat of rivalry
      • Exhibit 28: Threat of rivalry – Impact of key factors in 2023 and 2028
    • 5.7 Market condition
      • Exhibit 29: Chart on Market condition - Five forces 2023 and 2028

    6 Market Segmentation by Distribution Channel

    • 6.1 Market segments
      • Chart on Distribution Channel - Market share (2023-2028) (%)
      • Data Table on Distribution Channel - Market share (2023-2028) (%)
    • 6.2 Comparison by Distribution Channel
      • Chart on Comparison by Distribution Channel
      • Data Table on Comparison by Distribution Channel
    • 6.3 Off-premises - Market size and forecast (2023-2028)
      • Chart on Off-premises - Market size and forecast (2023-2028) ($ million)
      • Data Table on Off-premises - Market size and forecast (2023-2028) ($ million)
      • Chart on Off-premises - Year-over-year growth (2023-2028) (%)
      • Data Table on Off-premises - Year-over-year growth (2023-2028) (%)
    • 6.4 On-premises - Market size and forecast (2023-2028)
      • Chart on On-premises - Market size and forecast (2023-2028) ($ million)
      • Data Table on On-premises - Market size and forecast (2023-2028) ($ million)
      • Chart on On-premises - Year-over-year growth (2023-2028) (%)
      • Data Table on On-premises - Year-over-year growth (2023-2028) (%)
    • 6.5 Market opportunity by Distribution Channel
      • Market opportunity by Distribution Channel ($ million)
      • Data Table on Market opportunity by Distribution Channel ($ million)

    7 Market Segmentation by Packaging

    • 7.1 Market segments
      • Chart on Packaging - Market share (2023-2028) (%)
      • Data Table on Packaging - Market share (2023-2028) (%)
    • 7.2 Comparison by Packaging
      • Chart on Comparison by Packaging
      • Data Table on Comparison by Packaging
    • 7.3 Canned - Market size and forecast (2023-2028)
      • Chart on Canned - Market size and forecast (2023-2028) ($ million)
      • Data Table on Canned - Market size and forecast (2023-2028) ($ million)
      • Chart on Canned - Year-over-year growth (2023-2028) (%)
      • Data Table on Canned - Year-over-year growth (2023-2028) (%)
    • 7.4 Bottled - Market size and forecast (2023-2028)
      • Chart on Bottled - Market size and forecast (2023-2028) ($ million)
      • Data Table on Bottled - Market size and forecast (2023-2028) ($ million)
      • Chart on Bottled - Year-over-year growth (2023-2028) (%)
      • Data Table on Bottled - Year-over-year growth (2023-2028) (%)
    • 7.5 Market opportunity by Packaging
      • Market opportunity by Packaging ($ million)
      • Data Table on Market opportunity by Packaging ($ million)

    8 Market Segmentation by Product Type

    • 8.1 Market segments
      • Chart on Product Type - Market share (2023-2028) (%)
      • Data Table on Product Type - Market share (2023-2028) (%)
    • 8.2 Comparison by Product Type
      • Chart on Comparison by Product Type
      • Data Table on Comparison by Product Type
    • 8.3 Low Alcohol - Market size and forecast (2023-2028)
      • Chart on Low Alcohol - Market size and forecast (2023-2028) ($ million)
      • Data Table on Low Alcohol - Market size and forecast (2023-2028) ($ million)
      • Chart on Low Alcohol - Year-over-year growth (2023-2028) (%)
      • Data Table on Low Alcohol - Year-over-year growth (2023-2028) (%)
    • 8.4 Zero Alcohol - Market size and forecast (2023-2028)
      • Chart on Zero Alcohol - Market size and forecast (2023-2028) ($ million)
      • Data Table on Zero Alcohol - Market size and forecast (2023-2028) ($ million)
      • Chart on Zero Alcohol - Year-over-year growth (2023-2028) (%)
      • Data Table on Zero Alcohol - Year-over-year growth (2023-2028) (%)
    • 8.5 Market opportunity by Product Type
      • Market opportunity by Product Type ($ million)
      • Data Table on Market opportunity by Product Type ($ million)

    9 Market Segmentation by Flavor

    • 9.1 Market segments
      • Chart on Flavor - Market share (2023-2028) (%)
      • Data Table on Flavor - Market share (2023-2028) (%)
    • 9.2 Comparison by Flavor
      • Chart on Comparison by Flavor
      • Data Table on Comparison by Flavor
    • 9.3 Fruit-Based - Market size and forecast (2023-2028)
      • Chart on Fruit-Based - Market size and forecast (2023-2028) ($ million)
      • Data Table on Fruit-Based - Market size and forecast (2023-2028) ($ million)
      • Chart on Fruit-Based - Year-over-year growth (2023-2028) (%)
      • Data Table on Fruit-Based - Year-over-year growth (2023-2028) (%)
    • 9.4 Herbal - Market size and forecast (2023-2028)
      • Chart on Herbal - Market size and forecast (2023-2028) ($ million)
      • Data Table on Herbal - Market size and forecast (2023-2028) ($ million)
      • Chart on Herbal - Year-over-year growth (2023-2028) (%)
      • Data Table on Herbal - Year-over-year growth (2023-2028) (%)
    • 9.5 Spiced - Market size and forecast (2023-2028)
      • Chart on Spiced - Market size and forecast (2023-2028) ($ million)
      • Data Table on Spiced - Market size and forecast (2023-2028) ($ million)
      • Chart on Spiced - Year-over-year growth (2023-2028) (%)
      • Data Table on Spiced - Year-over-year growth (2023-2028) (%)
    • 9.6 Market opportunity by Flavor
      • Market opportunity by Flavor ($ million)
      • Data Table on Market opportunity by Flavor ($ million)

    8 Customer Landscape

    • 8.1 Customer landscape overview
      • Exhibit 58: Analysis of price sensitivity, lifecycle, customer purchase basket, adoption rates, and purchase criteria

    9 Geographic Landscape

    • 9.1 Geographic segmentation
      • Exhibit 59: Chart on Market share by geography 2023-2028 (%)
      • Exhibit 60: Data Table on Market share by geography 2023-2028 (%)
    • 9.2 Geographic comparison
      • Exhibit 61: Chart on Geographic comparison
      • Exhibit 62: Data Table on Geographic comparison
    • 9.3 North America - Market size and forecast 2023-2028
      • Exhibit 63: Chart on North America - Market size and forecast 2023-2028 ($ million)
      • Exhibit 64: Data Table on North America - Market size and forecast 2023-2028 ($ million)
      • Exhibit 65: Chart on North America - Year-over-year growth 2023-2028 (%)
      • Exhibit 66: Data Table on North America - Year-over-year growth 2023-2028 (%)
    • 9.4 Europe - Market size and forecast 2023-2028
      • Exhibit 67: Chart on Europe - Market size and forecast 2023-2028 ($ million)
      • Exhibit 68: Data Table on Europe - Market size and forecast 2023-2028 ($ million)
      • Exhibit 69: Chart on Europe - Year-over-year growth 2023-2028 (%)
      • Exhibit 70: Data Table on Europe - Year-over-year growth 2023-2028 (%)
    • 9.5 APAC - Market size and forecast 2023-2028
      • Exhibit 71: Chart on APAC - Market size and forecast 2023-2028 ($ million)
      • Exhibit 72: Data Table on APAC - Market size and forecast 2023-2028 ($ million)
      • Exhibit 73: Chart on APAC - Year-over-year growth 2023-2028 (%)
      • Exhibit 74: Data Table on APAC - Year-over-year growth 2023-2028 (%)
    • 9.6 South America - Market size and forecast 2023-2028
      • Exhibit 75: Chart on South America - Market size and forecast 2023-2028 ($ million)
      • Exhibit 76: Data Table on South America - Market size and forecast 2023-2028 ($ million)
      • Exhibit 77: Chart on South America - Year-over-year growth 2023-2028 (%)
      • Exhibit 78: Data Table on South America - Year-over-year growth 2023-2028 (%)
    • 9.7 Middle East and Africa - Market size and forecast 2023-2028
      • Exhibit 79: Chart on Middle East and Africa - Market size and forecast 2023-2028 ($ million)
      • Exhibit 80: Data Table on Middle East and Africa - Market size and forecast 2023-2028 ($ million)
      • Exhibit 81: Chart on Middle East and Africa - Year-over-year growth 2023-2028 (%)
      • Exhibit 82: Data Table on Middle East and Africa - Year-over-year growth 2023-2028 (%)
    • 9.8 US - Market size and forecast 2023-2028
      • Exhibit 83: Chart on US - Market size and forecast 2023-2028 ($ million)
      • Exhibit 84: Data Table on US - Market size and forecast 2023-2028 ($ million)
      • Exhibit 85: Chart on US - Year-over-year growth 2023-2028 (%)
      • Exhibit 86: Data Table on US - Year-over-year growth 2023-2028 (%)
    • 9.9 Canada - Market size and forecast 2023-2028
      • Exhibit 87: Chart on Canada - Market size and forecast 2023-2028 ($ million)
      • Exhibit 88: Data Table on Canada - Market size and forecast 2023-2028 ($ million)
      • Exhibit 89: Chart on Canada - Year-over-year growth 2023-2028 (%)
      • Exhibit 90: Data Table on Canada - Year-over-year growth 2023-2028 (%)
    • 9.10 China - Market size and forecast 2023-2028
      • Exhibit 91: Chart on China - Market size and forecast 2023-2028 ($ million)
      • Exhibit 92: Data Table on China - Market size and forecast 2023-2028 ($ million)
      • Exhibit 93: Chart on China - Year-over-year growth 2023-2028 (%)
      • Exhibit 94: Data Table on China - Year-over-year growth 2023-2028 (%)
    • 9.11 Germany - Market size and forecast 2023-2028
      • Exhibit 95: Chart on Germany - Market size and forecast 2023-2028 ($ million)
      • Exhibit 96: Data Table on Germany - Market size and forecast 2023-2028 ($ million)
      • Exhibit 97: Chart on Germany - Year-over-year growth 2023-2028 (%)
      • Exhibit 98: Data Table on Germany - Year-over-year growth 2023-2028 (%)
    • 9.12 UK - Market size and forecast 2023-2028
      • Exhibit 99: Chart on UK - Market size and forecast 2023-2028 ($ million)
      • Exhibit 100: Data Table on UK - Market size and forecast 2023-2028 ($ million)
      • Exhibit 101: Chart on UK - Year-over-year growth 2023-2028 (%)
      • Exhibit 102: Data Table on UK - Year-over-year growth 2023-2028 (%)
    • 9.13 Market opportunity by geography
      • Exhibit 103: Market opportunity by geography ($ million)
      • Exhibit 104: Data Tables on Market opportunity by geography ($ million)
    • 11.14 Italy - Market size and forecast (2023-2028)
      • Chart on Italy - Market size and forecast (2023-2028) ($ million)
      • Data Table on Italy - Market size and forecast (2023-2028) ($ million)
      • Chart on Italy - Year-over-year growth (2023-2028) (%)
      • Data Table on Italy - Year-over-year growth (2023-2028) (%)
    • 11.15 France - Market size and forecast (2023-2028)
      • Chart on France - Market size and forecast (2023-2028) ($ million)
      • Data Table on France - Market size and forecast (2023-2028) ($ million)
      • Chart on France - Year-over-year growth (2023-2028) (%)
      • Data Table on France - Year-over-year growth (2023-2028) (%)
    • 11.16 India - Market size and forecast (2023-2028)
      • Chart on India - Market size and forecast (2023-2028) ($ million)
      • Data Table on India - Market size and forecast (2023-2028) ($ million)
      • Chart on India - Year-over-year growth (2023-2028) (%)
      • Data Table on India - Year-over-year growth (2023-2028) (%)
    • 11.17 Japan - Market size and forecast (2023-2028)
      • Chart on Japan - Market size and forecast (2023-2028) ($ million)
      • Data Table on Japan - Market size and forecast (2023-2028) ($ million)
      • Chart on Japan - Year-over-year growth (2023-2028) (%)
      • Data Table on Japan - Year-over-year growth (2023-2028) (%)
    • 11.18 Brazil - Market size and forecast (2023-2028)
      • Chart on Brazil - Market size and forecast (2023-2028) ($ million)
      • Data Table on Brazil - Market size and forecast (2023-2028) ($ million)
      • Chart on Brazil - Year-over-year growth (2023-2028) (%)
      • Data Table on Brazil - Year-over-year growth (2023-2028) (%)
    • 11.19 Egypt - Market size and forecast (2023-2028)
      • Chart on Egypt - Market size and forecast (2023-2028) ($ million)
      • Data Table on Egypt - Market size and forecast (2023-2028) ($ million)
      • Chart on Egypt - Year-over-year growth (2023-2028) (%)
      • Data Table on Egypt - Year-over-year growth (2023-2028) (%)
    • 11.20 UAE - Market size and forecast (2023-2028)
      • Chart on UAE - Market size and forecast (2023-2028) ($ million)
      • Data Table on UAE - Market size and forecast (2023-2028) ($ million)
      • Chart on UAE - Year-over-year growth (2023-2028) (%)
      • Data Table on UAE - Year-over-year growth (2023-2028) (%)
    • 11.21 Oman - Market size and forecast (2023-2028)
      • Chart on Oman - Market size and forecast (2023-2028) ($ million)
      • Data Table on Oman - Market size and forecast (2023-2028) ($ million)
      • Chart on Oman - Year-over-year growth (2023-2028) (%)
      • Data Table on Oman - Year-over-year growth (2023-2028) (%)
    • 11.22 Argentina - Market size and forecast (2023-2028)
      • Chart on Argentina - Market size and forecast (2023-2028) ($ million)
      • Data Table on Argentina - Market size and forecast (2023-2028) ($ million)
      • Chart on Argentina - Year-over-year growth (2023-2028) (%)
      • Data Table on Argentina - Year-over-year growth (2023-2028) (%)
    • 11.23 KSA - Market size and forecast (2023-2028)
      • Chart on KSA - Market size and forecast (2023-2028) ($ million)
      • Data Table on KSA - Market size and forecast (2023-2028) ($ million)
      • Chart on KSA - Year-over-year growth (2023-2028) (%)
      • Data Table on KSA - Year-over-year growth (2023-2028) (%)
    • 11.24 Rest of World (ROW) - Market size and forecast (2023-2028)
      • Chart on Rest of World (ROW) - Market size and forecast (2023-2028) ($ million)
      • Data Table on Rest of World (ROW) - Market size and forecast (2023-2028) ($ million)
      • Chart on Rest of World (ROW) - Year-over-year growth (2023-2028) (%)
      • Data Table on Rest of World (ROW) - Year-over-year growth (2023-2028) (%)

    10 Drivers, Challenges, and Trends

    • 10.1 Market drivers
      • 10.2 Market challenges
        • 10.3 Impact of drivers and challenges
          • Exhibit 105: Impact of drivers and challenges in 2023 and 2028
        • 10.4 Market trends

          11 Vendor Landscape

          • 11.1 Overview
            • 11.2 Vendor landscape
              • Exhibit 106: Overview on Criticality of inputs and Factors of differentiation
            • 11.3 Landscape disruption
              • Exhibit 107: Overview on factors of disruption
            • 11.4 Industry risks
              • Exhibit 108: Impact of key risks on business

            14 Competitive Analysis

            • 14.1 Companies profiled
              • Companies covered
            • 14.2 Market positioning of companies
              • Matrix on companies position and classification
            • 14.3 Anheuser-Busch InBev SA/NV
              • Anheuser-Busch InBev SA/NV - Overview
              • Anheuser-Busch InBev SA/NV - Product / Service
              • Anheuser-Busch InBev SA/NV - Key offerings
            • 14.4 Asahi Group Holdings Ltd.
              • Asahi Group Holdings Ltd. - Overview
              • Asahi Group Holdings Ltd. - Product / Service
              • Asahi Group Holdings Ltd. - Key offerings
            • 14.5 Boston Beer Co. Inc.
              • Boston Beer Co. Inc. - Overview
              • Boston Beer Co. Inc. - Product / Service
              • Boston Beer Co. Inc. - Key offerings
            • 14.6 Brown-Forman Corp.
              • Brown-Forman Corp. - Overview
              • Brown-Forman Corp. - Product / Service
              • Brown-Forman Corp. - Key offerings
            • 14.7 Carlsberg A/S
              • Carlsberg A/S - Overview
              • Carlsberg A/S - Product / Service
              • Carlsberg A/S - Key offerings
            • 14.8 Coca-Cola Co.
              • Coca-Cola Co. - Overview
              • Coca-Cola Co. - Product / Service
              • Coca-Cola Co. - Key offerings
            • 14.9 Constellation Brands Inc.
              • Constellation Brands Inc. - Overview
              • Constellation Brands Inc. - Product / Service
              • Constellation Brands Inc. - Key offerings
            • 14.10 Diageo Plc
              • Diageo Plc - Overview
              • Diageo Plc - Product / Service
              • Diageo Plc - Key offerings
            • 14.11 E. & J. Gallo Winery
              • E. & J. Gallo Winery - Overview
              • E. & J. Gallo Winery - Product / Service
              • E. & J. Gallo Winery - Key offerings
            • 14.12 Heineken NV
              • Heineken NV - Overview
              • Heineken NV - Product / Service
              • Heineken NV - Key offerings
            • 14.13 Kirin Holdings Co. Ltd.
              • Kirin Holdings Co. Ltd. - Overview
              • Kirin Holdings Co. Ltd. - Product / Service
              • Kirin Holdings Co. Ltd. - Key offerings
            • 14.14 Mark Anthony Brands
              • Mark Anthony Brands - Overview
              • Mark Anthony Brands - Product / Service
              • Mark Anthony Brands - Key offerings
            • 14.15 Molson Coors Beverage Co.
              • Molson Coors Beverage Co. - Overview
              • Molson Coors Beverage Co. - Product / Service
              • Molson Coors Beverage Co. - Key offerings
            • 14.16 Naked Collective Ltd.
              • Naked Collective Ltd. - Overview
              • Naked Collective Ltd. - Product / Service
              • Naked Collective Ltd. - Key offerings
            • 14.17 PepsiCo Inc.
              • PepsiCo Inc. - Overview
              • PepsiCo Inc. - Product / Service
              • PepsiCo Inc. - Key offerings
            • 14.18 Pernod Ricard SA
              • Pernod Ricard SA - Overview
              • Pernod Ricard SA - Product / Service
              • Pernod Ricard SA - Key offerings
            • 14.19 Phusion Projects LLC
              • Phusion Projects LLC - Overview
              • Phusion Projects LLC - Product / Service
              • Phusion Projects LLC - Key offerings
            • 14.20 Polar Beverages
              • Polar Beverages - Overview
              • Polar Beverages - Product / Service
              • Polar Beverages - Key offerings
            • 14.21 Suntory Holdings Ltd.
              • Suntory Holdings Ltd. - Overview
              • Suntory Holdings Ltd. - Product / Service
              • Suntory Holdings Ltd. - Key offerings
            • 14.22 White Claw Seltzer Works
              • White Claw Seltzer Works - Overview
              • White Claw Seltzer Works - Product / Service
              • White Claw Seltzer Works - Key offerings
            • 14.23 Anheuser Busch InBev SA NV
              • Anheuser Busch InBev SA NV - Overview
              • Anheuser Busch InBev SA NV - Product / Service
              • Anheuser Busch InBev SA NV - Key offerings
            • 14.24 Constellation Brands Inc.
              • Constellation Brands Inc. - Overview
              • Constellation Brands Inc. - Product / Service
              • Constellation Brands Inc. - Key offerings
            • 14.25 Diageo Plc
              • Diageo Plc - Overview
              • Diageo Plc - Product / Service
              • Diageo Plc - Key offerings
            • 14.26 E. and J. Gallo Winery
              • E. and J. Gallo Winery - Overview
              • E. and J. Gallo Winery - Product / Service
              • E. and J. Gallo Winery - Key offerings
            • 14.27 Eel River Brewing Co.
              • Eel River Brewing Co. - Overview
              • Eel River Brewing Co. - Product / Service
              • Eel River Brewing Co. - Key offerings
            • 14.28 Ficks and Co.
              • Ficks and Co. - Overview
              • Ficks and Co. - Product / Service
              • Ficks and Co. - Key offerings
            • 14.29 Keurig Dr Pepper Inc.
              • Keurig Dr Pepper Inc. - Overview
              • Keurig Dr Pepper Inc. - Product / Service
              • Keurig Dr Pepper Inc. - Key offerings
            • 14.30 Lift Bridge Brewing Co.
              • Lift Bridge Brewing Co. - Overview
              • Lift Bridge Brewing Co. - Product / Service
              • Lift Bridge Brewing Co. - Key offerings
            • 14.31 M.I.A. Beer Co.
              • M.I.A. Beer Co. - Overview
              • M.I.A. Beer Co. - Product / Service
              • M.I.A. Beer Co. - Key offerings
            • 14.32 Mark Anthony Brands International Unlimited Co.
              • Mark Anthony Brands International Unlimited Co. - Overview
              • Mark Anthony Brands International Unlimited Co. - Product / Service
              • Mark Anthony Brands International Unlimited Co. - Key offerings
            • 14.33 Molson Coors Beverage Co.
              • Molson Coors Beverage Co. - Overview
              • Molson Coors Beverage Co. - Product / Service
              • Molson Coors Beverage Co. - Key offerings
            • 14.34 Monster Beverage Corp.
              • Monster Beverage Corp. - Overview
              • Monster Beverage Corp. - Product / Service
              • Monster Beverage Corp. - Key offerings
            • 14.35 Polar Beverages
              • Polar Beverages - Overview
              • Polar Beverages - Product / Service
              • Polar Beverages - Key offerings
            • 14.36 San Juan Seltzer Inc.
              • San Juan Seltzer Inc. - Overview
              • San Juan Seltzer Inc. - Product / Service
              • San Juan Seltzer Inc. - Key offerings
            • 14.37 Sercy Spiked and Sparkling
              • Sercy Spiked and Sparkling - Overview
              • Sercy Spiked and Sparkling - Product / Service
              • Sercy Spiked and Sparkling - Key offerings
            • 14.38 Suntory Holdings Ltd.
              • Suntory Holdings Ltd. - Overview
              • Suntory Holdings Ltd. - Product / Service
              • Suntory Holdings Ltd. - Key offerings
            • 14.39 The Boston Beer Co. Inc.
              • The Boston Beer Co. Inc. - Overview
              • The Boston Beer Co. Inc. - Product / Service
              • The Boston Beer Co. Inc. - Key offerings
            • 14.40 Wachusett Brewing Co. Inc.
              • Wachusett Brewing Co. Inc. - Overview
              • Wachusett Brewing Co. Inc. - Product / Service
              • Wachusett Brewing Co. Inc. - Key offerings
            • 14.41 XYZBEV
              • XYZBEV - Overview
              • XYZBEV - Product / Service
              • XYZBEV - Key offerings

            13 Appendix

            • 13.1 Scope of the report
              • 13.2 Inclusions and exclusions checklist
                • Exhibit 162: Inclusions checklist
                • Exhibit 163: Exclusions checklist
              • 13.3 Currency conversion rates for US$
                • Exhibit 164: Currency conversion rates for US$
              • 13.4 Research methodology
                • Exhibit 165: Research methodology
                • Exhibit 166: Validation techniques employed for market sizing
                • Exhibit 167: Information sources
              • 13.5 List of abbreviations
                • Exhibit 168: List of abbreviations

              Research Methodology

              Technavio presents a detailed picture of the market by way of study, synthesis, and summation of data from multiple sources. The analysts have presented the various facets of the market with a particular focus on identifying the key industry influencers. The data thus presented is comprehensive, reliable, and the result of extensive research, both primary and secondary.

              INFORMATION SOURCES

              Primary sources

              • Manufacturers and suppliers
              • Channel partners
              • Industry experts
              • Strategic decision makers

              Secondary sources

              • Industry journals and periodicals
              • Government data
              • Financial reports of key industry players
              • Historical data
              • Press releases

              DATA ANALYSIS

              Data Synthesis

              • Collation of data
              • Estimation of key figures
              • Analysis of derived insights

              Data Validation

              • Triangulation with data models
              • Reference against proprietary databases
              • Corroboration with industry experts

              REPORT WRITING

              Qualitative

              • Market drivers
              • Market challenges
              • Market trends
              • Five forces analysis

              Quantitative

              • Market size and forecast
              • Market segmentation
              • Geographical insights
              • Competitive landscape

              Interested in this report?

              Get your sample now to see our research methodology and insights!

              Download Now

              Frequently Asked Questions

              Alcohol Infused Sparkling Water market growth will increase by $ 714.39 mn during 2024-2028.

              The Alcohol Infused Sparkling Water market is expected to grow at a CAGR of 14.12% during 2024-2028.

              Alcohol Infused Sparkling Water market is segmented by Distribution Channel( Off-premises, On-premises) Packaging( Canned, Bottled, APAC, South America, Middle East and Africa)

              Anheuser-Busch InBev SA/NV, Asahi Group Holdings Ltd., Boston Beer Co. Inc., Brown-Forman Corp., Carlsberg A/S, Coca-Cola Co., Constellation Brands Inc., Diageo Plc, E. & J. Gallo Winery, Heineken NV, Kirin Holdings Co. Ltd., Mark Anthony Brands, Molson Coors Beverage Co., Naked Collective Ltd., PepsiCo Inc., Pernod Ricard SA, Phusion Projects LLC, Polar Beverages, Suntory Holdings Ltd., White Claw Seltzer Works are a few of the key vendors in the Alcohol Infused Sparkling Water market.

              North America will register the highest growth rate of 61% among the other regions. Therefore, the Alcohol Infused Sparkling Water market in North America is expected to garner significant business opportunities for the vendors during the forecast period.

              US, Canada, Germany, UK, Italy, France, China, India, Japan, Brazil, Egypt, UAE, Oman, Argentina, KSA, UAE, Brazil, Rest of World (ROW)

              • Rising demand for low-calorie alcoholic beveragesConsumers' inclination toward healthier alcohol alternatives propelled by the low-carb movement and the inclusion of low or no sugar has fueled the growth of the global alcoholic infused sparkling water market. Breweries and manufacturers have introduced low-calorie is the driving factor this market.
              • low-carb is the driving factor this market.
              • gluten-free alcohol induced sparkling water with new natural flavors is the driving factor this market.
              • providing consumers with more varietal options to choose from. For example is the driving factor this market.
              • White Claw from Mark Anthony Group has included flavors like black cherry is the driving factor this market.
              • raspberry is the driving factor this market.
              • and natural lime in its offerings. Additionally is the driving factor this market.
              • White Claw contains only 2 gm of carbohydrates and 100 calories with 5% ABV per 12oz drink. Thus is the driving factor this market.
              • the demand for lighter alcoholic options is growing due to consumer preference for healthier alcoholic beverages is the driving factor this market.
              • increasing awareness and concern for the nutritional value of beverages is the driving factor this market.
              • and the rising trend of drinking in moderation. The rising demand for low-calorie alcoholic beverages is expected to drive the growth of the global alcoholic infused sparkling water market during the forecast period. is the driving factor this market.

              The Alcohol Infused Sparkling Water market vendors should focus on grabbing business opportunities from the Off-premises segment as it accounted for the largest market share in the base year.
              RIA - Research AI Assistant
              Ask RIA