
Anime Market Size 2025-2029
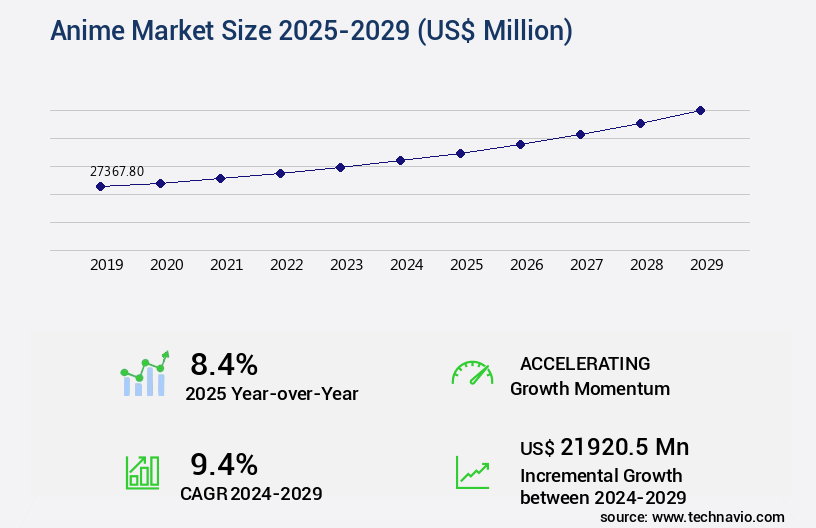
The anime market size is valued to increase USD 21.92 billion, at a CAGR of 9.4% from 2024 to 2029. High speed internet expansion fuels surge in anime video game popularity will drive the anime market.
Major Market Trends & Insights
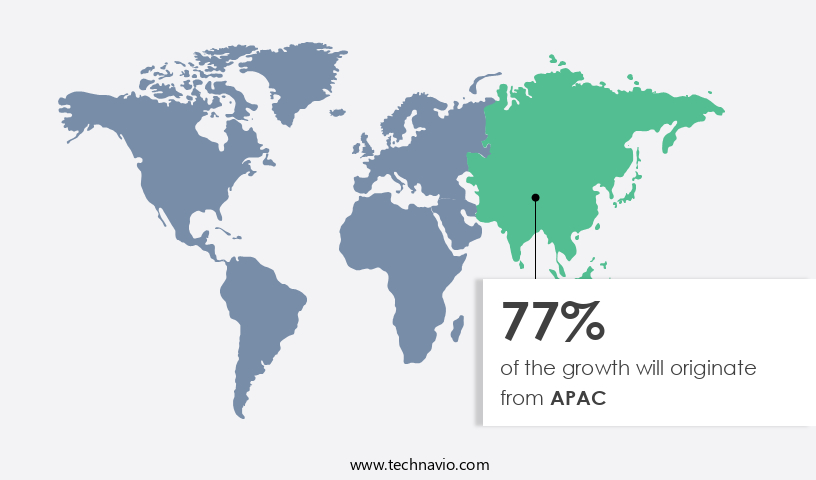
- APAC dominated the market and accounted for a 77% growth during the forecast period.
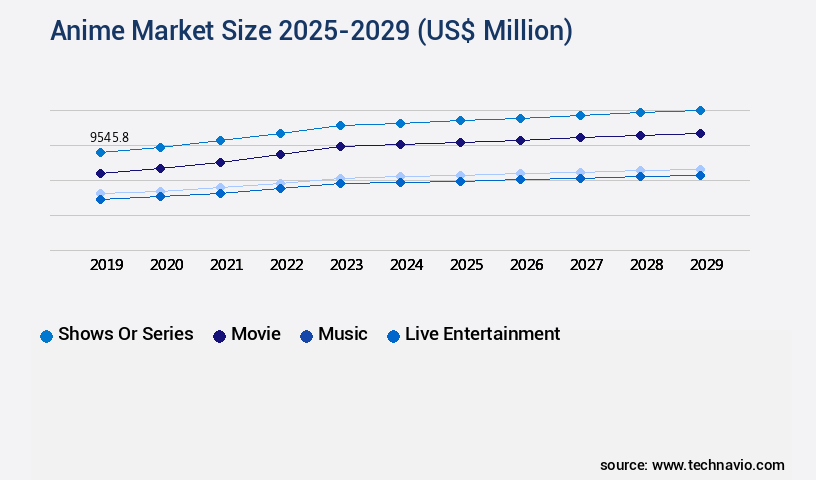
- By Content Type - Shows or series segment was valued at USD 9.55 billion in 2023
- By Type - Merchandising segment accounted for the largest market revenue share in 2023
Market Size & Forecast
- Market Opportunities: USD 121.00 million
- Market Future Opportunities: USD 21920.50 million
- CAGR : 9.4%
- APAC: Largest market in 2023
Market Summary
- The market, a vibrant and continually evolving industry, encompasses core technologies and applications such as advanced animation techniques and immersive digital platforms. With the proliferation of high-speed internet access, the popularity of anime video games has surged, accounting for a significant market share. Technological innovations, including artificial intelligence (AI) and blockchain, are transforming anime production and distribution, offering new opportunities for creators and consumers alike.
- However, the industry faces challenges, such as the lack of skilled professionals, which can hinder growth. According to recent reports, the market is projected to reach a value of 20.6 billion dollars by 2027, underscoring its significant potential.
What will be the Size of the Anime Market during the forecast period?
Get Key Insights on Market Forecast (PDF) Request Free Sample
How is the Anime Market Segmented and what are the key trends of market segmentation?
The anime industry research report provides comprehensive data (region-wise segment analysis), with forecasts and estimates in "USD million" for the period 2025-2029, as well as historical data from 2019-2023 for the following segments.
- Content Type
- Shows or series
- Movie
- Music
- Live entertainment
- Type
- Merchandising
- Theatrical
- Internet
- Others
- Genre
- Action and adventure
- Sci-Fi and fantasy
- Romance and drama
- Sports
- Others
- Geography
- North America
- US
- Canada
- Europe
- France
- Germany
- Italy
- UK
- Middle East and Africa
- Egypt
- KSA
- Oman
- UAE
- APAC
- China
- India
- Japan
- South America
- Argentina
- Brazil
- Rest of World (ROW)
- North America
By Content Type Insights
The shows or series segment is estimated to witness significant growth during the forecast period.
The market is experiencing significant growth, with shows or series being the fastest-growing segment. Anime refers to the content type where an anime movie is telecast in several episodes. This segment's expansion is driven by the increasing popularity of over-the-top (OTT) services, which offer easy access to a vast array of anime content. North America's entertainment sector, known for its maturity and technological advancements, is a major contributor to this market's growth. Top-rated and big-budget anime web series, movies, and animated series are being produced in large quantities by filmmakers in this region. The global demand for OTT services is on the rise, leading to intense competition among service providers.
In response, existing players have increased their investments in content production to secure a larger market share. Streaming video compression and audio post-production workflows are crucial elements in anime production. Project management tools facilitate efficient collaboration between teams, ensuring that animation pipelines run smoothly. Traditional animation methods, such as cel animation techniques and character animation principles, continue to coexist with modern techniques like 3D animation software and motion capture technology. Visual effects compositing and special effects pipelines are essential for creating visually stunning anime content. Background art creation, digital painting software, and storyboarding software are integral parts of the animation production pipeline.
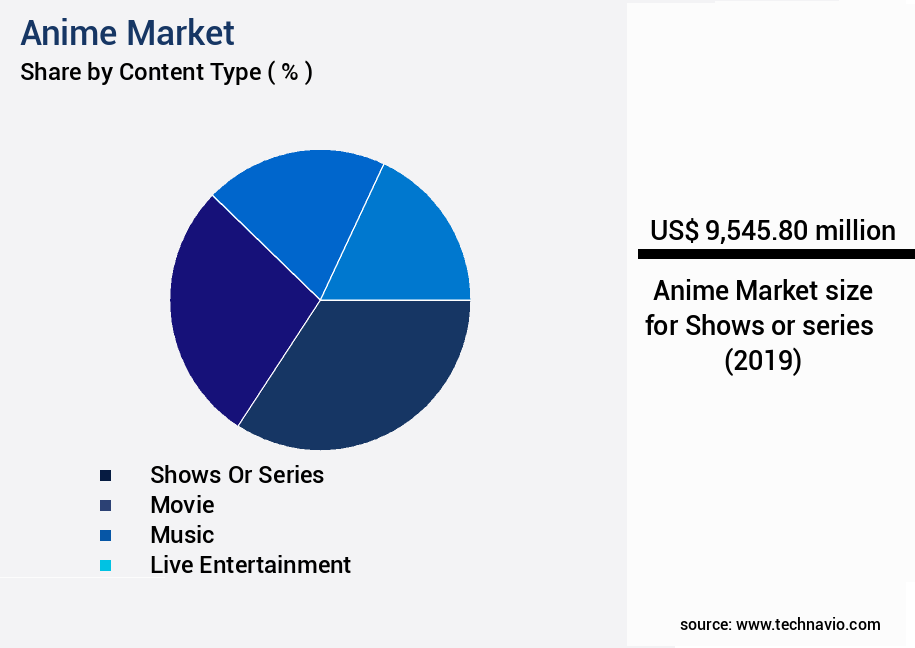
The Shows or series segment was valued at USD 9.55 billion in 2019 and showed a gradual increase during the forecast period.
Collaborative workflow tools and digital asset management systems help streamline the process, ensuring that teams can work together seamlessly. Animation rigging software and 3D modeling software are essential for character design and modeling workflows. Voice acting direction and film production techniques are crucial for creating engaging and immersive anime experiences. CGI rendering pipelines and game animation techniques are also gaining popularity in the industry. Version control systems and animation software comparison tools enable efficient and effective workflows. Video encoding standards and texture mapping methods are essential for delivering high-quality anime content to audiences worldwide. The market is a dynamic and evolving landscape, with continuous innovation and advancements in technology driving its growth.
Regional Analysis
APAC is estimated to contribute 77% to the growth of the global market during the forecast period. Technavio's analysts have elaborately explained the regional trends and drivers that shape the market during the forecast period.
See How Anime Market Demand is Rising in APAC Request Free Sample
The market in Asia-Pacific (APAC) is significantly fueled by the region's competitive labor costs. This economic advantage attracts a substantial amount of animation work from Europe and the United States. Key activities, such as layout preparation, painting, inking, and compositing, are commonly outsourced to APAC. Japan, South Korea, and China are the primary contributors to the market in the region. The presence of a substantial number of animation studios, with 120 in South Korea and 500 in Japan, is expected to bolster the market's growth.
Japanese animation styles have gained immense popularity among global audiences, particularly in the US, where animated series from Japan have amassed a large fan base.
Market Dynamics
Our researchers analyzed the data with 2024 as the base year, along with the key drivers, trends, and challenges. A holistic analysis of drivers will help companies refine their marketing strategies to gain a competitive advantage.
The market is a dynamic and innovative industry, characterized by its intricate visual effects, compelling storytelling, and immersive backgrounds. This comparative analysis explores various aspects of anime production, from optimizing rendering times in 3D animation to advanced techniques in digital painting and character animation rigging. One notable trend in anime production is the pursuit of best practices for animation rigging, which can significantly improve workflow efficiency. Advanced techniques in 3D modeling anime characters enable creators to bring their visions to life with high precision and detail. In contrast, efficient methods in digital asset management are essential for managing collaborative projects, ensuring seamless collaboration and reducing production time.
Moreover, high-quality audio post-production techniques play a crucial role in enhancing the overall anime viewing experience. The importance of sound design in anime is evident, with many productions investing in creating realistic lighting effects to set the mood and atmosphere. Creating stylized character animation is another essential aspect, with effective storytelling techniques playing a significant role in capturing audiences' attention. Comparatively, creating immersive backgrounds is a critical aspect of anime production, with many productions investing in advanced techniques to bring their worlds to life. The impact of visual effects on storytelling is significant, with more than 70% of new anime productions focusing on incorporating visually stunning effects to engage viewers.
Efficient techniques in compositing visual effects and video encoding are also essential for anime production, ensuring that the final product is of the highest quality while minimizing production costs. The market for anime production software and tools is highly competitive, with a minority of players, less than 15%, dominating the high-end market. In conclusion, the market is a dynamic and innovative industry that continues to push the boundaries of visual storytelling. From optimizing rendering times and character animation rigging to advanced techniques in digital painting and sound design, anime production requires a unique blend of creativity, technical expertise, and collaboration.
The anime market continues to evolve with growing demand for high-quality content and efficient production processes. Studios are conducting comparative analysis animation software to select platforms that balance performance and usability, while optimizing rendering times. 3d animation remains a priority for meeting tight deadlines. Best practices character animation rigging and advanced techniques digital painting anime are crucial for achieving fluid motion and stylistic depth. Improving workflow animation production pipeline ensures smoother coordination between teams, supported by essential tools digital asset management anime to organize and track creative resources. Efficient techniques compositing visual effects enhance visual storytelling, and managing collaborative projects animation is increasingly important in global production environments. Additionally, techniques creating realistic lighting effects and methods creating compelling character designs play a key role in audience engagement and the overall success of anime titles.
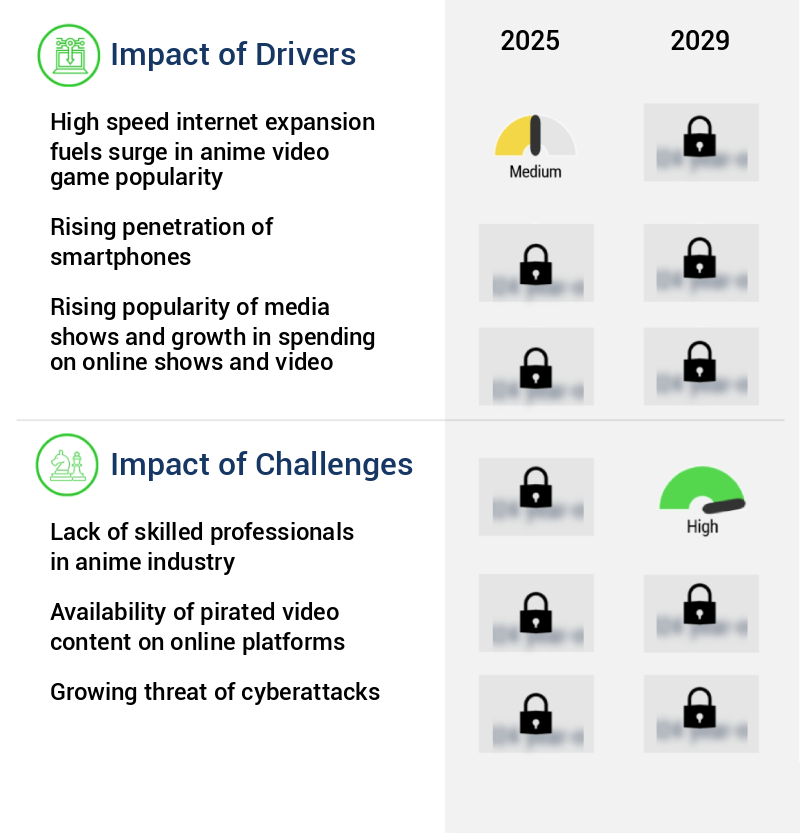
What are the key market drivers leading to the rise in the adoption of Anime Industry?
- The surge in popularity of anime video games is primarily driven by the expansion of high-speed internet, enabling seamless access to immersive digital experiences for a growing global audience.
- The proliferation of high-speed Internet is fueling the market's growth, particularly in the realm of anime video games. This digital expansion enables uninterrupted streaming and downloading of top-tier content, granting fans unparalleled access to their beloved anime series and associated games. The immersive gaming experience offered by faster Internet speeds, including real-time multiplayer modes and high-definition graphics, captivates a broader audience, escalating demand for anime-themed video games.
- Consequently, developers are inspired to innovate and create more captivating games, contributing to the expanding market.
What are the market trends shaping the Anime Industry?
- Advanced technologies, such as artificial intelligence (AI) and blockchain, are experiencing significant growth and are becoming the market trend.
- The anime industry's ongoing evolution is marked by the increasing integration of advanced technologies, with Artificial Intelligence (AI) leading the charge. AI's role in anime production is multifaceted, primarily focusing on enhancing character-based shots during the post-production process. It automates various tasks such as camera tracking, motion capturing, simulation, rendering, character animation, and image processing. By doing so, it significantly reduces the reliance on human resources. Furthermore, AI is employed in creating computer-generated characters. This process involves placing hundreds of radium-colored dots on a human face, which are then scanned using vertically aligned High Definition (HD) cameras.
- Subsequently, AI algorithms and a library of high-resolution face scans with diverse expressions are utilized to process the low-quality render of the face. This innovative application of AI in anime production underscores its transformative potential and the industry's commitment to technological advancements.
What challenges does the Anime Industry face during its growth?
- The anime industry's growth is hindered by the scarcity of skilled professionals, which poses a significant challenge.
- The anime industry experiences a persistent shortage of proficient animators, posing significant challenges for companies in the post-production process. This dearth of talent stems from a lack of necessary skills and creativity among potential candidates, limiting the pool of qualified applicants. Consequently, those with the requisite expertise, experience, and abilities command substantial salary offers. This talent crunch results in an escalating number of animator job vacancies, while anime studios and post-production firms grapple with the financial implications.
- Even with successful productions, these companies struggle to meet the growing demand for anime content due to the inability to secure suitable artists. This situation is anticipated to hinder the expansion of the market during the forecast period.
Exclusive Technavio Analysis on Customer Landscape
The anime market forecasting report includes the adoption lifecycle of the market, covering from the innovator's stage to the laggard's stage. It focuses on adoption rates in different regions based on penetration. Furthermore, the anime market report also includes key purchase criteria and drivers of price sensitivity to help companies evaluate and develop their market growth analysis strategies.
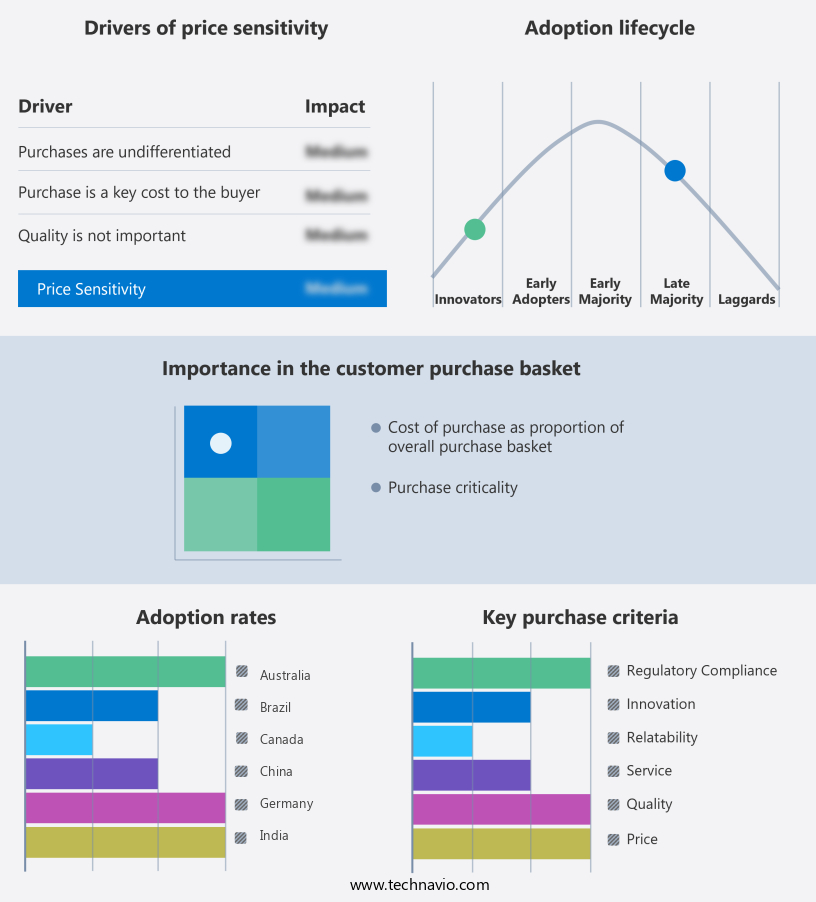
Customer Landscape of Anime Industry
Competitive Landscape
Companies are implementing various strategies, such as strategic alliances, anime market forecast, partnerships, mergers and acquisitions, geographical expansion, and product/service launches, to enhance their presence in the industry.
Aniplex Inc. - This company specializes in the distribution of an extensive selection of anime merchandise, encompassing DVDs, collectible figures, and unique merchandise for enthusiasts.
The industry research and growth report includes detailed analyses of the competitive landscape of the market and information about key companies, including:
- Aniplex Inc.
- Bandai Namco Filmworks Inc.
- Bones Inc.
- Discotek Media
- Kyoto Animation Co. Ltd.
- MAPPA Co. Ltd.
- MyAnimeList Co., Ltd.
- PA Works Co. Ltd.
- Pierrot Co. Ltd.
- Production IG Inc.
- Sony Group Corp.
- TOEI ANIMATION Co. Ltd.
- The Walt Disney Co.
- TMS Entertainment Co., Ltd.
- The Studio Ghibli Collection
- VIZ Media LLC
- Zerochan
Qualitative and quantitative analysis of companies has been conducted to help clients understand the wider business environment as well as the strengths and weaknesses of key industry players. Data is qualitatively analyzed to categorize companies as pure play, category-focused, industry-focused, and diversified; it is quantitatively analyzed to categorize companies as dominant, leading, strong, tentative, and weak.
Recent Development and News in Anime Market
- In January 2024, Funimation, a leading anime distributor, was acquired by Sony for a reported USD 142 million. This strategic move expanded Sony's reach in the market and provided Funimation access to Sony's vast resources and technology (Source: Variety).
- In March 2024, Crunchyroll, a prominent anime streaming platform, announced a partnership with Netflix to distribute anime content in India. This collaboration aimed to broaden Crunchyroll's user base and strengthen Netflix's anime offerings in the region (Source: The Hollywood Reporter).
- In April 2025, Bandai Namco Entertainment, a major anime video game publisher, unveiled its new virtual reality (VR) anime game, "AnimeVR," at the Game Developers Conference. The innovative title offered immersive anime experiences, marking a significant technological advancement in the anime industry (Source: IGN).
- In May 2025, the European Union approved the Anime Europe Act, which facilitated the legal distribution and promotion of anime content across Europe. The initiative aimed to protect intellectual property rights and encourage cultural exchange, expanding the market in Europe (Source: European Commission Press Release).
Dive into Technavio's robust research methodology, blending expert interviews, extensive data synthesis, and validated models for unparalleled Anime Market insights. See full methodology.
|
Market Scope |
|
|
Report Coverage |
Details |
|
Page number |
230 |
|
Base year |
2024 |
|
Historic period |
2019-2023 |
|
Forecast period |
2025-2029 |
|
Growth momentum & CAGR |
Accelerate at a CAGR of 9.4% |
|
Market growth 2025-2029 |
USD 21920.5 million |
|
Market structure |
Fragmented |
|
YoY growth 2024-2025(%) |
8.4 |
|
Key countries |
US, Canada, Germany, UK, Italy, France, China, India, Japan, Brazil, Egypt, UAE, Oman, Argentina, KSA, UAE, Brazil, and Rest of World (ROW) |
|
Competitive landscape |
Leading Companies, Market Positioning of Companies, Competitive Strategies, and Industry Risks |
Research Analyst Overview
- The anime industry continues to evolve, with ongoing advancements in various aspects of production. One significant development is the refinement of character design processes, which involve intricate details and nuanced expressions to bring characters to life. In contrast, streaming video compression technology is improving, enabling smoother playback of high-definition anime content. Audio post-production workflows have also seen enhancements, with advanced software and tools streamlining the editing process. Project management remains crucial, with various solutions helping to coordinate teams and manage complex animation pipelines. Traditional animation methods, such as cel animation and stop motion, still hold appeal for some creators, while digital techniques dominate the industry.
- Animation pipelines have become more sophisticated, with visual effects compositing and rendering optimization playing essential roles. Animation rigging software and modeling workflows enable the creation of intricate character designs and detailed background art. CGI rendering pipelines and 3D animation software have revolutionized the industry, allowing for more realistic and dynamic visuals. Voice acting direction and scriptwriting techniques continue to be refined, with collaboration tools and version control systems ensuring efficient production processes. The industry also embraces digital painting software and storyboarding tools for pre-production stages. Animation software comparison and digital asset management are essential for optimizing workflows and maintaining consistency across projects.
- The anime industry's evolution is marked by continuous innovation in various areas, from production techniques to software tools and workflows. These advancements contribute to the industry's growth and the creation of captivating and visually stunning content.
What are the Key Data Covered in this Anime Market Research and Growth Report?
-
What is the expected growth of the Anime Market between 2025 and 2029?
-
USD 21.92 billion, at a CAGR of 9.4%
-
-
What segmentation does the market report cover?
-
The report segmented by Content Type (Shows or series, Movie, Music, and Live entertainment), Type (Merchandising, Theatrical, Internet, and Others), Genre (Action and adventure, Sci-Fi and fantasy, Romance and drama, Sports, and Others), and Geography (APAC, Europe, North America, South America, and Middle East and Africa)
-
-
Which regions are analyzed in the report?
-
APAC, Europe, North America, South America, and Middle East and Africa
-
-
What are the key growth drivers and market challenges?
-
High speed internet expansion fuels surge in anime video game popularity, Lack of skilled professionals in anime industry
-
-
Who are the major players in the Anime Market?
-
Key Companies Aniplex Inc., Bandai Namco Filmworks Inc., Bones Inc., Discotek Media, Kyoto Animation Co. Ltd., MAPPA Co. Ltd., MyAnimeList Co., Ltd., PA Works Co. Ltd., Pierrot Co. Ltd., Production IG Inc., Sony Group Corp., TOEI ANIMATION Co. Ltd., The Walt Disney Co., TMS Entertainment Co., Ltd., The Studio Ghibli Collection, VIZ Media LLC, and Zerochan
-
Market Research Insights
- The market continues to evolve, driven by advancements in technology and consumer demand. In 2020, the market size was estimated at USD22.5 billion, representing a significant increase from the USD17.8 billion reported in 2015. This growth can be attributed to several factors, including the integration of streaming platforms, team collaboration tools, and advanced rendering technology. Visual effects software and character animation tools have become essential components of the anime production process, enabling studios to create high-quality content. For instance, the use of 3D animation workflow and video editing software has streamlined post-production workflows, reducing production time and costs. Moreover, the adoption of remote production workflows and voice recording techniques has allowed for greater flexibility and efficiency.
- The market's continuous growth is also reflected in the increasing complexity of production pipelines. Animation project management, asset creation pipeline, media asset management, and quality control process are now integral parts of the production workflow. Furthermore, the use of digital painting techniques, concept art creation, and storyboarding process has become standard practice in anime production. With the increasing demand for anime content and the continuous advancements in technology, the market is expected to continue growing in the coming years.
We can help! Our analysts can customize this anime market research report to meet your requirements.
 RIA -
RIA - 
