Anti-Caking Agents Market Analysis, Size, and Forecast 2024-2028: North America (Canada), Europe (France, Germany, Italy, and UK), Middle East and Africa (Egypt, KSA, Oman, and UAE), APAC (China, India, and Japan), South America (Argentina and Brazil), and Rest of World (ROW)

Anti-Caking Agents Market Analysis, Size, and Forecast 2024-2028:
North America (Canada), Europe (France, Germany, Italy, and UK), Middle East and Africa (Egypt, KSA, Oman, and UAE), APAC (China, India, and Japan), South America (Argentina and Brazil), and Rest of World (ROW)

Published: Oct 2024 137 Pages SKU: IRTNTR71343

Market Overview at a Glance

$300 Mn
Market Opportunity
5.9%
CAGR
5.5
YoY growth 2023-2024(%)

Anti-Caking Agents Market Size 2024-2028

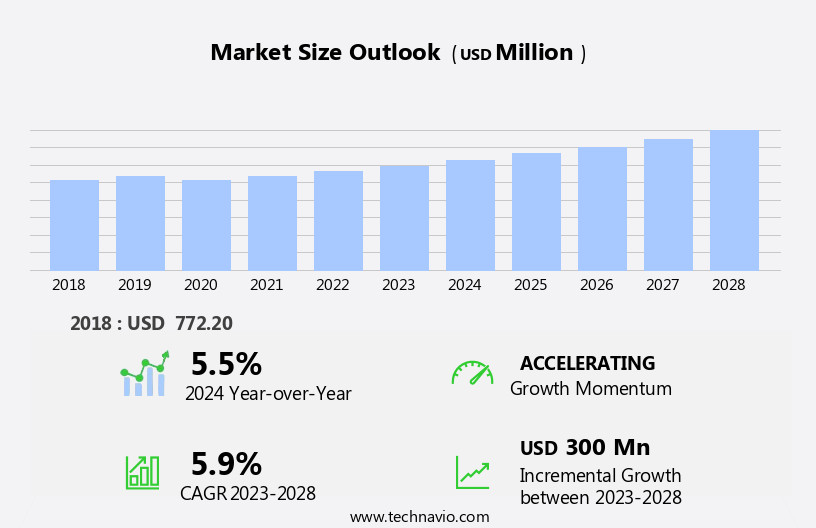
The anti-caking agents market size is forecast to increase by USD 300 million, at a CAGR of 5.9% between 2023 and 2028.

  • The market is driven by the increasing consumption of food ingredients in various industries, including food and beverages, pharmaceuticals, and agriculture. These agents prevent the formation of lumps and improve the flowability of powders, ensuring consistent product quality and reducing wastage. Additionally, the growing awareness about food safety in developed regions, particularly in Europe and North America, is fueling the demand for anti-caking agents in food applications. However, the market faces challenges from stringent government regulations, particularly in the European Union and the United States, which impose strict safety standards and limit the use of certain chemicals as anti-caking agents.
  • Companies must navigate these regulations to ensure compliance and maintain their market position. To capitalize on opportunities and overcome challenges, market participants should focus on innovation, developing natural and organic alternatives to synthetic anti-caking agents, and expanding their presence in emerging markets.

What will be the Size of the Anti-Caking Agents Market during the forecast period?

Anti-Caking Agents Market Size

Explore in-depth regional segment analysis with market size data - historical 2018-2022 and forecasts 2024-2028 - in the full report.  
Request Free Sample

The market continues to evolve, driven by the dynamic interplay of various factors. These include particle morphology, powder dispersion, and moisture content control, among others. In the realm of packaging optimization, the focus is on enhancing product flowability and reducing cohesion, thereby improving production efficiency. Coating process optimization is another key area of interest, with a view to ensuring uniformity and reducing dust generation. Bulk density measurement and sieving analysis play crucial roles in ensuring product consistency, while surface area analysis and additive selection are essential for optimizing the efficacy of anti-caking agents. Regulatory compliance is a constant concern, necessitating ongoing research and development in binder selection and compressibility index.

Moreover, the application method and ingredient interaction are critical factors in preventing caking and agglomeration. Granulation techniques, product shelf life, and pour flow rate are also key considerations in the production of free-flowing powders. Abrasion resistance and material handling efficiency are important in maintaining product quality during storage and transportation. The ongoing unfolding of market activities reveals a complex and interconnected web of factors shaping the market. From particle size distribution to coating uniformity, the focus is on continuous optimization and improvement. The evolving patterns in this market underscore the importance of staying abreast of the latest developments and trends.

How is this Anti-Caking Agents Industry segmented?

The anti-caking agents industry research report provides comprehensive data (region-wise segment analysis), with forecasts and estimates in "USD million" for the period 2024-2028, as well as historical data from 2018-2022 for the following segments.

  • Source
    • Synthetic
    • Natural
  • Type
    • Silicon Dioxide
    • Calcium Compounds
    • Sodium Compounds
    • Others
  • Application
    • Bakery Products
    • Dairy Products
    • Seasonings & Condiments
    • Table Salt
  • Distribution Channel
    • Business-to-Business
    • Supermarkets & Hypermarkets
    • Online Retail
    • Specialty Stores
  • Geography
    • North America
      • US
      • Canada
    • Europe
      • France
      • Germany
      • Italy
      • UK
    • Middle East and Africa
      • Egypt
      • KSA
      • Oman
      • UAE
    • APAC
      • China
      • India
      • Japan
    • South America
      • Argentina
      • Brazil
    • Rest of World (ROW)

By Source Insights

The synthetic segment is estimated to witness significant growth during the forecast period.

Synthetic anti-caking agents, derived from chemicals and other artificial substances like silicates and acids, dominate the global market due to their cost-effectiveness in bulk production. companies provide a range of synthetic options, such as calcium silicate, magnesium carbonate, and sodium aluminosilicate. These agents are essential in various food applications, including dairy products, bakery items, seasoning and condiments, soups and sauces, and more. Moisture content control is crucial in preventing caking and improving flowability. Synthetic anti-caking agents address this issue by reducing cohesion and enhancing dispersion. Regulatory compliance is another significant factor, with companies ensuring their products meet food safety standards.

Binder selection and compressibility index play a role in optimizing coating processes, while angle of repose and dust suppression address powder handling challenges. Angle of repose affects the ease of pouring, and dust suppression prevents particle dispersion during handling. Process optimization and material handling efficiency are essential for maintaining production efficiency. Abrasion resistance is another factor, ensuring the agents maintain their efficacy during transportation and storage. Surface area analysis and particle size distribution are crucial for ensuring consistent product quality. Anti-caking agents also impact product shelf life, with the right agent selection preventing caking and maintaining the desired consistency.

Application methods and agglomeration prevention techniques are essential for optimizing the use of these agents in various food manufacturing processes. Ingredient interaction and product consistency are crucial factors, with the right anti-caking agent ensuring the desired texture and taste in food products. Coating uniformity is another essential factor, with the right agent ensuring even coating during the manufacturing process. Quality control testing and coating uniformity are essential for maintaining product consistency and ensuring customer satisfaction. Pour flow rate and production efficiency are crucial for maintaining a competitive edge in the market. In summary, synthetic anti-caking agents play a vital role in the food industry, addressing various challenges in powder dispersion, moisture content control, regulatory compliance, and production efficiency.

Their ability to improve flowability, prevent caking, and maintain product consistency makes them an indispensable component in food manufacturing processes.

Anti-Caking Agents Market Size

Request Free Sample

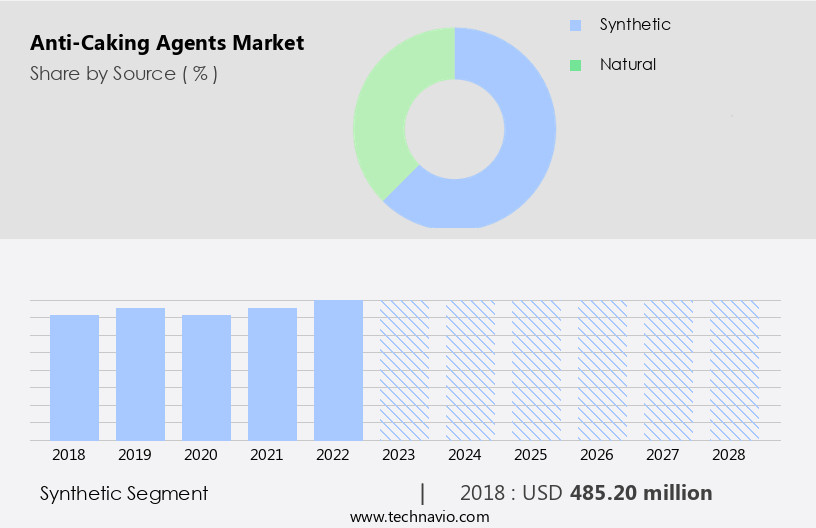
The Synthetic segment was valued at USD 485.20 million in 2018 and showed a gradual increase during the forecast period.

Regional Analysis

North America is estimated to contribute 34% to the growth of the global market during the forecast period.Technavio's analysts have elaborately explained the regional trends and drivers that shape the market during the forecast period.

Anti-Caking Agents Market Share by Geography

 Request Free Sample

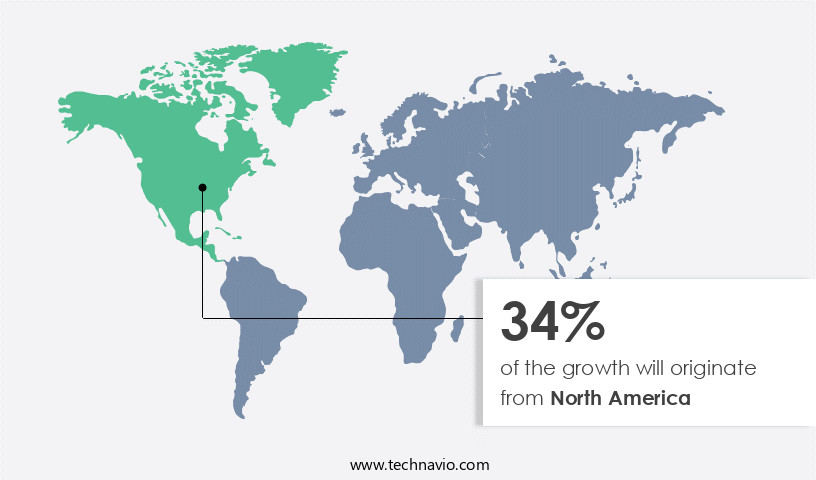
The market experiences significant activity and evolving trends, driven by various factors. In developed regions, such as North America, the market holds a substantial share, with the US and Canada being key contributors. The food and beverage industry's growth in these countries, particularly in bakery products, fuels market expansion. For instance, US bread production exports increased by 7.2% in 2020 compared to the previous year, with Canada importing 80% of these products. Effective moisture content control is crucial in the production process to prevent caking and improve flowability. Regulatory compliance is essential to ensure safety and quality, driving the demand for anti-caking agents.

Binder selection and particle morphology play a significant role in powder dispersion and product consistency. Coating process optimization and packaging optimization enhance product shelf life. Granulation techniques and ingredient interaction are essential considerations in the application method. Coating uniformity and particle size distribution are crucial factors in ensuring product consistency. Angle of repose, compressibility index, and surface area analysis help assess powder rheology and material handling efficiency. Dust suppression and abrasion resistance improve production efficiency and storage stability. Anti-caking agents' efficacy is determined by their ability to reduce cohesion and improve flowability. Pour flow rate, production efficiency, and quality control testing are essential factors in assessing their performance.

Abrasion resistance and material handling efficiency are crucial in the manufacturing process. In the global market, regulatory compliance, binder selection, and production efficiency are significant trends. Anti-caking agents' role in improving powder handling, process optimization, and product shelf life continues to gain importance. The market's future growth is expected to be driven by the increasing demand for free-flowing powders and the need for caking prevention in various industries.

Market Dynamics

The Global Anti-Caking Agents Market is experiencing robust anti-caking agents market growth, primarily driven by the surging demand for convenience foods and the need to maintain product quality. Food-grade anti-caking agents like silicon dioxide, calcium compounds, and magnesium compounds are essential for preventing clumping and ensuring powder flowability across various applications. Key segments such as seasonings and condiments, along with dairy products and bakery products, are major consumers. Current anti-caking agents market trends highlight a strong shift towards natural anti-caking agents and clean label anti-caking agents, reflecting evolving consumer preferences and stricter food safety regulations. Furthermore, significant new product development anti-caking agents is underway, with the Asia Pacific anti-caking agents market demonstrating substantial potential. The overall Global anti-caking agents market size continues to expand, impacting industries from food to fertilizers, necessitating efficient anti-caking agent production.

Our researchers analyzed the data with 2023 as the base year, along with the key drivers, trends, and challenges. A holistic analysis of drivers will help companies refine their marketing strategies to gain a competitive advantage.

What are the key market drivers leading to the rise in the adoption of Anti-Caking Agents Industry?

  • The significant increase in the consumption of food ingredients serves as the primary driver for the market's growth. 
  • The global food and beverage industry has witnessed significant growth in recent years, with an increasing number of applications and product innovations. The US Food and Drug Administration (FDA) maintains a database of over 3,000 food ingredients, catering to the diverse and evolving consumer preferences. The market for food ingredients is driven by several factors, including changing consumer tastes and the demand for high-quality food products. Some of the popular food ingredients include bakery premixes, milk and cream powder, instant soup powder, baking powder, yeast, and seasoning and spices. These ingredients not only enhance the taste and texture of food products but also ensure storage stability, which is crucial for maintaining product quality and safety.
  • The food and beverage industry's focus on innovation and product development has led to the introduction of various food coating ingredients, food premixes, and other additives. These ingredients not only improve the sensory attributes of food products but also extend their shelf life and ensure consistent quality. As a professional assistant, it is essential to maintain a formal and knowledgeable tone when discussing the food ingredients market. The market's growth is attributed to the increasing demand for convenience foods, the rising preference for natural and organic ingredients, and the growing trend of health and wellness.
  • The market is expected to continue its growth trajectory, driven by these trends and the increasing demand for high-quality food products.

What are the market trends shaping the Anti-Caking Agents Industry?

  • In developed regions, the growing concern for food safety is shaping the market trend. This increasing awareness signifies a significant opportunity for businesses focused on ensuring food safety and hygiene.
  • In the packaged food industry, anti-caking agents play a crucial role in ensuring the proper flowability and dispersion of powdered food products. These agents prevent the formation of lumps and caking, which can affect the overall quality and consumer experience. The particle morphology and moisture content of food powders are significant factors influencing the effectiveness of anti-caking agents. Regulatory compliance is another critical consideration, as these agents must meet specific safety and performance standards. Binder selection, compressibility index, angle of repose, and dust suppression are essential aspects of powder rheology that impact the functionality of anti-caking agents. Proper control of these factors can lead to improved powder dispersion and better product consistency.
  • Dust suppression is particularly important in preventing the generation of airborne particles, which can impact product quality and pose health risks. Anti-caking agents also contribute to the overall texture and mouthfeel of food products, making them an essential component of the formulation. As the demand for packaged food continues to grow, the importance of effective anti-caking agents in maintaining product quality and ensuring consumer satisfaction is increasingly recognized.

What challenges does the Anti-Caking Agents Industry face during its growth?

  • Government regulations pose a significant challenge to the growth of the industry. With increasing regulatory requirements, businesses must navigate complex compliance frameworks to ensure they remain in accordance with the law. This can result in additional costs, time, and resources being allocated to regulatory compliance efforts, potentially hindering growth opportunities. 
  • Anti-caking agents are essential additives used in various industries, including food, pharmaceuticals, and chemicals, to improve flowability and prevent clumping. In the global market, companies must adhere to regulatory bodies' guidelines to ensure product safety and quality. For instance, in India, the Food Safety and Standards Authority of India (FSSAI) regulates the usage of anti-caking agents in food products. The FSSAI's Food Safety and Standards (Food Products Standards and Food Additives) Regulations, 2011, set the permissible levels for anti-caking agents in table salt, onion powder, garlic powder, fruit powder, and soup powder, not exceeding 2%. Manufacturers aim to optimize packaging and coating processes to enhance the effectiveness of anti-caking agents.
  • Bulk density measurement, sieving analysis, cohesion reduction, production efficiency, surface area analysis, and additive selection are crucial factors in the production process. By focusing on these aspects, companies can ensure the desired outcome while maintaining regulatory compliance and improving overall product quality.

Exclusive Customer Landscape

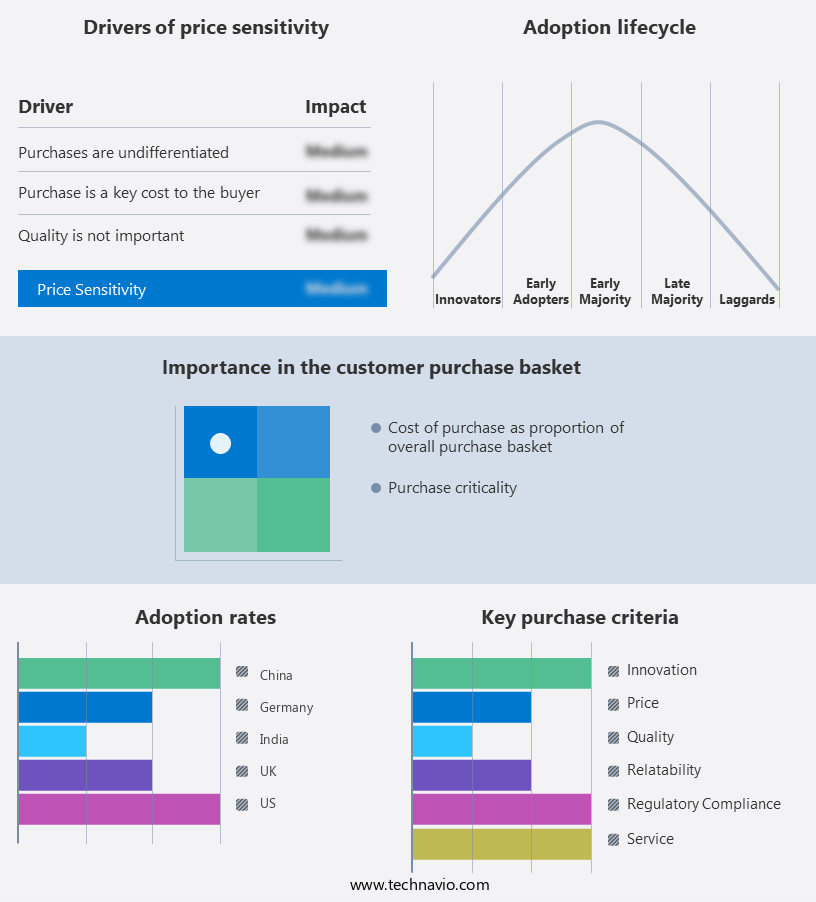
The anti-caking agents market forecasting report includes the adoption lifecycle of the market, covering from the innovator's stage to the laggard's stage. It focuses on adoption rates in different regions based on penetration. Furthermore, the anti-caking agents market report also includes key purchase criteria and drivers of price sensitivity to help companies evaluate and develop their market growth analysis strategies.

Anti-Caking Agents Market Share by Geography

 Customer Landscape

Key Companies & Market Insights

Companies are implementing various strategies, such as strategic alliances, anti-caking agents market forecast, partnerships, mergers and acquisitions, geographical expansion, and product/service launches, to enhance their presence in the industry.

Agropur Dairy Cooperative - AgroPur specializes in providing anti-caking agents to address the diverse challenges in cheese production, such as particle barrier, dust, shelf life, and clumping issues. These agents cater to various packaging types, cheese formats, and customer groups, enhancing product quality and consistency.

The industry research and growth report includes detailed analyses of the competitive landscape of the market and information about key companies, including:

  • Agropur Dairy Cooperative
  • BASF SE
  • Bogdany Petrol Ltd.
  • BRENNTAG SE
  • Cabot Corp.
  • Chemipol SA
  • Evonik Industries AG
  • Fuji Chemical Industries Co. Ltd.
  • J.M. Huber Corp.
  • JELU WERK J. Ehrler GmbH and Co. KG
  • Jinsha Precipitated Silica Manufacturing Co. Ltd.
  • Kao Corp.
  • Merck KGaA
  • Norkem Ltd.
  • Polwax S.A.
  • PPG Industries Inc.
  • PQ Group Holdings Inc.
  • Roquette Freres SA
  • Solvay SA
  • Sweetener Supply Corp.

Qualitative and quantitative analysis of companies has been conducted to help clients understand the wider business environment as well as the strengths and weaknesses of key industry players. Data is qualitatively analyzed to categorize companies as pure play, category-focused, industry-focused, and diversified; it is quantitatively analyzed to categorize companies as dominant, leading, strong, tentative, and weak.

Recent Development and News in Anti-Caking Agents Market

  • In January 2024, DuPont Nutrition & Biosciences announced the expansion of its Capstone facility in Iowa, USA, to increase production capacity of its anti-caking agents, including Aqualon and Carboxymethyl Cellulose (CMC) products. This expansion aimed to meet the growing demand for these products in various industries, including food, beverages, and pharmaceuticals (DuPont Press Release, 2024).
  • In March 2024, Ashland Global Holdings Inc. And Ingredion Incorporated entered into a definitive agreement for Ashland to acquire Ingredion's specialty ingredients business. This acquisition included Ashland's acquisition of Ingredion's food and beverage applications of its anticaking agent, Maltodextrin, expanding Ashland's product portfolio and market reach (Ashland Press Release, 2024).
  • In May 2024, Clariant International AG, a leading specialty chemical company, completed the acquisition of Huntsman Corporation's functional ingredients business. This acquisition included the addition of Huntsman's anticaking agent, Calcium Stearate, to Clariant's product portfolio, enhancing their position in the market and providing a broader range of offerings to their customers (Clariant Press Release, 2024).
  • In April 2025, the European Food Safety Authority (EFSA) reaffirmed the safety of using Silicon Dioxide as an anti-caking agent in food and food supplements. This approval came after a comprehensive review of the available scientific data and supported the continued use of this ingredient in various food applications (EFSA Press Release, 2025).

Research Analyst Overview

  • The market exhibits long-term stability due to the increasing demand for bulk solid handling in various industries, including food and pharmaceuticals. Performance testing plays a crucial role in ensuring the effectiveness of these additives, with food grade anti-caking agents undergoing rigorous safety standards and regulatory requirements. Material selection is a key consideration in the manufacturing process, with particle engineering and improved product quality essential for enhancing rheological properties and additive compatibility. Cost-effective solutions and application techniques are also vital for process control and quality assurance measures.
  • Stability study, powder characterization, and powder processing are essential for ensuring efficient processing and formulation development, while chemical properties and material flow are crucial factors in performance improvement. Safety standards and regulatory requirements continue to evolve, necessitating ongoing research and development in this field.

Dive into Technavio's robust research methodology, blending expert interviews, extensive data synthesis, and validated models for unparalleled Anti-Caking Agents Market insights. See full methodology.

Market Scope

Report Coverage

Details

Page number

137

Base year

2023

Historic period

2018-2022

Forecast period

2024-2028

Growth momentum & CAGR

Accelerate at a CAGR of 5.9%

Market growth 2024-2028

USD 300 million

Market structure

Fragmented

YoY growth 2023-2024(%)

5.5

Key countries

US, Canada, Germany, UK, Italy, France, China, India, Japan, Brazil, Egypt, UAE, Oman, Argentina, KSA, UAE, Brazil, and Rest of World (ROW)

Competitive landscape

Leading Companies, Market Positioning of Companies, Competitive Strategies, and Industry Risks

Request Free Sample

What are the Key Data Covered in this Anti-Caking Agents Market Research and Growth Report?

  • CAGR of the Anti-Caking Agents industry during the forecast period
  • Detailed information on factors that will drive the growth and forecasting between 2024 and 2028
  • Precise estimation of the size of the market and its contribution of the industry in focus to the parent market
  • Accurate predictions about upcoming growth and trends and changes in consumer behaviour
  • Growth of the market across North America, APAC, Europe, South America, and Middle East and Africa
  • Thorough analysis of the market's competitive landscape and detailed information about companies
  • Comprehensive analysis of factors that will challenge the anti-caking agents market growth of industry companies

We can help! Our analysts can customize this anti-caking agents market research report to meet your requirements.

Get in touch

1 Executive Summary

  • 1.1 Market overview
    • Executive Summary - Chart on Market Overview
    • Executive Summary - Data Table on Market Overview
    • Executive Summary - Chart on Global Market Characteristics
    • Executive Summary - Chart on Market by Geography
    • Executive Summary - Chart on Market Segmentation by Source
    • Executive Summary - Chart on Incremental Growth
    • Executive Summary - Data Table on Incremental Growth
    • Executive Summary - Chart on Company Market Positioning

2 Market Landscape

  • 2.1 Market ecosystem
    • Parent Market
    • Data Table on - Parent Market
  • 2.2 Market characteristics
    • Market characteristics analysis
  • 2.3 Value chain analysis
    • Value Chain Analysis

3 Market Sizing

  • 3.1 Market definition
    • Offerings of companies included in the market definition
  • 3.2 Market segment analysis
    • Market segments
  • 3.3 Market size 2023
    • 3.4 Market outlook: Forecast for 2023-2028
      • Chart on Global - Market size and forecast 2023-2028 ($ million)
      • Data Table on Global - Market size and forecast 2023-2028 ($ million)
      • Chart on Global Market: Year-over-year growth 2023-2028 (%)
      • Data Table on Global Market: Year-over-year growth 2023-2028 (%)

    4 Historic Market Size

    • 4.1 Global Anti-Caking Agents Market 2018 - 2022
      • Historic Market Size - Data Table on Global Anti-Caking Agents Market 2018 - 2022 ($ million)
    • 4.2 Source segment analysis 2018 - 2022
      • Historic Market Size - Source Segment 2018 - 2022 ($ million)
    • 4.3 Geography segment analysis 2018 - 2022
      • Historic Market Size - Geography Segment 2018 - 2022 ($ million)
    • 4.4 Country segment analysis 2018 - 2022
      • Historic Market Size - Country Segment 2018 - 2022 ($ million)

    5 Five Forces Analysis

    • 5.1 Five forces summary
      • Five forces analysis - Comparison between 2023 and 2028
    • 5.2 Bargaining power of buyers
      • Bargaining power of buyers - Impact of key factors 2023 and 2028
    • 5.3 Bargaining power of suppliers
      • Bargaining power of suppliers - Impact of key factors in 2023 and 2028
    • 5.4 Threat of new entrants
      • Threat of new entrants - Impact of key factors in 2023 and 2028
    • 5.5 Threat of substitutes
      • Threat of substitutes - Impact of key factors in 2023 and 2028
    • 5.6 Threat of rivalry
      • Threat of rivalry - Impact of key factors in 2023 and 2028
    • 5.7 Market condition
      • Chart on Market condition - Five forces 2023 and 2028

    6 Market Segmentation by Source

    • 6.1 Market segments
      • Chart on Source - Market share (2023-2028) (%)
      • Data Table on Source - Market share (2023-2028) (%)
    • 6.2 Comparison by Source
      • Chart on Comparison by Source
      • Data Table on Comparison by Source
    • 6.3 Synthetic - Market size and forecast (2023-2028)
      • Chart on Synthetic - Market size and forecast (2023-2028) ($ million)
      • Data Table on Synthetic - Market size and forecast (2023-2028) ($ million)
      • Chart on Synthetic - Year-over-year growth (2023-2028) (%)
      • Data Table on Synthetic - Year-over-year growth (2023-2028) (%)
    • 6.4 Natural - Market size and forecast (2023-2028)
      • Chart on Natural - Market size and forecast (2023-2028) ($ million)
      • Data Table on Natural - Market size and forecast (2023-2028) ($ million)
      • Chart on Natural - Year-over-year growth (2023-2028) (%)
      • Data Table on Natural - Year-over-year growth (2023-2028) (%)
    • 6.5 Market opportunity by Source
      • Market opportunity by Source ($ million)
      • Data Table on Market opportunity by Source ($ million)

    7 Market Segmentation by Type

    • 7.1 Market segments
      • Chart on Type - Market share (2023-2028) (%)
      • Data Table on Type - Market share (2023-2028) (%)
    • 7.2 Comparison by Type
      • Chart on Comparison by Type
      • Data Table on Comparison by Type
    • 7.3 Silicon Dioxide - Market size and forecast (2023-2028)
      • Chart on Silicon Dioxide - Market size and forecast (2023-2028) ($ million)
      • Data Table on Silicon Dioxide - Market size and forecast (2023-2028) ($ million)
      • Chart on Silicon Dioxide - Year-over-year growth (2023-2028) (%)
      • Data Table on Silicon Dioxide - Year-over-year growth (2023-2028) (%)
    • 7.4 Calcium Compounds - Market size and forecast (2023-2028)
      • Chart on Calcium Compounds - Market size and forecast (2023-2028) ($ million)
      • Data Table on Calcium Compounds - Market size and forecast (2023-2028) ($ million)
      • Chart on Calcium Compounds - Year-over-year growth (2023-2028) (%)
      • Data Table on Calcium Compounds - Year-over-year growth (2023-2028) (%)
    • 7.5 Sodium Compounds - Market size and forecast (2023-2028)
      • Chart on Sodium Compounds - Market size and forecast (2023-2028) ($ million)
      • Data Table on Sodium Compounds - Market size and forecast (2023-2028) ($ million)
      • Chart on Sodium Compounds - Year-over-year growth (2023-2028) (%)
      • Data Table on Sodium Compounds - Year-over-year growth (2023-2028) (%)
    • 7.6 Others - Market size and forecast (2023-2028)
      • Chart on Others - Market size and forecast (2023-2028) ($ million)
      • Data Table on Others - Market size and forecast (2023-2028) ($ million)
      • Chart on Others - Year-over-year growth (2023-2028) (%)
      • Data Table on Others - Year-over-year growth (2023-2028) (%)
    • 7.7 Market opportunity by Type
      • Market opportunity by Type ($ million)
      • Data Table on Market opportunity by Type ($ million)

    8 Market Segmentation by Application

    • 8.1 Market segments
      • Chart on Application - Market share (2023-2028) (%)
      • Data Table on Application - Market share (2023-2028) (%)
    • 8.2 Comparison by Application
      • Chart on Comparison by Application
      • Data Table on Comparison by Application
    • 8.3 Bakery Products - Market size and forecast (2023-2028)
      • Chart on Bakery Products - Market size and forecast (2023-2028) ($ million)
      • Data Table on Bakery Products - Market size and forecast (2023-2028) ($ million)
      • Chart on Bakery Products - Year-over-year growth (2023-2028) (%)
      • Data Table on Bakery Products - Year-over-year growth (2023-2028) (%)
    • 8.4 Dairy Products - Market size and forecast (2023-2028)
      • Chart on Dairy Products - Market size and forecast (2023-2028) ($ million)
      • Data Table on Dairy Products - Market size and forecast (2023-2028) ($ million)
      • Chart on Dairy Products - Year-over-year growth (2023-2028) (%)
      • Data Table on Dairy Products - Year-over-year growth (2023-2028) (%)
    • 8.5 Seasonings & Condiments - Market size and forecast (2023-2028)
      • Chart on Seasonings & Condiments - Market size and forecast (2023-2028) ($ million)
      • Data Table on Seasonings & Condiments - Market size and forecast (2023-2028) ($ million)
      • Chart on Seasonings & Condiments - Year-over-year growth (2023-2028) (%)
      • Data Table on Seasonings & Condiments - Year-over-year growth (2023-2028) (%)
    • 8.6 Table Salt - Market size and forecast (2023-2028)
      • Chart on Table Salt - Market size and forecast (2023-2028) ($ million)
      • Data Table on Table Salt - Market size and forecast (2023-2028) ($ million)
      • Chart on Table Salt - Year-over-year growth (2023-2028) (%)
      • Data Table on Table Salt - Year-over-year growth (2023-2028) (%)
    • 8.7 Market opportunity by Application
      • Market opportunity by Application ($ million)
      • Data Table on Market opportunity by Application ($ million)

    9 Market Segmentation by Distribution Channel

    • 9.1 Market segments
      • Chart on Distribution Channel - Market share (2023-2028) (%)
      • Data Table on Distribution Channel - Market share (2023-2028) (%)
    • 9.2 Comparison by Distribution Channel
      • Chart on Comparison by Distribution Channel
      • Data Table on Comparison by Distribution Channel
    • 9.3 Business-to-Business - Market size and forecast (2023-2028)
      • Chart on Business-to-Business - Market size and forecast (2023-2028) ($ million)
      • Data Table on Business-to-Business - Market size and forecast (2023-2028) ($ million)
      • Chart on Business-to-Business - Year-over-year growth (2023-2028) (%)
      • Data Table on Business-to-Business - Year-over-year growth (2023-2028) (%)
    • 9.4 Supermarkets & Hypermarkets - Market size and forecast (2023-2028)
      • Chart on Supermarkets & Hypermarkets - Market size and forecast (2023-2028) ($ million)
      • Data Table on Supermarkets & Hypermarkets - Market size and forecast (2023-2028) ($ million)
      • Chart on Supermarkets & Hypermarkets - Year-over-year growth (2023-2028) (%)
      • Data Table on Supermarkets & Hypermarkets - Year-over-year growth (2023-2028) (%)
    • 9.5 Online Retail - Market size and forecast (2023-2028)
      • Chart on Online Retail - Market size and forecast (2023-2028) ($ million)
      • Data Table on Online Retail - Market size and forecast (2023-2028) ($ million)
      • Chart on Online Retail - Year-over-year growth (2023-2028) (%)
      • Data Table on Online Retail - Year-over-year growth (2023-2028) (%)
    • 9.6 Specialty Stores - Market size and forecast (2023-2028)
      • Chart on Specialty Stores - Market size and forecast (2023-2028) ($ million)
      • Data Table on Specialty Stores - Market size and forecast (2023-2028) ($ million)
      • Chart on Specialty Stores - Year-over-year growth (2023-2028) (%)
      • Data Table on Specialty Stores - Year-over-year growth (2023-2028) (%)
    • 9.7 Market opportunity by Distribution Channel
      • Market opportunity by Distribution Channel ($ million)
      • Data Table on Market opportunity by Distribution Channel ($ million)

    10 Customer Landscape

    • 10.1 Customer landscape overview
      • Analysis of price sensitivity, lifecycle, customer purchase basket, adoption rates, and purchase criteria

    11 Geographic Landscape

    • 11.1 Geographic segmentation
      • Chart on Market share by geography 2023-2028 (%)
      • Data Table on Market share by geography 2023-2028 (%)
    • 11.2 Geographic comparison
      • Chart on Geographic comparison
      • Data Table on Geographic comparison
    • 11.3 North America - Market size and forecast 2023-2028
      • Chart on North America - Market size and forecast 2023-2028 ($ million)
      • Data Table on North America - Market size and forecast 2023-2028 ($ million)
      • Chart on North America - Year-over-year growth 2023-2028 (%)
      • Data Table on North America - Year-over-year growth 2023-2028 (%)
    • 11.4 APAC - Market size and forecast 2023-2028
      • Chart on APAC - Market size and forecast 2023-2028 ($ million)
      • Data Table on APAC - Market size and forecast 2023-2028 ($ million)
      • Chart on APAC - Year-over-year growth 2023-2028 (%)
      • Data Table on APAC - Year-over-year growth 2023-2028 (%)
    • 11.5 Europe - Market size and forecast 2023-2028
      • Chart on Europe - Market size and forecast 2023-2028 ($ million)
      • Data Table on Europe - Market size and forecast 2023-2028 ($ million)
      • Chart on Europe - Year-over-year growth 2023-2028 (%)
      • Data Table on Europe - Year-over-year growth 2023-2028 (%)
    • 11.6 South America - Market size and forecast 2023-2028
      • Chart on South America - Market size and forecast 2023-2028 ($ million)
      • Data Table on South America - Market size and forecast 2023-2028 ($ million)
      • Chart on South America - Year-over-year growth 2023-2028 (%)
      • Data Table on South America - Year-over-year growth 2023-2028 (%)
    • 11.7 Middle East and Africa - Market size and forecast 2023-2028
      • Chart on Middle East and Africa - Market size and forecast 2023-2028 ($ million)
      • Data Table on Middle East and Africa - Market size and forecast 2023-2028 ($ million)
      • Chart on Middle East and Africa - Year-over-year growth 2023-2028 (%)
      • Data Table on Middle East and Africa - Year-over-year growth 2023-2028 (%)
    • 11.8 US - Market size and forecast 2023-2028
      • Chart on US - Market size and forecast 2023-2028 ($ million)
      • Data Table on US - Market size and forecast 2023-2028 ($ million)
      • Chart on US - Year-over-year growth 2023-2028 (%)
      • Data Table on US - Year-over-year growth 2023-2028 (%)
    • 11.9 China - Market size and forecast 2023-2028
      • Chart on China - Market size and forecast 2023-2028 ($ million)
      • Data Table on China - Market size and forecast 2023-2028 ($ million)
      • Chart on China - Year-over-year growth 2023-2028 (%)
      • Data Table on China - Year-over-year growth 2023-2028 (%)
    • 11.10 India - Market size and forecast 2023-2028
      • Chart on India - Market size and forecast 2023-2028 ($ million)
      • Data Table on India - Market size and forecast 2023-2028 ($ million)
      • Chart on India - Year-over-year growth 2023-2028 (%)
      • Data Table on India - Year-over-year growth 2023-2028 (%)
    • 11.11 Germany - Market size and forecast 2023-2028
      • Chart on Germany - Market size and forecast 2023-2028 ($ million)
      • Data Table on Germany - Market size and forecast 2023-2028 ($ million)
      • Chart on Germany - Year-over-year growth 2023-2028 (%)
      • Data Table on Germany - Year-over-year growth 2023-2028 (%)
    • 11.12 UK - Market size and forecast 2023-2028
      • Chart on UK - Market size and forecast 2023-2028 ($ million)
      • Data Table on UK - Market size and forecast 2023-2028 ($ million)
      • Chart on UK - Year-over-year growth 2023-2028 (%)
      • Data Table on UK - Year-over-year growth 2023-2028 (%)
    • 11.13 Market opportunity by geography
      • Market opportunity by geography ($ million)
      • Data Tables on Market opportunity by geography ($ million)
    • 11.14 US - Market size and forecast (2023-2028)
      • Chart on US - Market size and forecast (2023-2028) ($ million)
      • Data Table on US - Market size and forecast (2023-2028) ($ million)
      • Chart on US - Year-over-year growth (2023-2028) (%)
      • Data Table on US - Year-over-year growth (2023-2028) (%)
    • 11.15 Canada - Market size and forecast (2023-2028)
      • Chart on Canada - Market size and forecast (2023-2028) ($ million)
      • Data Table on Canada - Market size and forecast (2023-2028) ($ million)
      • Chart on Canada - Year-over-year growth (2023-2028) (%)
      • Data Table on Canada - Year-over-year growth (2023-2028) (%)
    • 11.16 Italy - Market size and forecast (2023-2028)
      • Chart on Italy - Market size and forecast (2023-2028) ($ million)
      • Data Table on Italy - Market size and forecast (2023-2028) ($ million)
      • Chart on Italy - Year-over-year growth (2023-2028) (%)
      • Data Table on Italy - Year-over-year growth (2023-2028) (%)
    • 11.17 France - Market size and forecast (2023-2028)
      • Chart on France - Market size and forecast (2023-2028) ($ million)
      • Data Table on France - Market size and forecast (2023-2028) ($ million)
      • Chart on France - Year-over-year growth (2023-2028) (%)
      • Data Table on France - Year-over-year growth (2023-2028) (%)
    • 11.18 Japan - Market size and forecast (2023-2028)
      • Chart on Japan - Market size and forecast (2023-2028) ($ million)
      • Data Table on Japan - Market size and forecast (2023-2028) ($ million)
      • Chart on Japan - Year-over-year growth (2023-2028) (%)
      • Data Table on Japan - Year-over-year growth (2023-2028) (%)
    • 11.19 Brazil - Market size and forecast (2023-2028)
      • Chart on Brazil - Market size and forecast (2023-2028) ($ million)
      • Data Table on Brazil - Market size and forecast (2023-2028) ($ million)
      • Chart on Brazil - Year-over-year growth (2023-2028) (%)
      • Data Table on Brazil - Year-over-year growth (2023-2028) (%)
    • 11.20 Egypt - Market size and forecast (2023-2028)
      • Chart on Egypt - Market size and forecast (2023-2028) ($ million)
      • Data Table on Egypt - Market size and forecast (2023-2028) ($ million)
      • Chart on Egypt - Year-over-year growth (2023-2028) (%)
      • Data Table on Egypt - Year-over-year growth (2023-2028) (%)
    • 11.21 UAE - Market size and forecast (2023-2028)
      • Chart on UAE - Market size and forecast (2023-2028) ($ million)
      • Data Table on UAE - Market size and forecast (2023-2028) ($ million)
      • Chart on UAE - Year-over-year growth (2023-2028) (%)
      • Data Table on UAE - Year-over-year growth (2023-2028) (%)
    • 11.22 Oman - Market size and forecast (2023-2028)
      • Chart on Oman - Market size and forecast (2023-2028) ($ million)
      • Data Table on Oman - Market size and forecast (2023-2028) ($ million)
      • Chart on Oman - Year-over-year growth (2023-2028) (%)
      • Data Table on Oman - Year-over-year growth (2023-2028) (%)
    • 11.23 Argentina - Market size and forecast (2023-2028)
      • Chart on Argentina - Market size and forecast (2023-2028) ($ million)
      • Data Table on Argentina - Market size and forecast (2023-2028) ($ million)
      • Chart on Argentina - Year-over-year growth (2023-2028) (%)
      • Data Table on Argentina - Year-over-year growth (2023-2028) (%)
    • 11.24 KSA - Market size and forecast (2023-2028)
      • Chart on KSA - Market size and forecast (2023-2028) ($ million)
      • Data Table on KSA - Market size and forecast (2023-2028) ($ million)
      • Chart on KSA - Year-over-year growth (2023-2028) (%)
      • Data Table on KSA - Year-over-year growth (2023-2028) (%)
    • 11.25 Rest of World (ROW) - Market size and forecast (2023-2028)
      • Chart on Rest of World (ROW) - Market size and forecast (2023-2028) ($ million)
      • Data Table on Rest of World (ROW) - Market size and forecast (2023-2028) ($ million)
      • Chart on Rest of World (ROW) - Year-over-year growth (2023-2028) (%)
      • Data Table on Rest of World (ROW) - Year-over-year growth (2023-2028) (%)

    12 Drivers, Challenges, and Opportunity/Restraints

    • 12.1 Market drivers
      • 12.2 Market challenges
        • 12.3 Impact of drivers and challenges
          • Impact of drivers and challenges in 2023 and 2028
        • 12.4 Market opportunities/restraints

          13 Competitive Landscape

          • 13.1 Overview
            • 13.2 Competitive Landscape
              • Overview on criticality of inputs and factors of differentiation
            • 13.3 Landscape disruption
              • Overview on factors of disruption
            • 13.4 Industry risks
              • Impact of key risks on business

            14 Competitive Analysis

            • 14.1 Companies profiled
              • Companies covered
            • 14.2 Market positioning of companies
              • Matrix on companies position and classification
            • 14.3 Agropur Dairy Cooperative
              • Agropur Dairy Cooperative - Overview
              • Agropur Dairy Cooperative - Product / Service
              • Agropur Dairy Cooperative - Key offerings
            • 14.4 BASF SE
              • BASF SE - Overview
              • BASF SE - Business segments
              • BASF SE - Key news
              • BASF SE - Key offerings
              • BASF SE - Segment focus
            • 14.5 Chemipol SA
              • Chemipol SA - Overview
              • Chemipol SA - Product / Service
              • Chemipol SA - Key offerings
            • 14.6 Evonik Industries AG
              • Evonik Industries AG - Overview
              • Evonik Industries AG - Business segments
              • Evonik Industries AG - Key news
              • Evonik Industries AG - Key offerings
              • Evonik Industries AG - Segment focus
            • 14.7 Jinsha Precipitated Silica Manufacturing Co. Ltd.
              • Jinsha Precipitated Silica Manufacturing Co. Ltd. - Overview
              • Jinsha Precipitated Silica Manufacturing Co. Ltd. - Product / Service
              • Jinsha Precipitated Silica Manufacturing Co. Ltd. - Key offerings
            • 14.8 Kao Corp.
              • Kao Corp. - Overview
              • Kao Corp. - Business segments
              • Kao Corp. - Key news
              • Kao Corp. - Key offerings
              • Kao Corp. - Segment focus
            • 14.9 PPG Industries Inc.
              • PPG Industries Inc. - Overview
              • PPG Industries Inc. - Business segments
              • PPG Industries Inc. - Key news
              • PPG Industries Inc. - Key offerings
              • PPG Industries Inc. - Segment focus
            • 14.10 PQ Group Holdings Inc.
              • PQ Group Holdings Inc. - Overview
              • PQ Group Holdings Inc. - Product / Service
              • PQ Group Holdings Inc. - Key news
              • PQ Group Holdings Inc. - Key offerings
            • 14.11 Roquette Freres SA
              • Roquette Freres SA - Overview
              • Roquette Freres SA - Product / Service
              • Roquette Freres SA - Key offerings
            • 14.12 Sweetener Supply Corp.
              • Sweetener Supply Corp. - Overview
              • Sweetener Supply Corp. - Product / Service
              • Sweetener Supply Corp. - Key offerings

            15 Appendix

            • 15.1 Scope of the report
              • 15.2 Inclusions and exclusions checklist
                • Inclusions checklist
                • Exclusions checklist
              • 15.3 Currency conversion rates for US$
                • Currency conversion rates for US$
              • 15.4 Research methodology
                • Research methodology
              • 15.5 Data procurement
                • Information sources
              • 15.6 Data validation
                • Data validation
              • 15.7 Validation techniques employed for market sizing
                • Validation techniques employed for market sizing
              • 15.8 Data synthesis
                • Data synthesis
              • 15.9 360 degree market analysis
                • 360 degree market analysis
              • 15.10 List of abbreviations
                • List of abbreviations

              Research Methodology

              Technavio presents a detailed picture of the market by way of study, synthesis, and summation of data from multiple sources. The analysts have presented the various facets of the market with a particular focus on identifying the key industry influencers. The data thus presented is comprehensive, reliable, and the result of extensive research, both primary and secondary.

              INFORMATION SOURCES

              Primary sources

              • Manufacturers and suppliers
              • Channel partners
              • Industry experts
              • Strategic decision makers

              Secondary sources

              • Industry journals and periodicals
              • Government data
              • Financial reports of key industry players
              • Historical data
              • Press releases

              DATA ANALYSIS

              Data Synthesis

              • Collation of data
              • Estimation of key figures
              • Analysis of derived insights

              Data Validation

              • Triangulation with data models
              • Reference against proprietary databases
              • Corroboration with industry experts

              REPORT WRITING

              Qualitative

              • Market drivers
              • Market challenges
              • Market trends
              • Five forces analysis

              Quantitative

              • Market size and forecast
              • Market segmentation
              • Geographical insights
              • Competitive landscape

              Interested in this report?

              Get your sample now to see our research methodology and insights!

              Download Now

              Frequently Asked Questions

              Anti-Caking Agents market growth will increase by $ 300 mn during 2024-2028.

              The Anti-Caking Agents market is expected to grow at a CAGR of 5.9% during 2024-2028.

              Anti-Caking Agents market is segmented by Source( Synthetic, Natural) Type( Silicon Dioxide, Calcium Compounds, Sodium Compounds, Others)

              Agropur Dairy Cooperative, BASF SE, Bogdany Petrol Ltd., BRENNTAG SE, Cabot Corp., Chemipol SA, Evonik Industries AG, Fuji Chemical Industries Co. Ltd., J.M. Huber Corp., JELU WERK J. Ehrler GmbH and Co. KG, Jinsha Precipitated Silica Manufacturing Co. Ltd., Kao Corp., Merck KGaA, Norkem Ltd., Polwax S.A., PPG Industries Inc., PQ Group Holdings Inc., Roquette Freres SA, Solvay SA, Sweetener Supply Corp. are a few of the key vendors in the Anti-Caking Agents market.

              North America will register the highest growth rate of 34% among the other regions. Therefore, the Anti-Caking Agents market in North America is expected to garner significant business opportunities for the vendors during the forecast period.

              US, Canada, Germany, UK, Italy, France, China, India, Japan, Brazil, Egypt, UAE, Oman, Argentina, KSA, UAE, Brazil, Rest of World (ROW)

              • Rising consumption of food ingredientsThere has been an increase in the number of food applications in the years. There are diverse and a variety of food and beverage products that are now available for consumption. In the US is the driving factor this market.
              • the Food and Drug Administration (FDA) maintains a list of over 3 is the driving factor this market.
              • 000 food ingredients in its database. The changing consumer tastes and the growing preference for consuming high-quality food products have created a demand for and innovation of various food ingredients. These include food and beverage premixes is the driving factor this market.
              • food coating ingredients is the driving factor this market.
              • and others. There is a rising consumption of food ingredients such as bakery premixes is the driving factor this market.
              • milk and cream powder is the driving factor this market.
              • instant soup powder is the driving factor this market.
              • baking powder is the driving factor this market.
              • yeast is the driving factor this market.
              • seasoning and spices is the driving factor this market.
              • and others. This leads to an increased application of anti-caking agents in food ingredients to provide them with a longer shelf-life.For instance is the driving factor this market.
              • vendors in the market offer calcium potassium or sodium ferrocyanide is the driving factor this market.
              • which can be used as anti-caking agents in common salt is the driving factor this market.
              • iodized salt is the driving factor this market.
              • and iron-fortified salt. Powdered cellulose is used in shredded cheeses to reduce clumping. Silicon dioxide is used in dry products such as shredded cheese is the driving factor this market.
              • dried eggs is the driving factor this market.
              • powdered mixes is the driving factor this market.
              • and spices. Calcium silicate prevents caking in baking powder is the driving factor this market.
              • salt is the driving factor this market.
              • and dry mixes. It absorbs oil and water and can be used to contain free oils in spices. Aluminum silicate is often used in sugars is the driving factor this market.
              • salts is the driving factor this market.
              • and supplements. Additionally is the driving factor this market.
              • vendors offer anti-caking agents that are multi-functional compounds and offer the properties of anti-caking agents is the driving factor this market.
              • sweeteners is the driving factor this market.
              • binders is the driving factor this market.
              • and stabilizers. Some of these include mannitol is the driving factor this market.
              • alpha-cellulose is the driving factor this market.
              • and microcrystalline cellulose. With the growing number of food ingredients is the driving factor this market.
              • the usage of anti-caking agents for these ingredients has increased. The growth in the consumption of various food ingredients and products is expected to have a positive impact on the demand for anti-caking agents due to their long shelf-life is the driving factor this market.
              • lubricating is the driving factor this market.
              • free-flow is the driving factor this market.
              • and other properties. As a result is the driving factor this market.
              • the increasing consumption of various food ingredients is expected to drive the growth of the global anti-caking agents market during the forecast period. is the driving factor this market.

              The Anti-Caking Agents market vendors should focus on grabbing business opportunities from the Synthetic segment as it accounted for the largest market share in the base year.