Biopolymer Packaging Market Analysis, Size, and Forecast 2026-2030: APAC (China, Japan, and India), North America (US, Canada, and Mexico), Europe (Germany, UK, and France), South America (Brazil, Argentina, and Colombia), Middle East and Africa (Saudi Arabia, UAE, and South Africa), and Rest of World (ROW)

Biopolymer Packaging Market Analysis, Size, and Forecast 2026-2030:
APAC (China, Japan, and India), North America (US, Canada, and Mexico), Europe (Germany, UK, and France), South America (Brazil, Argentina, and Colombia), Middle East and Africa (Saudi Arabia, UAE, and South Africa), and Rest of World (ROW)

Published: Jan 2026 288 Pages SKU: IRTNTR72044

Market Overview at a Glance

$9.78 B
Market Opportunity
15.6%
CAGR 2025 - 2030
64.2%
APAC Growth
$5.60 B
Biodegradable segment 2024

Biopolymer Packaging Market Size 2026-2030

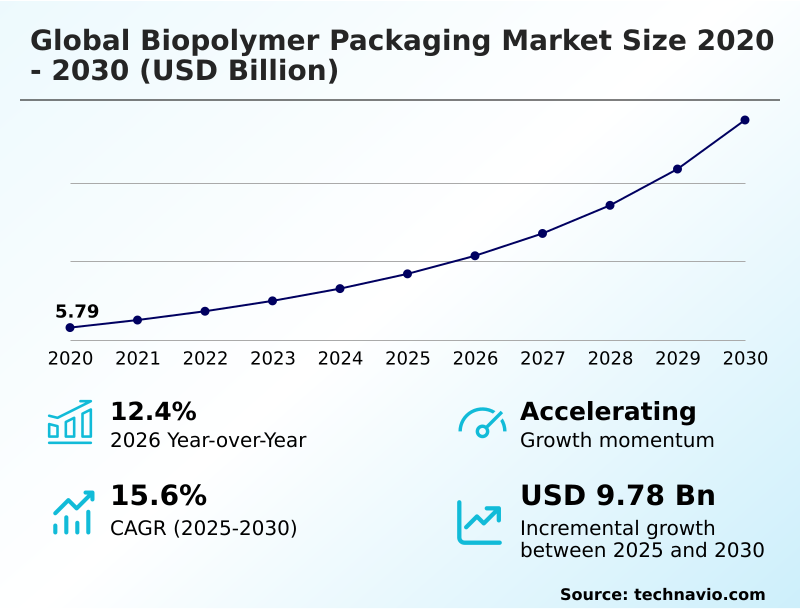
The biopolymer packaging market size is valued to increase by USD 9.78 billion, at a CAGR of 15.6% from 2025 to 2030. Increasingly stringent government regulations and policies will drive the biopolymer packaging market.

Major Market Trends & Insights

  • APAC dominated the market and accounted for a 64.2% growth during the forecast period.
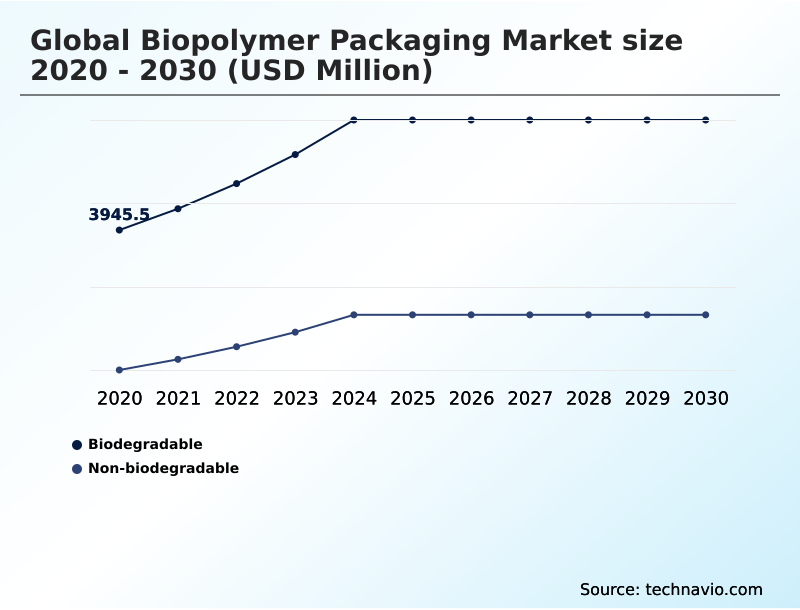
  • By Type - Biodegradable segment was valued at USD 5.60 billion in 2024
  • By Material Type - Polylactic acid (PLA) segment accounted for the largest market revenue share in 2024

Market Size & Forecast

  • Market Opportunities: USD 13.21 billion
  • Market Future Opportunities: USD 9.78 billion
  • CAGR from 2025 to 2030 : 15.6%

Market Summary

  • The biopolymer packaging market is undergoing a significant transformation, moving from a niche category to a strategic imperative for industries worldwide. This evolution is driven by a convergence of regulatory pressures against single-use plastics and a consumer-led demand for sustainable packaging solutions. At its core, the market revolves around the development and application of bioplastic resins derived from renewable resources.
  • Innovations in the polymerization process and bio-based feedstock sourcing are continuously improving the performance of these materials, making them viable single-use plastic alternatives for food, beverage, and consumer goods. A critical business scenario involves supply chain re-engineering, where companies are adopting circular economy principles.
  • This requires a shift in procurement to prioritize materials with viable end-of-life options, such as industrial composting or anaerobic digestion. Firms are now evaluating the entire sustainable product lifecycle, from feedstock sourcing to packaging waste management, to meet corporate ESG goals and differentiate their brands.
  • Success hinges on balancing material performance, such as barrier properties, with cost-effectiveness and the availability of appropriate disposal infrastructure, which remains a key variable in achieving widespread adoption and ensuring the environmental benefits of these material science innovations are fully realized.

What will be the Size of the Biopolymer Packaging Market during the forecast period?

Get Key Insights on Market Forecast (PDF) Request Free Sample

How is the Biopolymer Packaging Market Segmented?

The biopolymer packaging industry research report provides comprehensive data (region-wise segment analysis), with forecasts and estimates in "USD million" for the period 2026-2030, as well as historical data from 2020-2024 for the following segments.

  • Type
    • Biodegradable
    • Non-biodegradable
  • Material type
    • Polylactic acid (PLA)
    • Polyhydroxyalkanoates (PHA)
    • Others
  • End-user
    • Food and beverages
    • Consumer goods
    • Personal care
    • Others
  • Geography
    • APAC
      • China
      • Japan
      • India
    • North America
      • US
      • Canada
      • Mexico
    • Europe
      • Germany
      • UK
      • France
    • South America
      • Brazil
      • Argentina
      • Colombia
    • Middle East and Africa
      • Saudi Arabia
      • UAE
      • South Africa
    • Rest of World (ROW)

By Type Insights

The biodegradable segment is estimated to witness significant growth during the forecast period.

The biodegradable segment is advancing rapidly, driven by the demand for sustainable alternatives to conventional plastics. These materials, including biodegradable polymers like polylactic acid (PLA), polyhydroxyalkanoates (PHA), and thermoplastic starch, are engineered for specific end-of-life options.

Their adoption is critical for mitigating waste from single-use items, especially in food service with products like biodegradable food containers and compostable cutlery.

The value of these sustainable packaging solutions is entirely dependent on correct disposal, requiring access to facilities for home and industrial composting.

A key focus is on material innovation, which has improved the processability of these plant-based plastics by over 15% on standard converting equipment, making them more viable for applications like flexible packaging laminates and rigid containers.

Request Free Sample

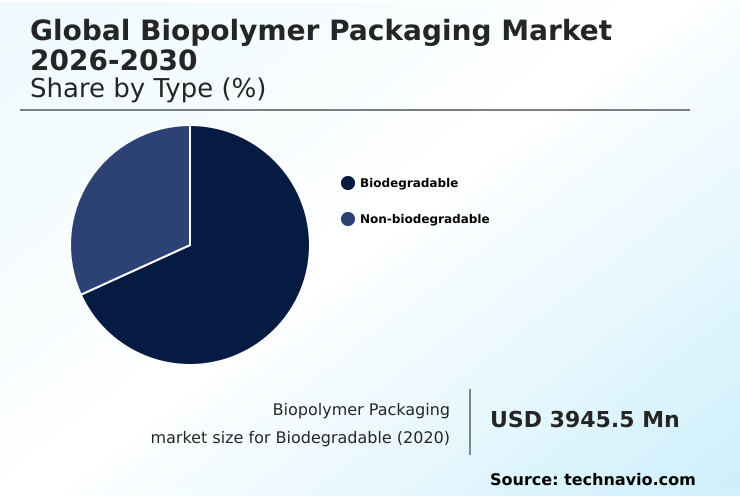
The Biodegradable segment was valued at USD 5.60 billion in 2024 and showed a gradual increase during the forecast period.

Request Free Sample

Regional Analysis

APAC is estimated to contribute 64.2% to the growth of the global market during the forecast period.Technavio’s analysts have elaborately explained the regional trends and drivers that shape the market during the forecast period.

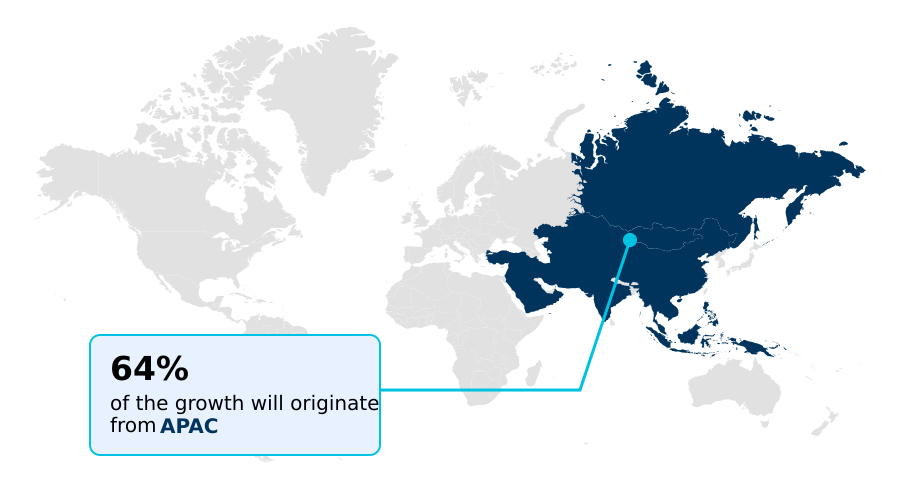
See How Biopolymer Packaging Market Demand is Rising in APAC Request Free Sample

The geographic landscape is led by the APAC region, which accounts for over 64% of the market's incremental growth, driven by aggressive government policies aimed at plastic pollution reduction and a robust manufacturing base.

This region is a hub for bio-based material sourcing and innovations in biopolymer compounding. In contrast, North America and Europe are focusing on a value-driven approach, emphasizing material science innovation to develop high-performance rigid bioplastics and flexible films.

European regulations, which are some of the world's strictest, have accelerated the adoption of materials designed for marine degradation.

This has incentivized investments in the sustainable supply chain, with companies achieving up to a 20% carbon footprint reduction by localizing feedstock sourcing.

The development of food grade biopolymers with advanced sustainable coatings is a key competitive differentiator in these mature markets.

Market Dynamics

Our researchers analyzed the data with 2025 as the base year, along with the key drivers, trends, and challenges. A holistic analysis of drivers will help companies refine their marketing strategies to gain a competitive advantage.

  • A primary consideration for businesses evaluating a switch to sustainable materials is the cost of biopolymer vs plastic, a gap that continues to narrow due to advancements in pha bioplastic production technology and economies of scale. While pla plastic heat resistance issues have historically limited its use, new formulations are expanding its viability.
  • The most significant adoption is seen with biopolymers in food packaging applications, where brand owners leverage sustainability claims to appeal to consumers. However, this introduces complexity in operational planning, as material choice must align with performance needs. For example, improving barrier properties of pla films is crucial for extending the shelf life of moisture-sensitive products.
  • For brands in coastal markets, marine biodegradable packaging standards compliance is becoming a non-negotiable aspect of risk management. Strategic decisions also revolve around the supply chain, particularly regarding the ethics and stability of feedstock sourcing for bioplastic manufacturing. Ultimately, the return on investment is tied to the end-of-life options for biopolymers.
  • Regions with well-developed composting infrastructure see adoption rates nearly double those without, underscoring the critical link between material choice and available waste management systems.

What are the key market drivers leading to the rise in the adoption of Biopolymer Packaging Industry?

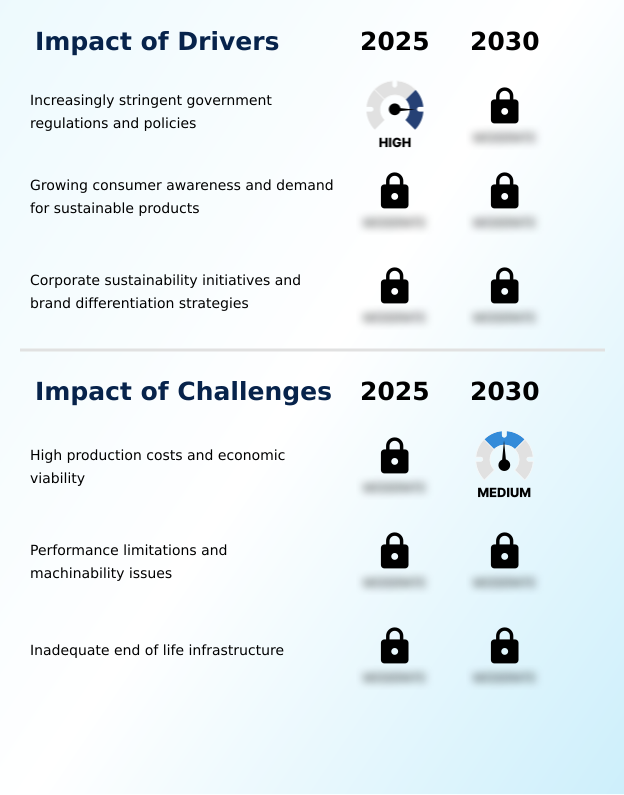
  • The proliferation of stringent government regulations and supportive policies aimed at reducing plastic pollution serves as a primary driver for the market.

  • Stringent environmental packaging regulations are a primary driver, compelling organizations to adopt sustainable alternatives and redesign their sustainable supply chain.
  • These policies have accelerated the market for bioplastic resins derived from renewable resources, with adoption in regulated regions growing 25% faster than in unregulated ones.
  • The push for carbon footprint reduction is another significant force, leading to innovations in the polymerization process and bio-based material sourcing. Companies are increasingly turning to plant-based materials to develop rigid packaging solutions that align with consumer demand for sustainability.
  • This transition has led to a 20% improvement in resource efficiency for some manufacturers by optimizing feedstock sourcing. The demand for viable single-use plastic alternatives is reshaping product portfolios and forcing improvements in packaging waste management infrastructure.

What are the market trends shaping the Biopolymer Packaging Industry?

  • A prominent market trend is the strategic prioritization of biopolymers engineered for degradation in marine and soil environments. This focus aims to address plastic leakage into natural ecosystems.

  • A key market trend is the evolution of circular packaging design, moving beyond basic recyclability to embrace advanced biopolymer materials with verified end-of-life options. The focus on materials demonstrating soil biodegradability is intensifying, with research investment in this area increasing by over 40% in recent years.
  • This shift fosters the development of green packaging solutions like compostable flexible films and heat-sealable films that do not persist in the environment. Another significant development is the integration of certified recycled polymers into bio-based products, a hybrid approach that improves resource efficiency. Companies adopting these single-use plastic alternatives have seen a 15% increase in consumer trust metrics.
  • Innovations in bio-based barrier materials are enabling these eco-friendly bags and films to replace conventional plastics without compromising product integrity.

What challenges does the Biopolymer Packaging Industry face during its growth?

  • Significant production costs and the challenge of achieving economic viability compared to conventional plastics represent a key restraint on market growth.

  • The primary market challenge remains the cost and performance gap between compostable plastics and their conventional counterparts. While demand for eco-friendly packaging materials is high, achieving competitive pricing for bio-based rigid packaging and biodegradable films is difficult.
  • The barrier properties of materials like thermoplastic aliphatic polyester often do not match traditional plastics, a performance deficit that can reduce shelf life by up to 10% in some applications.
  • Furthermore, the efficacy of these materials is constrained by a lack of infrastructure; less than 15% of communities have access to the industrial composting facilities required for proper disposal of compostable bags. This creates confusion around home and industrial composting standards, hindering widespread adoption.
  • Biopolymer compounding efforts are focused on creating high-performance biopolymers, but these advanced compostable resins carry a significant cost premium.

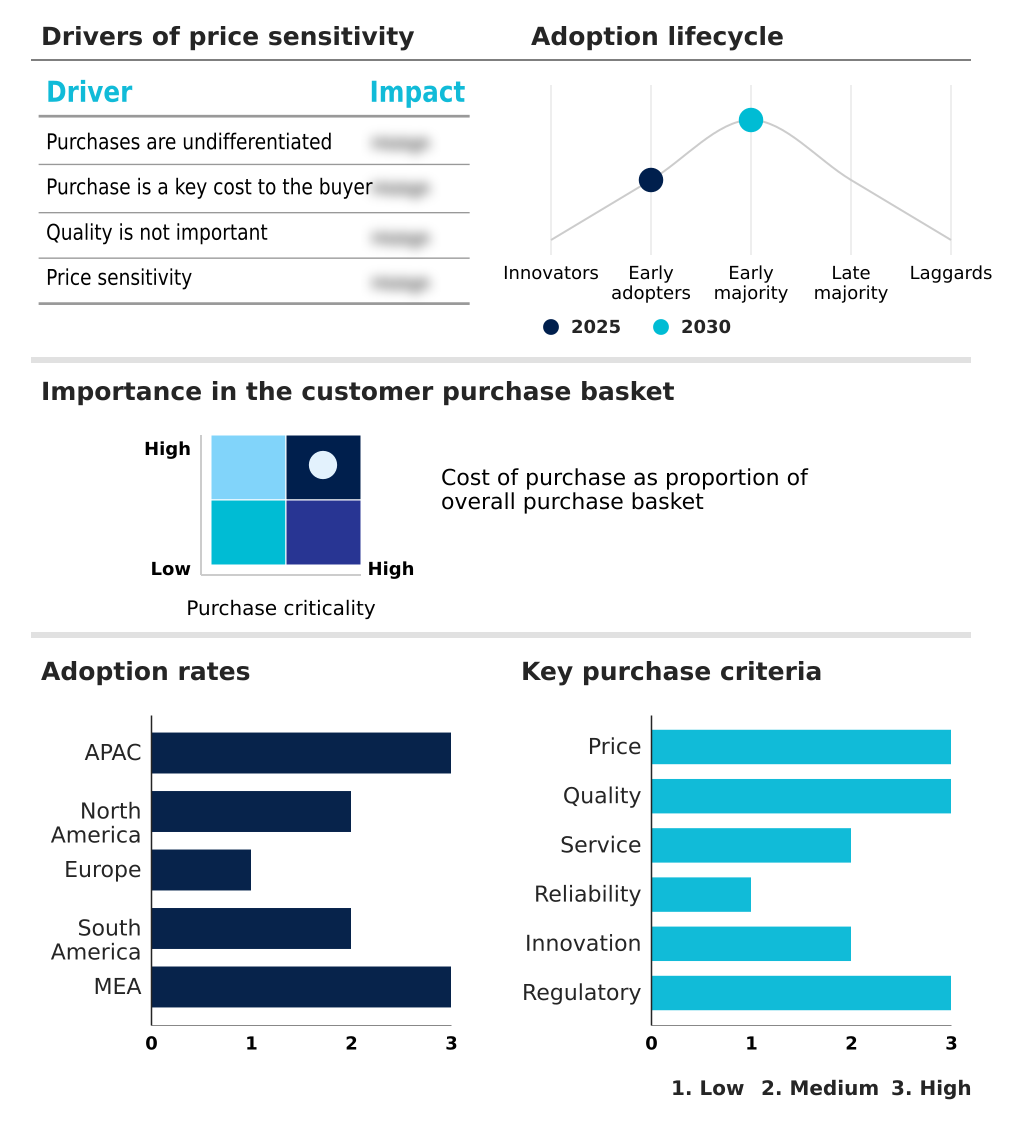
Exclusive Technavio Analysis on Customer Landscape

The biopolymer packaging market forecasting report includes the adoption lifecycle of the market, covering from the innovator’s stage to the laggard’s stage. It focuses on adoption rates in different regions based on penetration. Furthermore, the biopolymer packaging market report also includes key purchase criteria and drivers of price sensitivity to help companies evaluate and develop their market growth analysis strategies.

Customer Landscape of Biopolymer Packaging Industry

Competitive Landscape

Companies are implementing various strategies, such as strategic alliances, biopolymer packaging market forecast, partnerships, mergers and acquisitions, geographical expansion, and product/service launches, to enhance their presence in the industry.

Alpagro Packaging NV - Delivers a portfolio of biopolymer packaging, including versatile flexible and rigid formats engineered for a variety of consumer and industrial applications.

The industry research and growth report includes detailed analyses of the competitive landscape of the market and information about key companies, including:

  • Alpagro Packaging NV
  • Amcor Plc
  • BASF SE
  • BIOGREEN PACKAGING Pvt. Ltd.
  • Biome Bioplastics Ltd.
  • COMPOSTPACK SAS
  • Earthpac Ltd.
  • Eastman Chemical Co.
  • Element Packaging Ltd.
  • Fkur Kunststoff GmbH
  • Green Gate Bio Packaging
  • Minima Technology Co. Ltd.
  • Mondi Plc
  • Plastic Suppliers Inc.
  • Tetra Pak International SA
  • Tipa Ltd.
  • Treemera GmbH

Qualitative and quantitative analysis of companies has been conducted to help clients understand the wider business environment as well as the strengths and weaknesses of key industry players. Data is qualitatively analyzed to categorize companies as pure play, category-focused, industry-focused, and diversified; it is quantitatively analyzed to categorize companies as dominant, leading, strong, tentative, and weak.

Recent Development and News in Biopolymer packaging market

  • In February 2025, Tetra Pak launched new carton packages in the Indian market that incorporate certified recycled polymers, aligning with local waste management regulations.
  • In March 2025, PTT Global Chemical and Kaneka Corp. announced the successful commercial operation of their new PHA production facility in Thailand, utilizing third-generation feedstock from industrial wastewater.
  • In March 2025, a European consortium led by the Fraunhofer Institute announced the commercialization of a new stereocomplexed PLA (sc-PLA) formulation suitable for high-temperature applications like coffee capsules.
  • In May 2025, the Global Hospitality Alliance partnered with biotech firm FuturaPolymers to mandate the replacement of conventional plastics with PHA-based items across its member hotels by 2028.

Dive into Technavio’s robust research methodology, blending expert interviews, extensive data synthesis, and validated models for unparalleled Biopolymer Packaging Market insights. See full methodology.

Market Scope
Page number 288
Base year 2025
Historic period 2020-2024
Forecast period 2026-2030
Growth momentum & CAGR Accelerate at a CAGR of 15.6%
Market growth 2026-2030 USD 9780.0 million
Market structure Fragmented
YoY growth 2025-2026(%) 12.4%
Key countries China, Japan, India, South Korea, Australia, Indonesia, US, Canada, Mexico, Germany, UK, France, Italy, Spain, The Netherlands, Brazil, Argentina, Colombia, Saudi Arabia, UAE, South Africa, Israel and Turkey
Competitive landscape Leading Companies, Market Positioning of Companies, Competitive Strategies, and Industry Risks

Request Free Sample

Research Analyst Overview

  • The biopolymer packaging market is driven by material science innovation, focusing on high-performance biopolymers that serve as viable single-use plastic alternatives. Boardroom decisions are increasingly influenced by the need to integrate circular economy principles into product strategy, mandating a shift toward bioplastic resins with defined end-of-life options like industrial composting or anaerobic digestion.
  • The selection of biodegradable polymers, including polylactic acid (PLA) and polyhydroxyalkanoates (PHA), is no longer just a marketing choice but a core component of risk management and compliance. Innovations in biopolymer compounding and the development of stereocomplexed PLA (sc-PLA) address performance gaps, enabling use in rigid bioplastics and flexible film packaging.
  • As companies re-evaluate their supply chains, feedstock sourcing from renewable resources becomes paramount for achieving carbon footprint reduction goals. Firms that successfully integrate these sustainable packaging solutions, from compostable food containers to heat-sealable films, have reported a 30% improvement in meeting their corporate ESG targets.
  • This transition involves optimizing the bioplastic manufacturing and polymerization process to manage costs associated with thermoplastic starch and other bio-based feedstocks, ensuring effective packaging waste management and a sustainable product lifecycle. The push for certified recycled polymers and food grade biopolymers with enhanced barrier properties, capable of soil and marine degradation, defines the competitive landscape.

What are the Key Data Covered in this Biopolymer Packaging Market Research and Growth Report?

  • What is the expected growth of the Biopolymer Packaging Market between 2026 and 2030?

    • USD 9.78 billion, at a CAGR of 15.6%

  • What segmentation does the market report cover?

    • The report is segmented by Type (Biodegradable, and Non-biodegradable), Material Type (Polylactic acid (PLA), Polyhydroxyalkanoates (PHA), and Others), End-user (Food and beverages, Consumer goods, Personal care, and Others) and Geography (APAC, North America, Europe, South America, Middle East and Africa)

  • Which regions are analyzed in the report?

    • APAC, North America, Europe, South America and Middle East and Africa

  • What are the key growth drivers and market challenges?

    • Increasingly stringent government regulations and policies, High production costs and economic viability

  • Who are the major players in the Biopolymer Packaging Market?

    • Alpagro Packaging NV, Amcor Plc, BASF SE, BIOGREEN PACKAGING Pvt. Ltd., Biome Bioplastics Ltd., COMPOSTPACK SAS, Earthpac Ltd., Eastman Chemical Co., Element Packaging Ltd., Fkur Kunststoff GmbH, Green Gate Bio Packaging, Minima Technology Co. Ltd., Mondi Plc, Plastic Suppliers Inc., Tetra Pak International SA, Tipa Ltd. and Treemera GmbH

Market Research Insights

  • The market is defined by a dynamic push toward advanced biopolymer materials and green packaging solutions. A shift in corporate strategy is evident, with companies prioritizing circular packaging design, resulting in a 25% increase in the use of materials certified for home and industrial composting.
  • Innovations in sustainable material science are enabling the creation of compostable flexible films with enhanced functionality, improving product protection while meeting environmental packaging regulations. Businesses adopting these sustainable alternatives report an 18% improvement in brand perception among environmentally-conscious consumers.
  • Furthermore, the integration of bio-based barrier materials into packaging formats has allowed for a 10% reduction in food waste in certain fresh produce applications, demonstrating a clear operational benefit beyond sustainability metrics.

We can help! Our analysts can customize this biopolymer packaging market research report to meet your requirements.

Get in touch

1. Executive Summary

1.1 Market overview

Executive Summary - Chart on Market Overview
Executive Summary - Data Table on Market Overview
Executive Summary - Chart on Global Market Characteristics
Executive Summary - Chart on Market by Geography
Executive Summary - Chart on Market Segmentation by Type
Executive Summary - Chart on Market Segmentation by Material Type
Executive Summary - Chart on Market Segmentation by End-user
Executive Summary - Chart on Incremental Growth
Executive Summary - Data Table on Incremental Growth
Executive Summary - Chart on Company Market Positioning

2. Technavio Analysis

2.1 Analysis of price sensitivity, lifecycle, customer purchase basket, adoption rates, and purchase criteria

2.2 Criticality of inputs and Factors of differentiation

Chart on Overview on criticality of inputs and factors of differentiation

2.3 Factors of disruption

Chart on Overview on factors of disruption

2.4 Impact of drivers and challenges

Chart on Impact of drivers and challenges in 2025 and 2030

3. Market Landscape

3.1 Market ecosystem

Chart on Parent Market
Data Table on - Parent Market

3.2 Market characteristics

Chart on Market characteristics analysis

3.3 Value chain analysis

Chart on Value chain analysis

4. Market Sizing

4.1 Market definition

Data Table on Offerings of companies included in the market definition

4.2 Market segment analysis

Market segments

4.3 Market size 2025

4.4 Market outlook: Forecast for 2025-2030

Chart on Global - Market size and forecast 2025-2030 ($ million)
Data Table on Global - Market size and forecast 2025-2030 ($ million)
Chart on Global Market: Year-over-year growth 2025-2030 (%)
Data Table on Global Market: Year-over-year growth 2025-2030 (%)

5. Historic Market Size

5.1 Global Biopolymer Packaging Market 2020 - 2024

Historic Market Size - Data Table on Global Biopolymer Packaging Market 2020 - 2024 ($ million)

5.2 Type segment analysis 2020 - 2024

Historic Market Size - Type Segment 2020 - 2024 ($ million)

5.3 Material Type segment analysis 2020 - 2024

Historic Market Size - Material Type Segment 2020 - 2024 ($ million)

5.4 End-user segment analysis 2020 - 2024

Historic Market Size - End-user Segment 2020 - 2024 ($ million)

5.5 Geography segment analysis 2020 - 2024

Historic Market Size - Geography Segment 2020 - 2024 ($ million)

5.6 Country segment analysis 2020 - 2024

Historic Market Size - Country Segment 2020 - 2024 ($ million)

6. Qualitative Analysis

6.1 The AI impact on global biopolymer packaging market

7. Five Forces Analysis

7.1 Five forces summary

Five forces analysis - Comparison between 2025 and 2030

7.2 Bargaining power of buyers

Bargaining power of buyers - Impact of key factors 2025 and 2030

7.3 Bargaining power of suppliers

Bargaining power of suppliers - Impact of key factors in 2025 and 2030

7.4 Threat of new entrants

Threat of new entrants - Impact of key factors in 2025 and 2030

7.5 Threat of substitutes

Threat of substitutes - Impact of key factors in 2025 and 2030

7.6 Threat of rivalry

Threat of rivalry - Impact of key factors in 2025 and 2030

7.7 Market condition

Chart on Market condition - Five forces 2025 and 2030

8. Market Segmentation by Type

8.1 Market segments

Chart on Type - Market share 2025-2030 (%)
Data Table on Type - Market share 2025-2030 (%)

8.2 Comparison by Type

Chart on Comparison by Type
Data Table on Comparison by Type

8.3 Biodegradable - Market size and forecast 2025-2030

Chart on Biodegradable - Market size and forecast 2025-2030 ($ million)
Data Table on Biodegradable - Market size and forecast 2025-2030 ($ million)
Chart on Biodegradable - Year-over-year growth 2025-2030 (%)
Data Table on Biodegradable - Year-over-year growth 2025-2030 (%)

8.4 Non-biodegradable - Market size and forecast 2025-2030

Chart on Non-biodegradable - Market size and forecast 2025-2030 ($ million)
Data Table on Non-biodegradable - Market size and forecast 2025-2030 ($ million)
Chart on Non-biodegradable - Year-over-year growth 2025-2030 (%)
Data Table on Non-biodegradable - Year-over-year growth 2025-2030 (%)

8.5 Market opportunity by Type

Market opportunity by Type ($ million)
Data Table on Market opportunity by Type ($ million)

9. Market Segmentation by Material Type

9.1 Market segments

Chart on Market Segmentation by Material Type - Market share 2025-2030 (%)
Data Table on Market Segmentation by Material Type - Market share 2025-2030 (%)

9.2 Comparison by Market Segmentation by Material Type

Chart on Comparison by Market Segmentation by Material Type
Data Table on Comparison by Market Segmentation by Material Type

9.3 Polylactic acid (PLA) - Market size and forecast 2025-2030

Chart on Polylactic acid (PLA) - Market size and forecast 2025-2030 ($ million)
Data Table on Polylactic acid (PLA) - Market size and forecast 2025-2030 ($ million)
Chart on Polylactic acid (PLA) - Year-over-year growth 2025-2030 (%)
Data Table on Polylactic acid (PLA) - Year-over-year growth 2025-2030 (%)

9.4 Polyhydroxyalkanoates (PHA) - Market size and forecast 2025-2030

Chart on Polyhydroxyalkanoates (PHA) - Market size and forecast 2025-2030 ($ million)
Data Table on Polyhydroxyalkanoates (PHA) - Market size and forecast 2025-2030 ($ million)
Chart on Polyhydroxyalkanoates (PHA) - Year-over-year growth 2025-2030 (%)
Data Table on Polyhydroxyalkanoates (PHA) - Year-over-year growth 2025-2030 (%)

9.5 Others - Market size and forecast 2025-2030

Chart on Others - Market size and forecast 2025-2030 ($ million)
Data Table on Others - Market size and forecast 2025-2030 ($ million)
Chart on Others - Year-over-year growth 2025-2030 (%)
Data Table on Others - Year-over-year growth 2025-2030 (%)

9.6 Market opportunity by Market Segmentation by Material Type

Market opportunity by Market Segmentation by Material Type ($ million)
Data Table on Market opportunity by Market Segmentation by Material Type ($ million)

10. Market Segmentation by End-user

10.1 Market segments

Chart on End-user - Market share 2025-2030 (%)
Data Table on End-user - Market share 2025-2030 (%)

10.2 Comparison by End-user

Chart on Comparison by End-user
Data Table on Comparison by End-user

10.3 Food and beverages - Market size and forecast 2025-2030

Chart on Food and beverages - Market size and forecast 2025-2030 ($ million)
Data Table on Food and beverages - Market size and forecast 2025-2030 ($ million)
Chart on Food and beverages - Year-over-year growth 2025-2030 (%)
Data Table on Food and beverages - Year-over-year growth 2025-2030 (%)

10.4 Consumer goods - Market size and forecast 2025-2030

Chart on Consumer goods - Market size and forecast 2025-2030 ($ million)
Data Table on Consumer goods - Market size and forecast 2025-2030 ($ million)
Chart on Consumer goods - Year-over-year growth 2025-2030 (%)
Data Table on Consumer goods - Year-over-year growth 2025-2030 (%)

10.5 Personal care - Market size and forecast 2025-2030

Chart on Personal care - Market size and forecast 2025-2030 ($ million)
Data Table on Personal care - Market size and forecast 2025-2030 ($ million)
Chart on Personal care - Year-over-year growth 2025-2030 (%)
Data Table on Personal care - Year-over-year growth 2025-2030 (%)

10.6 Others - Market size and forecast 2025-2030

Chart on Others - Market size and forecast 2025-2030 ($ million)
Data Table on Others - Market size and forecast 2025-2030 ($ million)
Chart on Others - Year-over-year growth 2025-2030 (%)
Data Table on Others - Year-over-year growth 2025-2030 (%)

10.7 Market opportunity by End-user

Market opportunity by End-user ($ million)
Data Table on Market opportunity by End-user ($ million)

11. Customer Landscape

11.1 Customer landscape overview

Analysis of price sensitivity, lifecycle, customer purchase basket, adoption rates, and purchase criteria

12. Geographic Landscape

12.1 Geographic segmentation

Chart on Market share by geography 2025-2030 (%)
Data Table on Market share by geography 2025-2030 (%)

12.2 Geographic comparison

Chart on Geographic comparison
Data Table on Geographic comparison

12.3 APAC - Market size and forecast 2025-2030

Chart on APAC - Market size and forecast 2025-2030 ($ million)
Data Table on APAC - Market size and forecast 2025-2030 ($ million)
Chart on APAC - Year-over-year growth 2025-2030 (%)
Data Table on APAC - Year-over-year growth 2025-2030 (%)
Chart on Regional Comparison - APAC
Data Table on Regional Comparison - APAC

12.3.1 China - Market size and forecast 2025-2030

Chart on China - Market size and forecast 2025-2030 ($ million)
Data Table on China - Market size and forecast 2025-2030 ($ million)
Chart on China - Year-over-year growth 2025-2030 (%)
Data Table on China - Year-over-year growth 2025-2030 (%)

12.3.2 Japan - Market size and forecast 2025-2030

Chart on Japan - Market size and forecast 2025-2030 ($ million)
Data Table on Japan - Market size and forecast 2025-2030 ($ million)
Chart on Japan - Year-over-year growth 2025-2030 (%)
Data Table on Japan - Year-over-year growth 2025-2030 (%)

12.3.3 India - Market size and forecast 2025-2030

Chart on India - Market size and forecast 2025-2030 ($ million)
Data Table on India - Market size and forecast 2025-2030 ($ million)
Chart on India - Year-over-year growth 2025-2030 (%)
Data Table on India - Year-over-year growth 2025-2030 (%)

12.3.4 South Korea - Market size and forecast 2025-2030

Chart on South Korea - Market size and forecast 2025-2030 ($ million)
Data Table on South Korea - Market size and forecast 2025-2030 ($ million)
Chart on South Korea - Year-over-year growth 2025-2030 (%)
Data Table on South Korea - Year-over-year growth 2025-2030 (%)

12.3.5 Australia - Market size and forecast 2025-2030

Chart on Australia - Market size and forecast 2025-2030 ($ million)
Data Table on Australia - Market size and forecast 2025-2030 ($ million)
Chart on Australia - Year-over-year growth 2025-2030 (%)
Data Table on Australia - Year-over-year growth 2025-2030 (%)

12.3.6 Indonesia - Market size and forecast 2025-2030

Chart on Indonesia - Market size and forecast 2025-2030 ($ million)
Data Table on Indonesia - Market size and forecast 2025-2030 ($ million)
Chart on Indonesia - Year-over-year growth 2025-2030 (%)
Data Table on Indonesia - Year-over-year growth 2025-2030 (%)

12.4 North America - Market size and forecast 2025-2030

Chart on North America - Market size and forecast 2025-2030 ($ million)
Data Table on North America - Market size and forecast 2025-2030 ($ million)
Chart on North America - Year-over-year growth 2025-2030 (%)
Data Table on North America - Year-over-year growth 2025-2030 (%)
Chart on Regional Comparison - North America
Data Table on Regional Comparison - North America

12.4.1 US - Market size and forecast 2025-2030

Chart on US - Market size and forecast 2025-2030 ($ million)
Data Table on US - Market size and forecast 2025-2030 ($ million)
Chart on US - Year-over-year growth 2025-2030 (%)
Data Table on US - Year-over-year growth 2025-2030 (%)

12.4.2 Canada - Market size and forecast 2025-2030

Chart on Canada - Market size and forecast 2025-2030 ($ million)
Data Table on Canada - Market size and forecast 2025-2030 ($ million)
Chart on Canada - Year-over-year growth 2025-2030 (%)
Data Table on Canada - Year-over-year growth 2025-2030 (%)

12.4.3 Mexico - Market size and forecast 2025-2030

Chart on Mexico - Market size and forecast 2025-2030 ($ million)
Data Table on Mexico - Market size and forecast 2025-2030 ($ million)
Chart on Mexico - Year-over-year growth 2025-2030 (%)
Data Table on Mexico - Year-over-year growth 2025-2030 (%)

12.5 Europe - Market size and forecast 2025-2030

Chart on Europe - Market size and forecast 2025-2030 ($ million)
Data Table on Europe - Market size and forecast 2025-2030 ($ million)
Chart on Europe - Year-over-year growth 2025-2030 (%)
Data Table on Europe - Year-over-year growth 2025-2030 (%)
Chart on Regional Comparison - Europe
Data Table on Regional Comparison - Europe

12.5.1 Germany - Market size and forecast 2025-2030

Chart on Germany - Market size and forecast 2025-2030 ($ million)
Data Table on Germany - Market size and forecast 2025-2030 ($ million)
Chart on Germany - Year-over-year growth 2025-2030 (%)
Data Table on Germany - Year-over-year growth 2025-2030 (%)

12.5.2 UK - Market size and forecast 2025-2030

Chart on UK - Market size and forecast 2025-2030 ($ million)
Data Table on UK - Market size and forecast 2025-2030 ($ million)
Chart on UK - Year-over-year growth 2025-2030 (%)
Data Table on UK - Year-over-year growth 2025-2030 (%)

12.5.3 France - Market size and forecast 2025-2030

Chart on France - Market size and forecast 2025-2030 ($ million)
Data Table on France - Market size and forecast 2025-2030 ($ million)
Chart on France - Year-over-year growth 2025-2030 (%)
Data Table on France - Year-over-year growth 2025-2030 (%)

12.5.4 Italy - Market size and forecast 2025-2030

Chart on Italy - Market size and forecast 2025-2030 ($ million)
Data Table on Italy - Market size and forecast 2025-2030 ($ million)
Chart on Italy - Year-over-year growth 2025-2030 (%)
Data Table on Italy - Year-over-year growth 2025-2030 (%)

12.5.5 Spain - Market size and forecast 2025-2030

Chart on Spain - Market size and forecast 2025-2030 ($ million)
Data Table on Spain - Market size and forecast 2025-2030 ($ million)
Chart on Spain - Year-over-year growth 2025-2030 (%)
Data Table on Spain - Year-over-year growth 2025-2030 (%)

12.5.6 The Netherlands - Market size and forecast 2025-2030

Chart on The Netherlands - Market size and forecast 2025-2030 ($ million)
Data Table on The Netherlands - Market size and forecast 2025-2030 ($ million)
Chart on The Netherlands - Year-over-year growth 2025-2030 (%)
Data Table on The Netherlands - Year-over-year growth 2025-2030 (%)

12.6 South America - Market size and forecast 2025-2030

Chart on South America - Market size and forecast 2025-2030 ($ million)
Data Table on South America - Market size and forecast 2025-2030 ($ million)
Chart on South America - Year-over-year growth 2025-2030 (%)
Data Table on South America - Year-over-year growth 2025-2030 (%)
Chart on Regional Comparison - South America
Data Table on Regional Comparison - South America

12.6.1 Brazil - Market size and forecast 2025-2030

Chart on Brazil - Market size and forecast 2025-2030 ($ million)
Data Table on Brazil - Market size and forecast 2025-2030 ($ million)
Chart on Brazil - Year-over-year growth 2025-2030 (%)
Data Table on Brazil - Year-over-year growth 2025-2030 (%)

12.6.2 Argentina - Market size and forecast 2025-2030

Chart on Argentina - Market size and forecast 2025-2030 ($ million)
Data Table on Argentina - Market size and forecast 2025-2030 ($ million)
Chart on Argentina - Year-over-year growth 2025-2030 (%)
Data Table on Argentina - Year-over-year growth 2025-2030 (%)

12.6.3 Colombia - Market size and forecast 2025-2030

Chart on Colombia - Market size and forecast 2025-2030 ($ million)
Data Table on Colombia - Market size and forecast 2025-2030 ($ million)
Chart on Colombia - Year-over-year growth 2025-2030 (%)
Data Table on Colombia - Year-over-year growth 2025-2030 (%)

12.7 Middle East and Africa - Market size and forecast 2025-2030

Chart on Middle East and Africa - Market size and forecast 2025-2030 ($ million)
Data Table on Middle East and Africa - Market size and forecast 2025-2030 ($ million)
Chart on Middle East and Africa - Year-over-year growth 2025-2030 (%)
Data Table on Middle East and Africa - Year-over-year growth 2025-2030 (%)
Chart on Regional Comparison - Middle East and Africa
Data Table on Regional Comparison - Middle East and Africa

12.7.1 Saudi Arabia - Market size and forecast 2025-2030

Chart on Saudi Arabia - Market size and forecast 2025-2030 ($ million)
Data Table on Saudi Arabia - Market size and forecast 2025-2030 ($ million)
Chart on Saudi Arabia - Year-over-year growth 2025-2030 (%)
Data Table on Saudi Arabia - Year-over-year growth 2025-2030 (%)

12.7.2 UAE - Market size and forecast 2025-2030

Chart on UAE - Market size and forecast 2025-2030 ($ million)
Data Table on UAE - Market size and forecast 2025-2030 ($ million)
Chart on UAE - Year-over-year growth 2025-2030 (%)
Data Table on UAE - Year-over-year growth 2025-2030 (%)

12.7.3 South Africa - Market size and forecast 2025-2030

Chart on South Africa - Market size and forecast 2025-2030 ($ million)
Data Table on South Africa - Market size and forecast 2025-2030 ($ million)
Chart on South Africa - Year-over-year growth 2025-2030 (%)
Data Table on South Africa - Year-over-year growth 2025-2030 (%)

12.7.4 Israel - Market size and forecast 2025-2030

Chart on Israel - Market size and forecast 2025-2030 ($ million)
Data Table on Israel - Market size and forecast 2025-2030 ($ million)
Chart on Israel - Year-over-year growth 2025-2030 (%)
Data Table on Israel - Year-over-year growth 2025-2030 (%)

12.7.5 Turkey - Market size and forecast 2025-2030

Chart on Turkey - Market size and forecast 2025-2030 ($ million)
Data Table on Turkey - Market size and forecast 2025-2030 ($ million)
Chart on Turkey - Year-over-year growth 2025-2030 (%)
Data Table on Turkey - Year-over-year growth 2025-2030 (%)

12.8 Market opportunity by geography

Market opportunity by geography ($ million)
Data Tables on Market opportunity by geography ($ million)

13. Drivers, Challenges, and Opportunity

13.1 Market drivers

Increasingly stringent government regulations and policies
Growing consumer awareness and demand for sustainable products
Corporate sustainability initiatives and brand differentiation strategies

13.2 Market challenges

High production costs and economic viability
Performance limitations and machinability issues
Inadequate end of life infrastructure

13.3 Impact of drivers and challenges

Impact of drivers and challenges in 2025 and 2030

13.4 Market opportunities

Prioritization of marine and soil degradable biopolymers
Shift towards second and third-generation feedstocks
Emergence of high-performance hybrid and composite materials

14. Competitive Landscape

14.1 Overview

14.2

Overview on criticality of inputs and factors of differentiation

14.3 Landscape disruption

Overview on factors of disruption

14.4 Industry risks

Impact of key risks on business

15. Competitive Analysis

15.1 Companies profiled

Companies covered

15.2 Company ranking index

15.3 Market positioning of companies

Matrix on companies position and classification

15.4 Alpagro Packaging NV

Alpagro Packaging NV - Overview
Alpagro Packaging NV - Product / Service
Alpagro Packaging NV - Key offerings
SWOT

15.5 Amcor Plc

Amcor Plc - Overview
Amcor Plc - Business segments
Amcor Plc - Key news
Amcor Plc - Key offerings
Amcor Plc - Segment focus
SWOT

15.6 BASF SE

BASF SE - Overview
BASF SE - Business segments
BASF SE - Key news
BASF SE - Key offerings
BASF SE - Segment focus
SWOT

15.7 Biome Bioplastics Ltd.

Biome Bioplastics Ltd. - Overview
Biome Bioplastics Ltd. - Product / Service
Biome Bioplastics Ltd. - Key offerings
SWOT

15.8 COMPOSTPACK SAS

COMPOSTPACK SAS - Overview
COMPOSTPACK SAS - Product / Service
COMPOSTPACK SAS - Key offerings
SWOT

15.9 Eastman Chemical Co.

Eastman Chemical Co. - Overview
Eastman Chemical Co. - Business segments
Eastman Chemical Co. - Key news
Eastman Chemical Co. - Key offerings
Eastman Chemical Co. - Segment focus
SWOT

15.10 Element Packaging Ltd.

Element Packaging Ltd. - Overview
Element Packaging Ltd. - Product / Service
Element Packaging Ltd. - Key offerings
SWOT

15.11 Fkur Kunststoff GmbH

Fkur Kunststoff GmbH - Overview
Fkur Kunststoff GmbH - Product / Service
Fkur Kunststoff GmbH - Key offerings
SWOT

15.12 Green Gate Bio Packaging

Green Gate Bio Packaging - Overview
Green Gate Bio Packaging - Product / Service
Green Gate Bio Packaging - Key offerings
SWOT

15.13 Minima Technology Co. Ltd.

Minima Technology Co. Ltd. - Overview
Minima Technology Co. Ltd. - Product / Service
Minima Technology Co. Ltd. - Key offerings
SWOT

15.14 Mondi Plc

Mondi Plc - Overview
Mondi Plc - Business segments
Mondi Plc - Key news
Mondi Plc - Key offerings
Mondi Plc - Segment focus
SWOT

15.15 Plastic Suppliers Inc.

Plastic Suppliers Inc. - Overview
Plastic Suppliers Inc. - Product / Service
Plastic Suppliers Inc. - Key offerings
SWOT

15.16 Tetra Pak International SA

Tetra Pak International SA - Overview
Tetra Pak International SA - Product / Service
Tetra Pak International SA - Key offerings
SWOT

15.17 Tipa Ltd.

Tipa Ltd. - Overview
Tipa Ltd. - Product / Service
Tipa Ltd. - Key offerings
SWOT

15.18 Treemera GmbH

Treemera GmbH - Overview
Treemera GmbH - Product / Service
Treemera GmbH - Key offerings
SWOT

16. Appendix

16.1 Scope of the report

Market definition
Objectives
Notes and caveats

16.2 Inclusions and exclusions checklist

Inclusions checklist
Exclusions checklist

16.3 Currency conversion rates for US$

16.4 Research methodology

16.5 Data procurement

Information sources

16.6 Data validation

16.7 Validation techniques employed for market sizing

16.8 Data synthesis

16.9 360 degree market analysis

16.10 List of abbreviations

Research Methodology

Technavio presents a detailed picture of the market by way of study, synthesis, and summation of data from multiple sources. The analysts have presented the various facets of the market with a particular focus on identifying the key industry influencers. The data thus presented is comprehensive, reliable, and the result of extensive research, both primary and secondary.

INFORMATION SOURCES

Primary sources

  • Manufacturers and suppliers
  • Channel partners
  • Industry experts
  • Strategic decision makers

Secondary sources

  • Industry journals and periodicals
  • Government data
  • Financial reports of key industry players
  • Historical data
  • Press releases

DATA ANALYSIS

Data Synthesis

  • Collation of data
  • Estimation of key figures
  • Analysis of derived insights

Data Validation

  • Triangulation with data models
  • Reference against proprietary databases
  • Corroboration with industry experts

REPORT WRITING

Qualitative

  • Market drivers
  • Market challenges
  • Market trends
  • Five forces analysis

Quantitative

  • Market size and forecast
  • Market segmentation
  • Geographical insights
  • Competitive landscape

Interested in this report?

Get your sample now to see our research methodology and insights!

Download Now

Frequently Asked Questions

Biopolymer Packaging market growth will increase by USD 9780.0 million during 2026-2030.

The Biopolymer Packaging market is expected to grow at a CAGR of 15.6% during 2026-2030.

Biopolymer Packaging market is segmented by Type (Biodegradable, Non-biodegradable) Material type (Polylactic acid (PLA), Polyhydroxyalkanoates (PHA), Others) End-user (Food and beverages, Consumer goods, Personal care, Others)

Alpagro Packaging NV, Amcor Plc, BASF SE, BIOGREEN PACKAGING Pvt. Ltd., Biome Bioplastics Ltd., COMPOSTPACK SAS, Earthpac Ltd., Eastman Chemical Co., Element Packaging Ltd., Fkur Kunststoff GmbH, Green Gate Bio Packaging, Minima Technology Co. Ltd., Mondi Plc, Plastic Suppliers Inc., Tetra Pak International SA, Tipa Ltd., Treemera GmbH are a few of the key vendors in the Biopolymer Packaging market.

APAC will register the highest growth rate of 64.2% among the other regions. Therefore, the Biopolymer Packaging market in APAC is expected to garner significant business opportunities for the vendors during the forecast period.

China, Japan, India, South Korea, Australia, Indonesia, US, Canada, Mexico, Germany, UK, France, Italy, Spain, The Netherlands, Brazil, Argentina, Colombia, Saudi Arabia, UAE, South Africa, Israel, Turkey

  • Increasingly stringent government regulations and policies is the driving factor this market.

The Biopolymer Packaging market vendors should focus on grabbing business opportunities from the Type segment as it accounted for the largest market share in the base year.