Broadcasting Cable TV Market Size 2025-2029
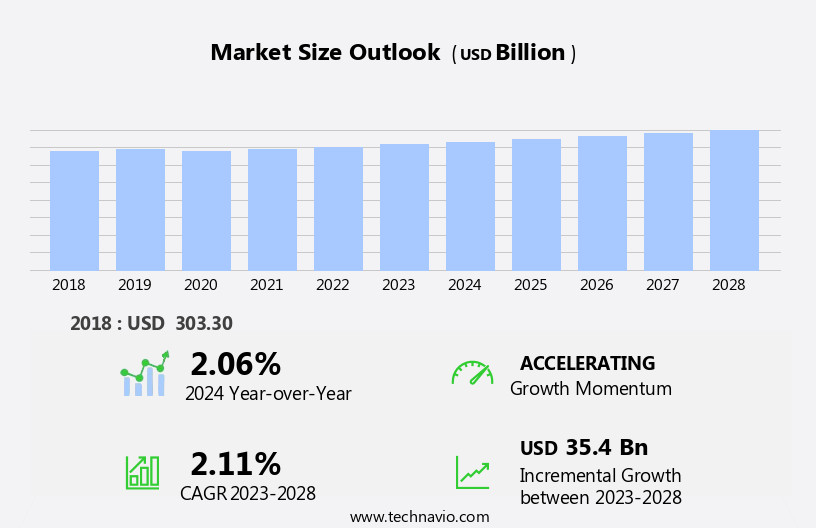
The broadcasting cable TV market size is forecast to increase by USD 36.7 billion, at a CAGR of 2.1% between 2024 and 2029.
- The market is experiencing significant shifts as TV broadcasters increasingly develop their own Over-The-Top (OTT) platforms to reach audiences beyond traditional cable subscriptions. This trend is driven by the expanding OTT delivery systems, which offer greater flexibility and convenience to consumers. However, the market faces challenges as well. Stringent rules and regulations imposed by the Federal Communications Commission (FCC) continue to shape the competitive landscape, necessitating compliance and strategic adaptation. As broadcasters navigate these changes, they must effectively balance the opportunities presented by OTT platforms and online streaming with the regulatory requirements to maintain a strong market presence.
- Companies seeking to capitalize on this dynamic market should focus on staying agile and innovative, while ensuring regulatory compliance, to meet the evolving demands of consumers and competitors alike.
What will be the Size of the Broadcasting Cable TV Market during the forecast period?
Explore in-depth regional segment analysis with market size data - historical 2019-2023 and forecasts 2025-2029 - in the full report.
Request Free Sample
The market continues to evolve, with dynamic market dynamics shaping its various sectors. Transmission networks play a crucial role in delivering content to viewers, employing technologies such as fiber optics and microwave transmission. Advertising revenue is a significant driver, with targeted advertising and addressable advertising becoming increasingly popular. YouTube TV and other over-the-top (OTT) platforms challenge traditional cable TV providers, offering flexibility and convenience through remote control access and on-demand content. Audience measurement tools, like viewership ratings, help broadcasters understand consumer behavior and tailor their programming accordingly. Broadcast infrastructure includes set-top boxes (STBs), cable modems, and satellite uplinks, enabling the delivery of digital television, high-definition television (HDTV), and ultra-high-definition television (UHDTV).
Subscription management systems facilitate customer retention, while subscription revenue is a key revenue stream. Content licensing and acquisition are essential components, with providers seeking to offer a diverse channel lineup. Pay-per-view (PPV) and streaming services, such as Amazon Prime Video, add to the mix. Interactive television and user interfaces (UIs) enhance the viewer experience, while content protection measures ensure security. Satellite television, including Dish Network, and cable television coexist, each offering unique advantages. Network security and technical support are essential for maintaining service quality. The ongoing unfolding of market activities reveals evolving patterns, with 8k resolution and 4k resolution emerging as the next frontier.
How is this Broadcasting Cable TV Industry segmented?
The broadcasting cable tv industry research report provides comprehensive data (region-wise segment analysis), with forecasts and estimates in "USD billion" for the period 2025-2029, as well as historical data from 2019-2023 for the following segments.
- Revenue Stream
- Advertising
- Subscription
- Application
- Satellite TV
- Cable TV
- Internet Protocol TV (IPTV)
- Others
- Service
- Entertainment
- News and sports
- Educational/documentary
- Geography
- North America
- US
- Canada
- Europe
- France
- Germany
- UK
- Middle East and Africa
- UAE
- APAC
- China
- India
- Japan
- South America
- Brazil
- Rest of World (ROW)
- North America
By Revenue Stream Insights
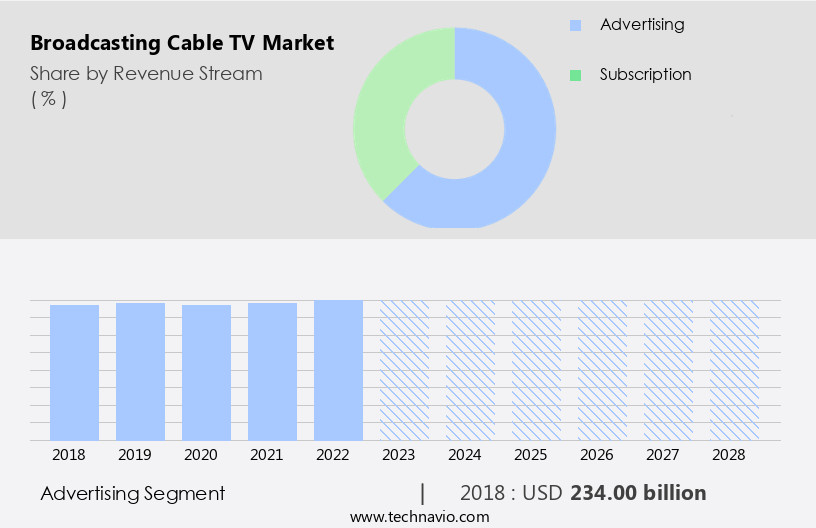
The advertising segment is estimated to witness significant growth during the forecast period.
The market is segmented into advertising and subscription revenue channels. In 2024, the advertising segment dominated the market due to the expansion of cable and satellite TV networks in rural areas and remote locations. This revenue model is applicable to both online and offline businesses, generating income through the sale of ad space. TV networks significantly rely on advertising, broadcasting commercials between shows and charging advertisers accordingly. Fiber optics and satellite uplinks facilitate the transmission of digital and high-definition content, enhancing the viewer experience. Interactive television and addressable advertising enable customized content delivery, boosting customer retention.
Subscription revenue is also a significant contributor, fueled by fiber-to-the-home (FTTH) and cable modem technologies. Streaming services like Amazon Prime Video, YouTube TV, and Sling TV have emerged as competitors, offering on-demand content and flexible subscription plans. Content licensing and acquisition are crucial aspects of the market, ensuring a diverse channel lineup for viewers. Network security and content protection measures are essential to safeguard against piracy and unauthorized access. The user interface (UI) and program guide facilitate easy navigation, while subscription management systems ensure seamless billing and customer service. Viewership ratings and audience measurement tools help networks optimize their content strategies and cater to viewer preferences.
The market continues to evolve, with advancements in 8k and 4k resolutions, ultra-high-definition television (UHDTV), and over-the-top (OTT) platforms shaping the future of broadcasting cable TV.
The Advertising segment was valued at USD 237.70 billion in 2019 and showed a gradual increase during the forecast period.
Regional Analysis
APAC is estimated to contribute 30% to the growth of the global market during the forecast period. Technavio's analysts have elaborately explained the regional trends and drivers that shape the market during the forecast period.
The market in North America is experiencing significant growth, driven by the increasing adoption of over-the-top (OTT) media streaming platforms and the expanding media and entertainment industry. In 2024, North America held the largest revenue share of the market, with the trend expected to continue. This growth can be attributed to the presence of numerous cable and satellite TV channels, broadcasting companies, and satellite manufacturers. Furthermore, the rise in cultural diversity in North America has led to an increase in the number of broadcast channels, fueling demand for broadcasting equipment. Interactive features such as addressable advertising, program guides, and customer retention strategies are also contributing to market growth.
The use of advanced technologies like fiber optics, fiber-to-the-home (FTTH), high-definition television (HDTV), ultra-high-definition television (UHDTV), and video compression are transforming the market. Content licensing, pay-per-view (PPV), and subscription revenue streams are also key revenue generators. Network security and content protection are crucial considerations in the market, with satellite uplinks and downlinks ensuring reliable transmission. Broadcast infrastructure, subscription management, and technical support are essential components of the market's ecosystem. Streaming services like Amazon Prime Video, Cox Communications, and Sling TV are gaining popularity, adding to the market's complexity. The use of remote controls, user interfaces (UI), and audience measurement tools like Nielsen ratings and viewership ratings are enhancing the user experience.
The market's future looks promising, with emerging technologies like 8K and 4K resolutions, coaxial cable, and satellite television providers like Dish Network and YouTube TV, shaping the landscape.
Market Dynamics
Our researchers analyzed the data with 2024 as the base year, along with the key drivers, trends, and challenges. A holistic analysis of drivers will help companies refine their marketing strategies to gain a competitive advantage.
In the dynamic and competitive market, providers continually strive to deliver innovative and engaging content to subscribers. This market encompasses various elements, including cable television networks, digital multicast channels, and video on demand services. Subscribers seek affordable packages offering a diverse range of channels, from sports and news to entertainment and educational programming. Advanced technologies, such as high-definition and 4K resolution, enhance the viewer experience. Additionally, the integration of streaming services and smart TV capabilities expands accessibility and convenience. Advertisers leverage targeted demographic reach and interactive commercials to engage audiences. The market is a vibrant and evolving industry, shaped by consumer preferences, technological advancements, and regulatory frameworks.
What are the key market drivers leading to the rise in the adoption of Broadcasting Cable TV Industry?
- TV broadcasters' growing investment in and advancement of their own Over-the-Top (OTT) platforms serve as the primary market driver.
- The market is experiencing growth due to the strategic development of Over-The-Top (OTT) platforms by TV broadcasters, offering historical content from extensive libraries. User-centric content selection and predictive analytics models integrated by media platforms enable the delivery of customized content. Additionally, bundled packages that offer internet connectivity alongside traditional TV subscriptions present significant opportunities for broadcasters, providing new revenue streams and mitigating cord-cutting scenarios.
- Video compression technologies, such as interactive television and fiber optics through fiber-to-the-home (FTTH), enhance user experience. Content protection measures, including satellite television and microwave transmission, ensure secure delivery. These advancements emphasize an immersive and harmonious viewing experience for customers, driving market growth.
What are the market trends shaping the Broadcasting Cable TV Industry?
- The expansion of Over-The-Top (OTT) delivery systems represents a significant market trend in the media and entertainment industry. This growth is driven by increasing consumer demand for on-demand, flexible, and convenient content access.
- The Over-the-Top (OTT) broadcasting market is experiencing notable growth in the television industry. OTT media services, delivered directly to viewers via their TVs, encompass content such as TV shows, movies, and other long and short-form programming. This trend is particularly significant for broadcast meteorologists and local TV stations, who can expand their reach through OTT delivery systems. In the US, the adoption of OTT services, including YouTube TV, Amazon Fire TV, Apple TV, and pay video-on-demand services like Netflix, has seen substantial growth. According to the Joint Annual Meeting and Exhibition (JAMESCO) Online International Symposium, the number of OTT users in the US has been increasing steadily.
- Broadcasters are investing in OTT infrastructure, including subscription management, addressable advertising, and advanced audience measurement tools, to cater to this growing demand. The OTT landscape is evolving rapidly, with advancements in technology enabling higher resolutions, such as 8k, and immersive viewing experiences. This shift towards OTT delivery is transforming the way audiences consume media, offering greater flexibility and convenience.
What challenges does the Broadcasting Cable TV Industry face during its growth?
- The stringent rules and regulations imposed by the Federal Communications Commission (FCC) represent a significant challenge to the growth of the industry. Adhering to these mandates can add complexity and cost to business operations, potentially hindering innovation and expansion.
- The global cable TV market is subject to regulations by the Federal Communications Commission (FCC), which oversees broadcast stations, repair of TV and radio stations, and commercial operators. Compliance with FCC norms, including public interest, convenience, and necessity requirements for station renewals, and prevention of broadcast decency and electromagnetic noise sources, presents challenges for market participants. In addition, the increasing popularity of streaming services such as Amazon Prime Video and Sling TV is disrupting the traditional cable TV market. Companies must invest in content acquisition and network security to maintain a competitive channel lineup and provide technical support and customer service to retain subscribers.
- Billing systems must also be robust to handle the complexities of various subscription models and pricing structures. The market dynamics are further influenced by advancements in technology, such as the adoption of 4k resolution, which increases the demand for higher quality content. However, the high cost of implementing these technologies and maintaining technical infrastructure may pose challenges for smaller players in the market. Overall, the global cable TV market is expected to experience significant growth during the forecast period, driven by the increasing demand for immersive and harmonious viewing experiences and the emphasis on providing superior customer service and technical support.
Exclusive Customer Landscape
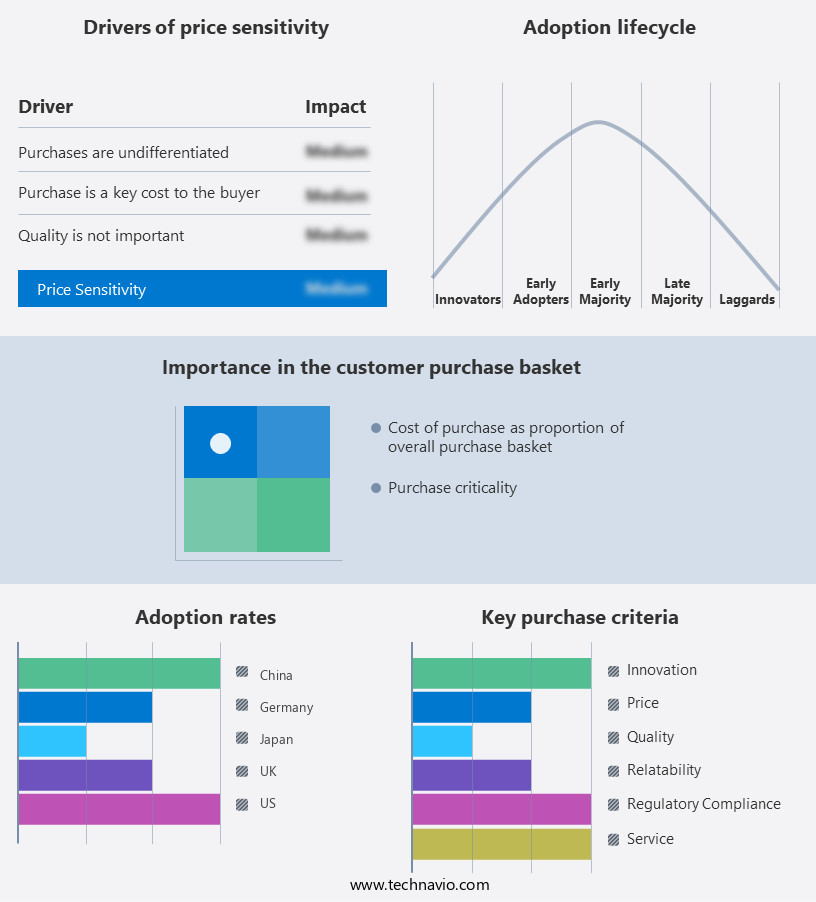
The broadcasting cable tv market forecasting report includes the adoption lifecycle of the market, covering from the innovator's stage to the laggard's stage. It focuses on adoption rates in different regions based on penetration. Furthermore, the broadcasting cable tv market report also includes key purchase criteria and drivers of price sensitivity to help companies evaluate and develop their market growth analysis strategies.
Customer Landscape
Key Companies & Market Insights
Companies are implementing various strategies, such as strategic alliances, broadcasting cable tv market forecast, partnerships, mergers and acquisitions, geographical expansion, and product/service launches, to enhance their presence in the industry.
AT and T Inc. - This company provides cable TV broadcasting services via AT&T Uverse TV, utilizing advanced technology for enhanced viewer experience.
The industry research and growth report includes detailed analyses of the competitive landscape of the market and information about key companies, including:
- AT and T Inc.
- BroadbandTV Corp.
- Comcast Corp.
- DISH Network L.L.C.
- Fox Corp.
- Google LLC
- Gray Television Inc.
- RTL Group SA
- SES SA
- Tokyo Broadcasting System International Inc.
- Verizon Communications Inc.
- Warner Bros. Discovery Inc.
- Zee Entertainment Enterprises Ltd.
Qualitative and quantitative analysis of companies has been conducted to help clients understand the wider business environment as well as the strengths and weaknesses of key industry players. Data is qualitatively analyzed to categorize companies as pure play, category-focused, industry-focused, and diversified; it is quantitatively analyzed to categorize companies as dominant, leading, strong, tentative, and weak.
Recent Development and News in Broadcasting Cable TV Market
- In January 2024, Comcast Corporation, the largest broadcasting cable TV provider in the United States, announced the launch of its new streaming service, Xfinity Stream Pro, which offers live TV, movies, and shows without the need for a set-top box (Comcast Corporation Press Release, 2024). This strategic move aimed to compete more effectively with emerging streaming services.
- In March 2024, Disney and Comcast reached a multi-year agreement, granting Disney's ESPN+ and Hulu services access to Comcast's Xfinity X1 and Flex platforms, expanding their reach to millions of additional households (Disney Press Release, 2024). This collaboration marked a significant strategic partnership in the market.
- In April 2025, AT&T's WarnerMedia announced the acquisition of Discovery Inc. For approximately USD43 billion, creating a media powerhouse with a combined reach of over 100 million subscribers (WarnerMedia Press Release, 2025). This merger was expected to enhance their content offerings and strengthen their position in the competitive market.
- In May 2025, the Federal Communications Commission (FCC) approved T-Mobile's and Sprint's merger, allowing them to combine their wireless and cable operations (FCC Press Release, 2025). This approval opened opportunities for these companies to expand their cable TV offerings and bundle services, potentially disrupting the traditional market.
Research Analyst Overview
- In the dynamic cable TV market, distribution channels continue to evolve, with marketing strategies focusing on optimizing signal-to-noise ratio (SNR) to ensure superior viewer experience. Amplitude modulation (AM) and frequency modulation (FM) are essential broadcast standards, but network congestion and bit rate challenges persist. To address these issues, media production houses employ advanced techniques like content creation, syndication, and aggregation, while adhering to strict error correction protocols. Media consumption trends indicate a preference for high-definition content, necessitating video and audio encoding innovations.
- Spectrum allocation remains a critical factor in channel capacity expansion, with technology adoption influencing the competitive landscape. Advertising effectiveness is a key performance indicator, driving investment in signal processing and media production technologies. Content creation and distribution are integral to customer segmentation strategies, ensuring a personalized viewing experience.
Dive into Technavio's robust research methodology, blending expert interviews, extensive data synthesis, and validated models for unparalleled Broadcasting Cable TV Market insights. See full methodology.
|
Market Scope |
|
|
Report Coverage |
Details |
|
Page number |
200 |
|
Base year |
2024 |
|
Historic period |
2019-2023 |
|
Forecast period |
2025-2029 |
|
Growth momentum & CAGR |
Accelerate at a CAGR of 2.1% |
|
Market growth 2025-2029 |
USD 36.7 billion |
|
Market structure |
Fragmented |
|
YoY growth 2024-2025(%) |
2.1 |
|
Key countries |
US, China, Canada, Japan, India, UK, Germany, France, Brazil, and UAE |
|
Competitive landscape |
Leading Companies, Market Positioning of Companies, Competitive Strategies, and Industry Risks |
What are the Key Data Covered in this Broadcasting Cable TV Market Research and Growth Report?
- CAGR of the Broadcasting Cable TV industry during the forecast period
- Detailed information on factors that will drive the growth and forecasting between 2025 and 2029
- Precise estimation of the size of the market and its contribution of the industry in focus to the parent market
- Accurate predictions about upcoming growth and trends and changes in consumer behaviour
- Growth of the market across North America, APAC, Europe, South America, and Middle East and Africa
- Thorough analysis of the market's competitive landscape and detailed information about companies
- Comprehensive analysis of factors that will challenge the broadcasting cable tv market growth of industry companies
We can help! Our analysts can customize this broadcasting cable tv market research report to meet your requirements.


