
What is the Size of Burial Insurance Market?
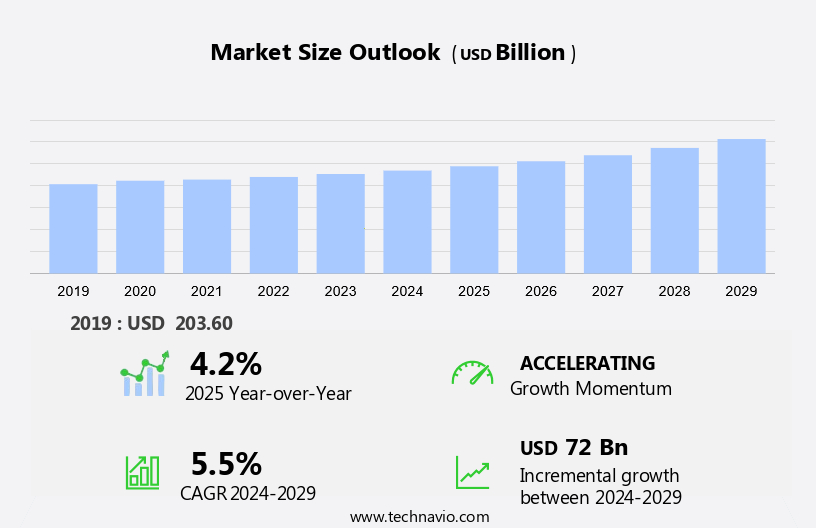
The burial insurance market size is forecast to increase by USD 72 billion and is estimated to grow at a CAGR of 5.5% between 2024 and 2029. The market is experiencing significant growth due to several key factors. The geriatric population is expanding, leading to a rise in demand for burial insurance. Additionally, there is an increasing focus on digitalization in the insurance industry, making it more convenient for consumers to purchase policies online. However, the market is also facing challenges such as misleading advertisements that may misrepresent the true cost and coverage of burial insurance policies. As the population ages and consumers seek out more efficient ways to plan for end-of-life expenses, the market is poised for continued growth. Digitalization is playing a crucial role in making these policies more accessible, but it is essential for insurers to maintain transparency and accuracy in their advertising to build trust and credibility with consumers.
Market Segmentation
The market research report provides comprehensive data (region-wise segment analysis), with forecasts and estimates in "USD billion" for the period 2025-2029, as well as historical data from 2019 - 2023 for the following segments.
- Age Group
- Seniors
- Pre-retirement individuals
- High-risk individuals
- Product Type
- Final expense life insurance
- Pre-need burial insurance
- Whole life burial insurance
- Guaranteed issue burial insurance
- Term burial insurance
- Geography
- North America
- Canada
- US
- Europe
- Germany
- UK
- France
- Italy
- APAC
- Japan
- South Korea
- South America
- Brazil
- Middle East and Africa
- North America
Which is the largest segment driving market growth?
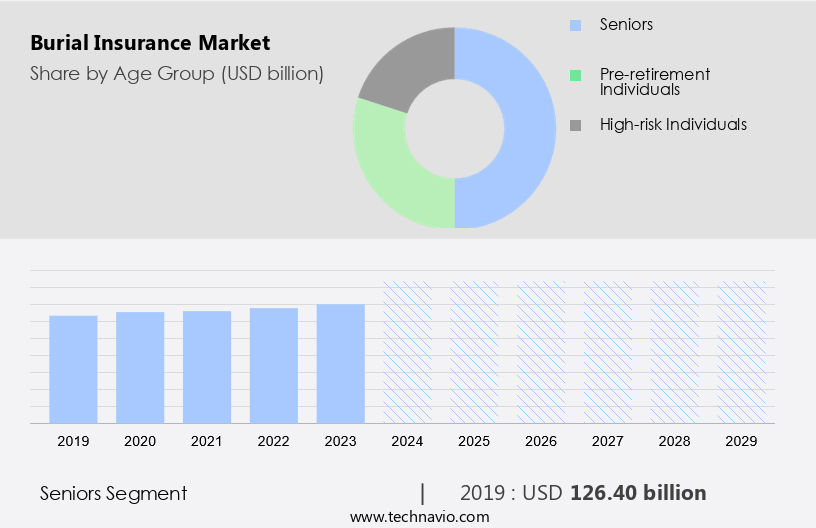
The seniors segment is estimated to witness significant growth during the forecast period. The market is gaining significance as the senior population continues to expand. Approximately 50% of the global population aged 60 and above is projected to reach 1.4 billion by 2030, and this demographic segment represents a substantial market opportunity.
Get a glance at the market share of various regions. Download the PDF Sample
The seniors segment was the largest segment and was valued at USD 126.40 billion in 2019. This trend presents a growing demand for burial insurance coverage. Burial insurance policies offer a predetermined coverage amount to cover funeral and burial expenses. Underwriting processes for these policies have been simplified, with some companies offering coverage without a medical exam requirement. This approach, known as simplified underwriting, caters to consumers with various health conditions. Agents play a crucial role in connecting consumers with the most suitable policies for their needs. Hence, such factors are fuelling the growth of this segment during the forecast period.
Which region is leading the market?
For more insights on the market share of various regions, Request Free Sample
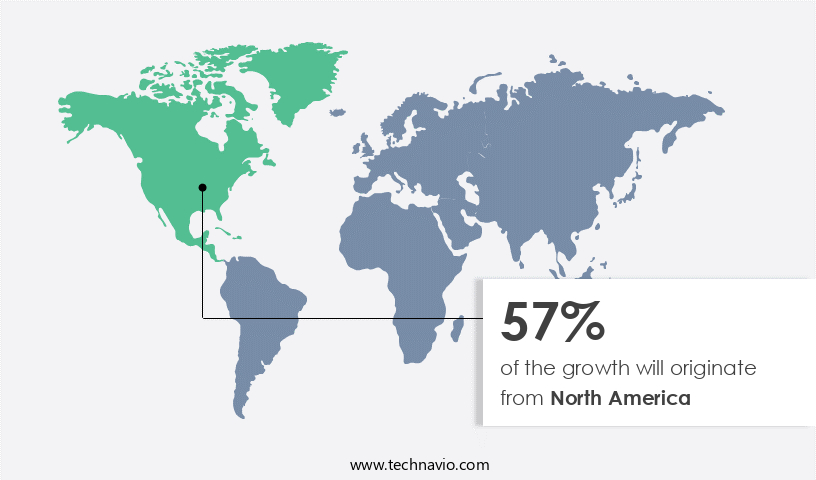
North America is estimated to contribute 57% to the growth of the global market during the forecast period. Technavio's analysts have elaborately explained the regional trends and drivers that shape the market during the forecast period. The North American market for burial insurance is witnessing notable expansion due to the increasing recognition among the aging population of the importance of long-term care planning. A recent survey involving over 1,700 participants underscored the significance of this issue, with 91% of respondents acknowledging the need to include long-term care in their retirement plans. This heightened awareness is fueling the demand for burial insurance in the region. In response to this trend, companies such as Transamerica are innovating to improve the customer experience. In March 2023, Transamerica introduced ConnectedClaimsSM, a range of customizable services aimed at streamlining access to workplace supplemental insurance benefits. This premium service offers policyholders a level of death benefit and guarantees acceptance without the need for a medical examination. With technological dependence on the rise, funeral cover continues to provide essential financial help for families during difficult times.
How do company ranking index and market positioning come to your aid?
Companies are implementing various strategies, such as strategic alliances, partnerships, mergers and acquisitions, geographical expansion, and product/service launches, to enhance their presence in the market.
AFLAC Inc: The company offers burial insurance such as immediate cash payout which provides a tax-free cash benefit to cover final expenses such as funeral costs.
Technavio provides the ranking index for the top 20 companies along with insights on the market positioning of:
- American International Group Inc.
- An Post Insurance
- Avalon Funeral Plans
- Banco Bilbao Vizcaya Argentaria SA
- Diaspora Insurance
- Dutch Association of Insurers
- Fidelity Life Association
- Gerber Life Insurance Co
- Global Atlantic Financial Group Ltd.
- Golden Leaves International Ltd
- Homesteaders Life Co
- Lampo Licensing, LLC
- Mutual of Omaha Insurance Co
- SENIOR LIFE INSURANCE CO
- State Farm Mutual Automobile Insurance Co.
- The Baltimore Life Insurance Co
- Transamerica Life Insurance Co
- United Heritage Life Insurance co
Explore our company rankings and market positioning. Request Free Sample
How can Technavio assist you in making critical decisions?
What is the market structure and year-over-year growth of the Market?
|
Market structure |
Fragmented |
|
YoY growth 2024-2025 |
4.2 |
Market Dynamics
Burial insurance, also known as funeral insurance or final expense insurance, is a type of insurance policy designed to cover the costs associated with end-of-life events. This insurance can provide peace of mind for individuals and families, ensuring that funeral expenses are covered and reducing financial burdens during a difficult time. In this comprehensive guide, we will explore the market, focusing on market dynamics, affordable options, and essential planning tips. Market Overview: The market is a growing industry, driven by an increasing awareness of the importance of end-of-life planning and the rising costs of funeral services. According to industry reports, the global funeral services market is projected to reach significant growth in the coming years. This growth is attributed to factors such as an aging population, cultural and religious beliefs, and the increasing trend towards personalized and memorable funeral homes and funeral services. Affordable Funeral Planning: Planning for end-of-life expenses can be a daunting task, especially when considering the potential costs of funeral services. Affordable funeral insurance policies offer coverage for a specified duration, ensuring that families are not left with unexpected financial burdens during their time of grief. These policies can cover various expenses, including funeral home services, burial or cremation costs, and memorial services. Pre-Need Funeral Planning: Pre-need funeral planning involves making arrangements for one's funeral before the need arises. This option allows individuals to choose their preferred funeral services and pay for them in advance, ensuring that their wishes are met and their loved ones are spared the emotional and financial burden of making arrangements during a difficult time. Pre-need funeral planning also offers the added benefit of locking in today's prices, protecting against potential future price increases. Our researchers analyzed the data with 2024 as the base year, along with the key drivers, trends, and challenges. A holistic analysis of drivers will help companies refine their marketing strategies to gain a competitive advantage.
What are the primary factors driving the market growth?
Growth of geriatric population drives the market. The market is experiencing notable growth due to the expanding aging population in the United States. By 2050, individuals aged 65 and above are projected to account for approximately 17% of the global population, surpassing the number of children under five years old. This demographic shift presents a substantial business opportunity for burial insurance providers. As people age, there is a heightened demand for financial solutions tailored to their unique requirements. Burial insurance, also referred to as funeral insurance or final expense insurance, offers coverage for funeral and burial costs.
Moreover, this type of insurance is gaining popularity due to its premium service, which provides peace of mind for seniors and their beneficiaries. Unlike traditional life insurance, burial insurance does not require a medical examination, making the application process more simplified and accessible for those with morbid conditions or complex medical histories. The market caters to various consumer segments, including low-income families and veterans, who may face financial hardships during end-of-life planning. Graded death benefit plans offer lower premiums for those with health conditions, allowing more people to afford coverage. Digital transformation is playing a significant role in the market's rapid adoption, with digital distribution channels and simplified underwriting processes streamlining the application process.
What are the significant trends being witnessed in the market?
Increasing focus on digitalization is a major trend in the market. The market is undergoing a transformation as consumers seek more premium services and flexible options for end-of-life planning. This shift is driven by various factors, including an aging population, technological dependence, and the rising cost of funeral expenses. Traditional burial insurance policies, which often require medical diagnostics and lengthy application processes, are being replaced by simplified issue and guaranteed acceptance policies that offer coverage without medical history scrutiny. Digital transformation is a key trend in the burial insurance sector, with companies adopting digital platforms to reach consumers and streamline operations.
Moreover, graded death benefit policies, which offer lower coverage amounts and premiums during the initial policy term, are gaining popularity among low-income individuals. Funeral directors associations and insurance agents are collaborating to offer pre-need insurance plans, which allow consumers to pre-fund funeral services and secure coverage for their final wishes. Whole life insurance and pre-paid funeral plans offer level death benefit coverage and peace of mind for policyholders, while pre-funded and post-funded plans help consumers manage healthcare expenses and funeral costs.
What are the major market challenges?
Misleading advertisement is a major challenge hindering the market. The market continues to evolve, offering various types of policies to cater to diverse consumer needs. Premium services, such as funeral cover and pre-need insurance, provide financial help for funeral expenses and enable consumers to plan ahead. Guaranteed acceptance policies do not require a medical examination, making them accessible to individuals with morbid conditions or health and wellness concerns. However, these policies often come with graded death benefits or higher premiums. The aging population and technological dependence have accelerated the adoption of digital platforms for purchasing burial insurance.
Moreover, digital distribution channels, including simplified issue funeral insurance and online platforms, offer flexibility and convenience. Consumers can easily compare coverage amounts, policy terms, and eligibility requirements from various agents and providers. Despite these advancements, the market faces challenges, including misleading advertisements on social media platforms. Deceptive ads claiming government-sponsored funeral benefits can lead to unwanted telemarketing and potential scams. Consumers should be aware of these risks and verify the legitimacy of advertisements and providers before engaging in any transactions. Beneficiaries of burial insurance policies receive death benefit payouts to cover funeral services, such as funeral directors' fees, cremation, and casket or graveyard expenses.
Exclusive Customer Landscape
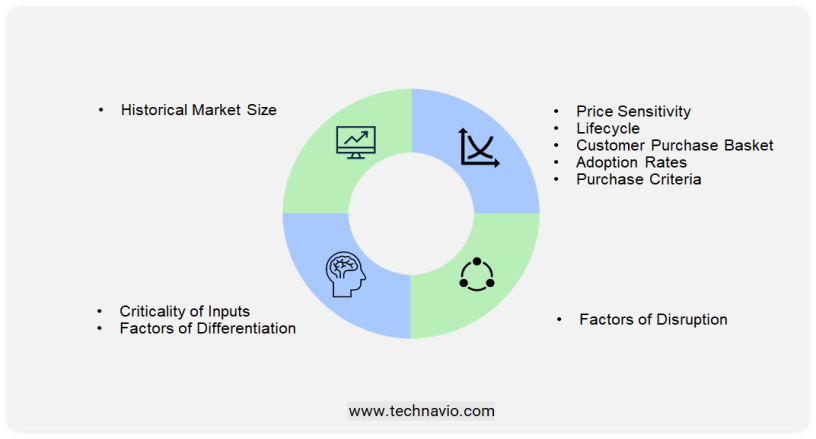
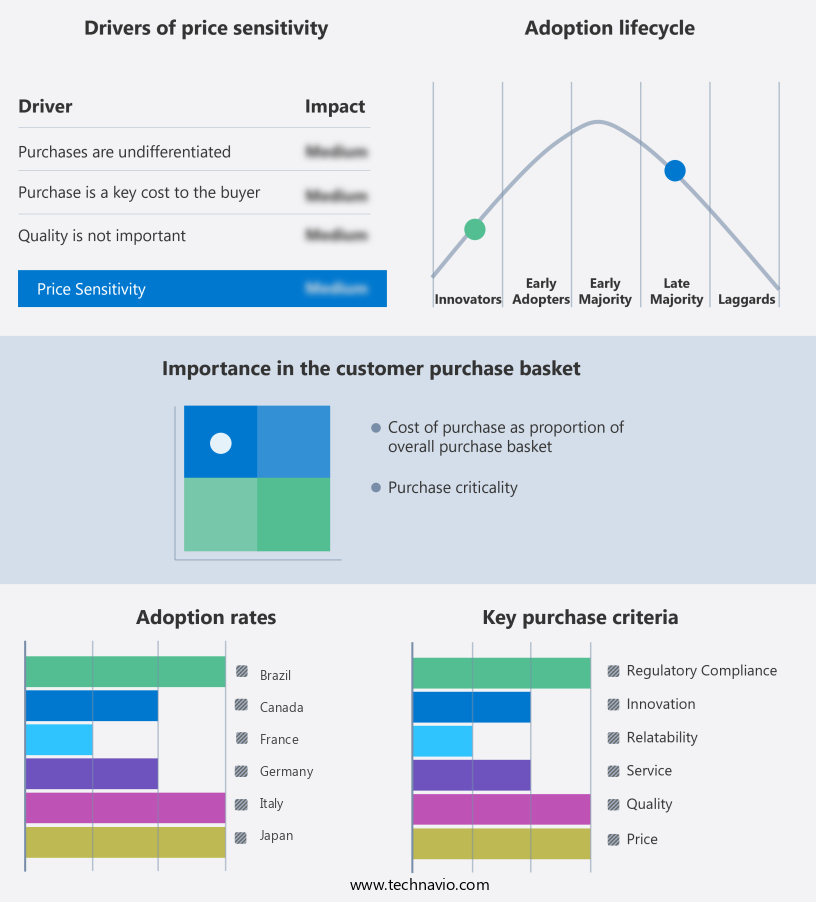
The market forecasting report includes the adoption lifecycle of the market, covering from the innovator's stage to the laggard's stage. It focuses on adoption rates in different regions based on penetration. Furthermore, the report also includes key purchase criteria and drivers of price sensitivity to help companies evaluate and develop their market growth analysis strategies.
Customer Landscape
Market Analyst Overview
The market is witnessing significant growth as the aging population continues to increase, resulting in a greater demand for premium services that offer financial help during end-of-life planning. This market caters to consumers seeking peace of mind by providing coverage for funeral expenses, ensuring their final wishes are fulfilled. Two primary types of burial insurance policies are available: traditional and simplified issue. Traditional policies require a medical examination, while simplified issue policies offer guaranteed acceptance, making them more accessible to individuals with morbid conditions or complex medical histories. Policy terms for burial insurance can range from short-term to long-term, with premium-paying terms allowing policyholders to pay their premiums for a specified period. Alternatively, whole life insurance offers lifelong coverage, providing a level death benefit to beneficiaries. Funeral costs, including funeral services, caskets, and graveyard plots, have been a significant factor driving the growth of the market. The scarcity of land and the increasing popularity of cremation have led to the emergence of pre-need and pre-funded plans, allowing consumers to plan and pay for their funeral expenses in advance. Technological dependence has also played a crucial role in the market's digital transformation. Consumers can now apply for policies online, access digital platforms for policy management, and receive direct mail communications from agents.
This convenience is particularly important for low-income families who may not have the resources to visit funeral homes or insurance agents in person. The funeral directors association plays a vital role in the market by providing valuable insights into consumer trends and preferences. They also offer guidance on funeral services, helping consumers make informed decisions regarding coverage amounts and policy durations. The market is growing as individuals seek financial security for end-of-life expenses. Funeral planning can be a daunting task, but funeral planning tips and funeral planning software are helping people navigate the process with ease. Burial insurance offers a way to cover funeral expenses, ensuring that funeral planning for seniors is more affordable. Funeral insurance for seniors provides peace of mind, offering coverage duration that matches their needs. It helps with affordable funeral options, including cremation services and burial services. Additionally, funeral home directories, online memorials, and funeral flowers assist with planning. Many individuals also incorporate estate planning, legacy planning, and life insurance for seniors to ensure comprehensive financial preparedness. As land scarcity and the demand for funeral attire rise, bereavement support and grief counseling remain essential in helping families cope with loss.
|
Market Scope |
|
|
Report Coverage |
Details |
|
Page number |
207 |
|
Base year |
2024 |
|
Historic period |
2019 - 2023 |
|
Forecast period |
2025-2029 |
|
Growth momentum & CAGR |
Accelerate at a CAGR of 5.5% |
|
Market growth 2025-2029 |
USD 72 billion |
|
Regional analysis |
North America, Europe, APAC, South America, and Middle East and Africa |
|
Performing market contribution |
North America at 57% |
|
Key countries |
US, Canada, UK, Germany, Brazil, France, Italy, Japan, The Netherlands, and South Korea |
|
Competitive landscape |
Leading Companies, market research, market report, market forecast, market trends ,market research and growth, Market Positioning of Companies, Competitive Strategies, and Industry Risks |
|
Key companies profiled |
AFLAC Inc., American International Group Inc., An Post Insurance, Avalon Funeral Plans, Banco Bilbao Vizcaya Argentaria SA, Diaspora Insurance, Dutch Association of Insurers, Fidelity Life Association, Gerber Life Insurance Co, Global Atlantic Financial Group Ltd., Golden Leaves International Ltd, Homesteaders Life Co, Lampo Licensing, LLC, Mutual of Omaha Insurance Co, SENIOR LIFE INSURANCE CO, State Farm Mutual Automobile Insurance Co., The Baltimore Life Insurance Co, Transamerica Life Insurance Co, and United Heritage Life Insurance co |
|
Market Segmentation |
Age Group (Seniors, Pre-retirement individuals, and High-risk individuals), Product Type (Final expense life insurance, Pre-need burial insurance, Whole life burial insurance, Guaranteed issue burial insurance, and Term burial insurance), and Geography (North America, Europe, APAC, South America, and Middle East and Africa) |
|
Customization purview |
If our report has not included the data that you are looking for, you can reach out to our analysts and get segments customized. |
What are the Key Data Covered in this Market Research Report?
- CAGR of the market during the forecast period
- Detailed information on factors that will drive the market growth and forecasting between 2025 and 2029
- Precise estimation of the size of the market and its contribution of the market in focus to the parent market
- Accurate predictions about upcoming market growth and trends and changes in consumer behavior
- Growth of the market across North America, Europe, APAC, South America, and Middle East and Africa
- Thorough analysis of the market's competitive landscape and detailed information about companies
- Comprehensive analysis of factors that will challenge the growth of market companies
 RIA -
RIA - 
