
Chocolate Market Size 2026-2030
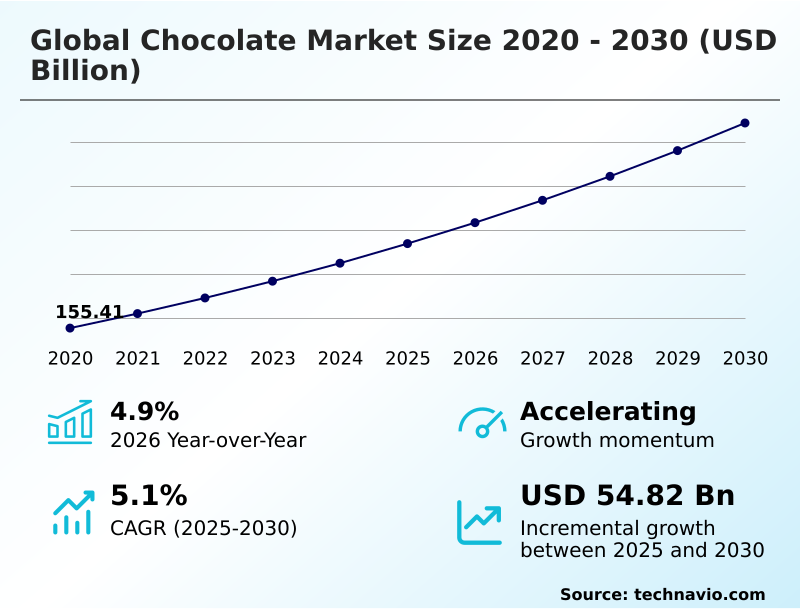
The chocolate market size is valued to increase by USD 54.82 billion, at a CAGR of 5.1% from 2025 to 2030. Strategic premiumization and artisanal innovation will drive the chocolate market.
Major Market Trends & Insights
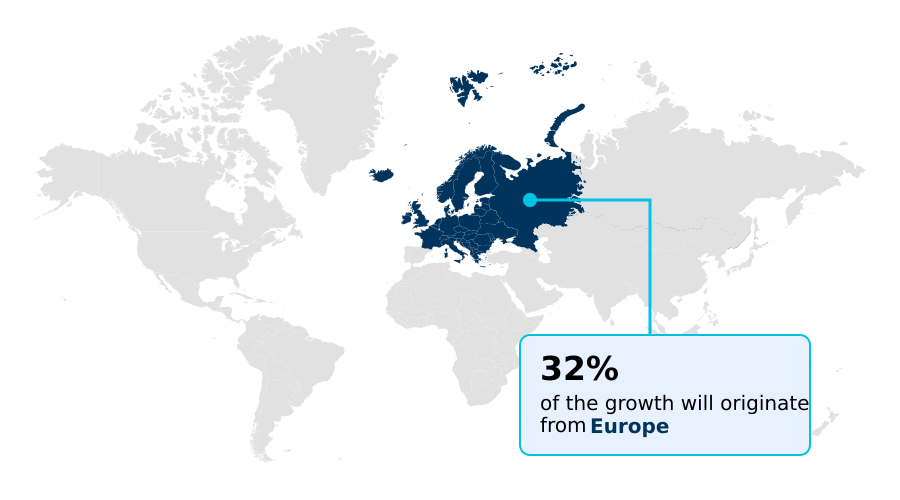
- Europe dominated the market and accounted for a 31.8% growth during the forecast period.
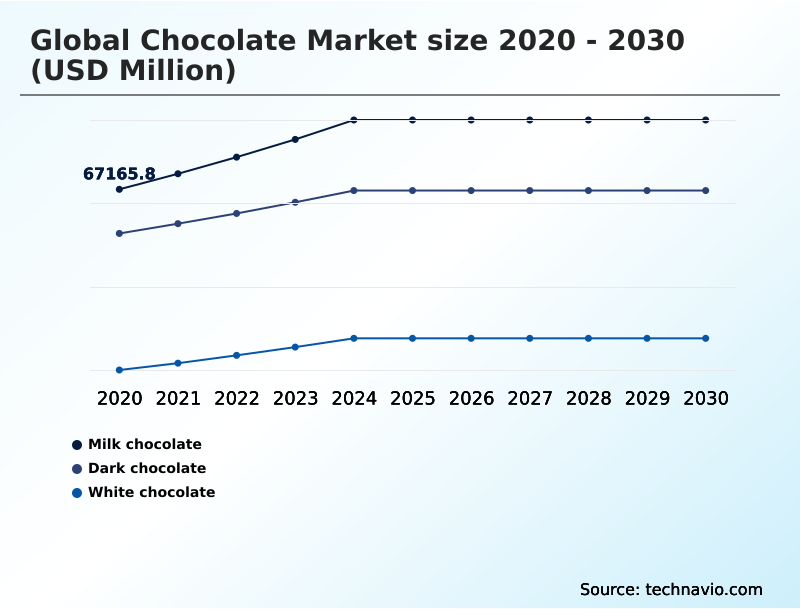
- By Product - Milk chocolate segment was valued at USD 81.38 billion in 2024
- By Distribution Channel - Offline segment accounted for the largest market revenue share in 2024
Market Size & Forecast
- Market Opportunities: USD 93.22 billion
- Market Future Opportunities: USD 54.82 billion
- CAGR from 2025 to 2030 : 5.1%
Market Summary
- The chocolate market is defined by a dynamic interplay between tradition and innovation, where consumer demand for indulgence is increasingly balanced with ethical and health considerations. Key drivers include a strategic shift toward premiumization, characterized by single-origin cocoa and bean-to-bar craftsmanship, and the integration of advanced technology for personalized product development.
- Trends such as flavor fusion and the adoption of circular economy principles for packaging reflect a sophisticated consumer base. A pivotal business scenario involves navigating supply chain resilience; manufacturers are now implementing agile hedging strategies and investing in climate-smart agriculture to mitigate the extreme volatility of raw material costs.
- This requires establishing direct-to-farm partnerships and leveraging traceability systems to ensure compliance with stringent deforestation regulations. Simultaneously, the challenge of reducing sugar content without compromising taste has spurred significant R&D into plant-based formulations and alternative sweeteners. Success in this landscape depends on balancing sensory experience with sustainable and transparent operational practices from bean to bar.
What will be the Size of the Chocolate Market during the forecast period?
Get Key Insights on Market Forecast (PDF) Get Free Sample
How is the Chocolate Market Segmented?
The chocolate industry research report provides comprehensive data (region-wise segment analysis), with forecasts and estimates in "USD million" for the period 2026-2030, as well as historical data from 2020-2024 for the following segments.
- Product
- Milk chocolate
- Dark chocolate
- White chocolate
- Distribution channel
- Offline
- Online
- Type
- Traditional
- Artificial
- Geography
- Europe
- UK
- Germany
- France
- North America
- US
- Canada
- Mexico
- APAC
- China
- India
- Indonesia
- South America
- Brazil
- Argentina
- Colombia
- Middle East and Africa
- Saudi Arabia
- UAE
- South Africa
- Rest of World (ROW)
- Europe
By Product Insights
The milk chocolate segment is estimated to witness significant growth during the forecast period.
The milk chocolate segment remains a significant category, driven by wide consumer appeal, but is undergoing a transformation beyond its traditional base.
A key premiumization strategy involves developing multi-textural formats and sophisticated plant-based chocolate formulation options, such as plant-based milk chocolate, to cater to health-conscious confectionery trends.
This chocolate confectionery innovation focuses on sensory profile analysis to balance classic creaminess with modern demands for reduced-sugar chocolate without compromising the chocolate viscosity achieved during the conching process.
The cocoa solids percentage is carefully managed to create differentiated specialty cocoa products.
Recent data shows consumer interest in traceable, high-quality ingredients has surged, with searches for premium attributes rising by over 90%, influencing even this mainstream segment and reinforcing the importance of strong premium chocolate branding.
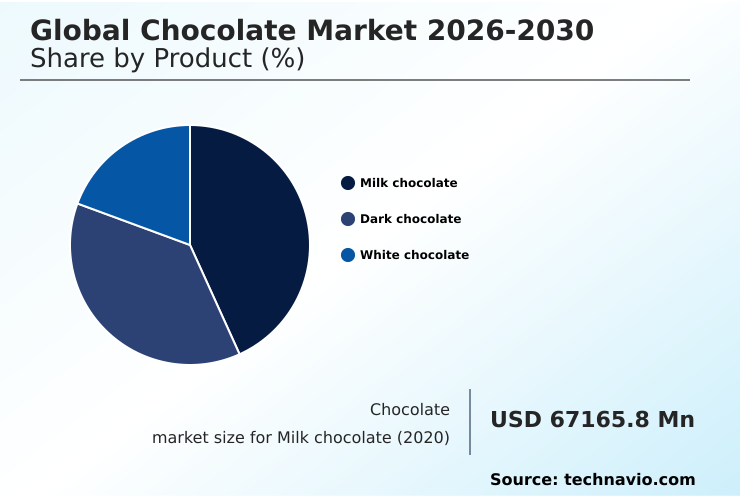
The Milk chocolate segment was valued at USD 81.38 billion in 2024 and showed a gradual increase during the forecast period.
Regional Analysis
Europe is estimated to contribute 31.8% to the growth of the global market during the forecast period.Technavio’s analysts have elaborately explained the regional trends and drivers that shape the market during the forecast period.
See How Chocolate Market Demand is Rising in Europe Get Free Sample
The market's geographic landscape is evolving, with emerging regions showing significant momentum.
Growth in the Middle East and Africa is outpacing mature markets like Europe by nearly a full percentage point, driven by a youthful demographic and rising demand for luxury confectionery. This shift is influencing sustainable cocoa sourcing strategies.
While Europe and North America collectively represent over 60% of incremental growth, their focus is on artisanal innovation and the craft chocolate movement. Here, supply chain transparency is paramount, compelling firms to adopt advanced traceability systems and cocoa traceability technology.
Compliance with new regulations necessitates geocoordinate tracking to validate ethically sourced chocolate claims.
This intense focus on ethical sourcing certification and fair trade cocoa certification is a direct response to consumer demand and helps mitigate risks associated with raw material volatility and artisanal chocolate production.
Market Dynamics
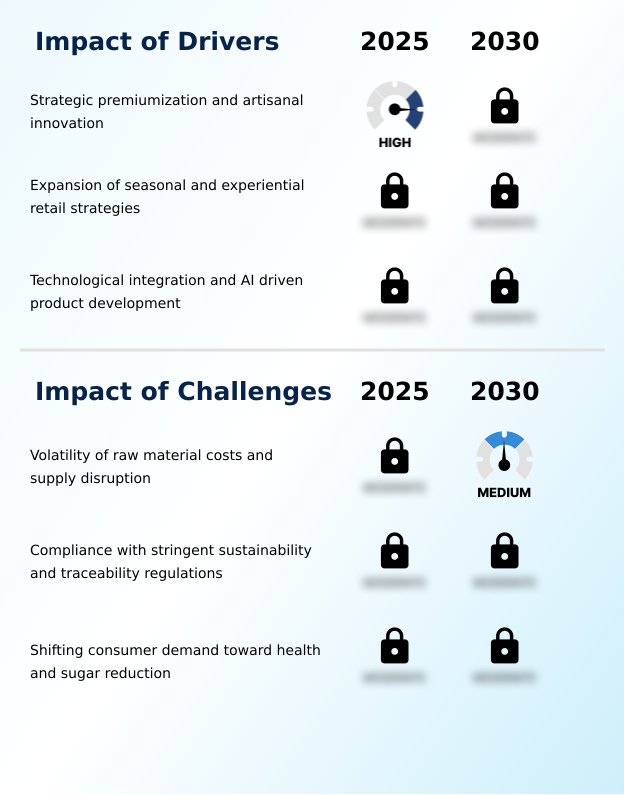
Our researchers analyzed the data with 2025 as the base year, along with the key drivers, trends, and challenges. A holistic analysis of drivers will help companies refine their marketing strategies to gain a competitive advantage.
- Navigating the impact of cocoa price on chocolate industry has become a primary strategic focus, forcing a re-evaluation of managing raw material costs in chocolate. This is closely tied to the challenges of ethical cocoa sourcing and the need to meet stringent deforestation regulations in cocoa, which often require data verification levels twice as stringent as previous import standards.
- These operational pressures are occurring as consumer trends in premium chocolate accelerate, driving premiumization strategies in confectionery market and the growth of vegan chocolate market.
- The role of AI in chocolate development is becoming crucial for creating innovations in sugar-reduced chocolate that also deliver on flavor, addressing the consumer demand for functional chocolate and the perceived health benefits of dark chocolate. Technological advancements in chocolate production are essential for scaling these new products.
- Simultaneously, companies are exploring experiential retail for luxury chocolate and capitalizing on seasonal trends in chocolate gifting to build brand loyalty. The future of cocoa-free chocolate alternatives represents a long-term hedge against supply chain risks in cocoa production.
- On the packaging front, the move toward a circular economy in chocolate packaging through sustainable packaging for confectionery products is now a consumer expectation, supported by traceability technology in cocoa supply chain. Finally, understanding regional preferences in chocolate flavors remains key to global success.
What are the key market drivers leading to the rise in the adoption of Chocolate Industry?
- Strategic premiumization and a focus on artisanal innovation are key market drivers, reflecting growing consumer demand for high-quality, ethically sourced, and unique chocolate products.
- Strategic drivers are reshaping the premium confectionery market. A core premiumization strategy focuses on single-origin cocoa and bean-to-bar craftsmanship, with consumer searches for such authentic products rising by over 90%.
- This trend elevates bean-to-bar chocolate makers and products like single-origin dark chocolate. Experiential retail and luxury chocolate gifting are also vital, with seasonal chocolate collections featuring novel formats driving significant growth.
- Advanced chocolate manufacturing techniques enable precise control over cocoa butter content and the application of sugar reduction technology to meet health trends.
- These innovations are underpinned by a focus on supply chain resilience, ensuring a consistent supply of high-quality ingredients for an increasingly discerning consumer base.
What are the market trends shaping the Chocolate Industry?
- A primary market trend involves strategic diversification through the fusion of hybrid flavors and textures. This innovation creates complex, multi-layered sensory experiences designed to appeal to a broader consumer demographic.
- Key market trends are redefining product development and packaging. Flavor fusion and sophisticated chocolate flavor pairing are creating complex sensory experiences, such as combining caramelized white chocolate with botanical extracts infusion. This appeals to consumers seeking novel gourmet chocolate ingredients. Simultaneously, the industry is accelerating its adoption of circular economy principles through innovative sustainable packaging solutions.
- Major brands now incorporate over 65% post-consumer resin in certain product lines, using advanced recycling to create food-grade recycled plastic. This push extends to ingredients, where upcycled food ingredients are gaining traction. The growth of the organic chocolate market is also influencing the rise of vegan chocolate alternatives, including new forms of non-dairy white chocolate to meet diverse dietary demands.
What challenges does the Chocolate Industry face during its growth?
- The extreme volatility of raw material costs and significant supply chain disruptions present a primary challenge to market stability, profit margins, and pricing strategies.
- The market faces significant hurdles, primarily from the severe cocoa price volatility impact and challenges in cocoa crop disease management. Record-high input costs, with some farmgate prices increasing by over 50% in a single season, are forcing producers to innovate. This includes reformulating products using alkalized cocoa powder or non-tempering fats to manage expenses.
- Another challenge is the growing demand for health-conscious confectionery, specifically reduced-sugar chocolate and high-percentage cocoa bars. Developing palatable plant-based chocolate formulation options for high-cocoa dark chocolate requires advanced tempering technology to manage chocolate viscosity and mouthfeel. Balancing the ideal cocoa solids percentage with new ingredients remains a technical challenge, impacting everything from production to direct-to-consumer chocolate sales.
Exclusive Technavio Analysis on Customer Landscape
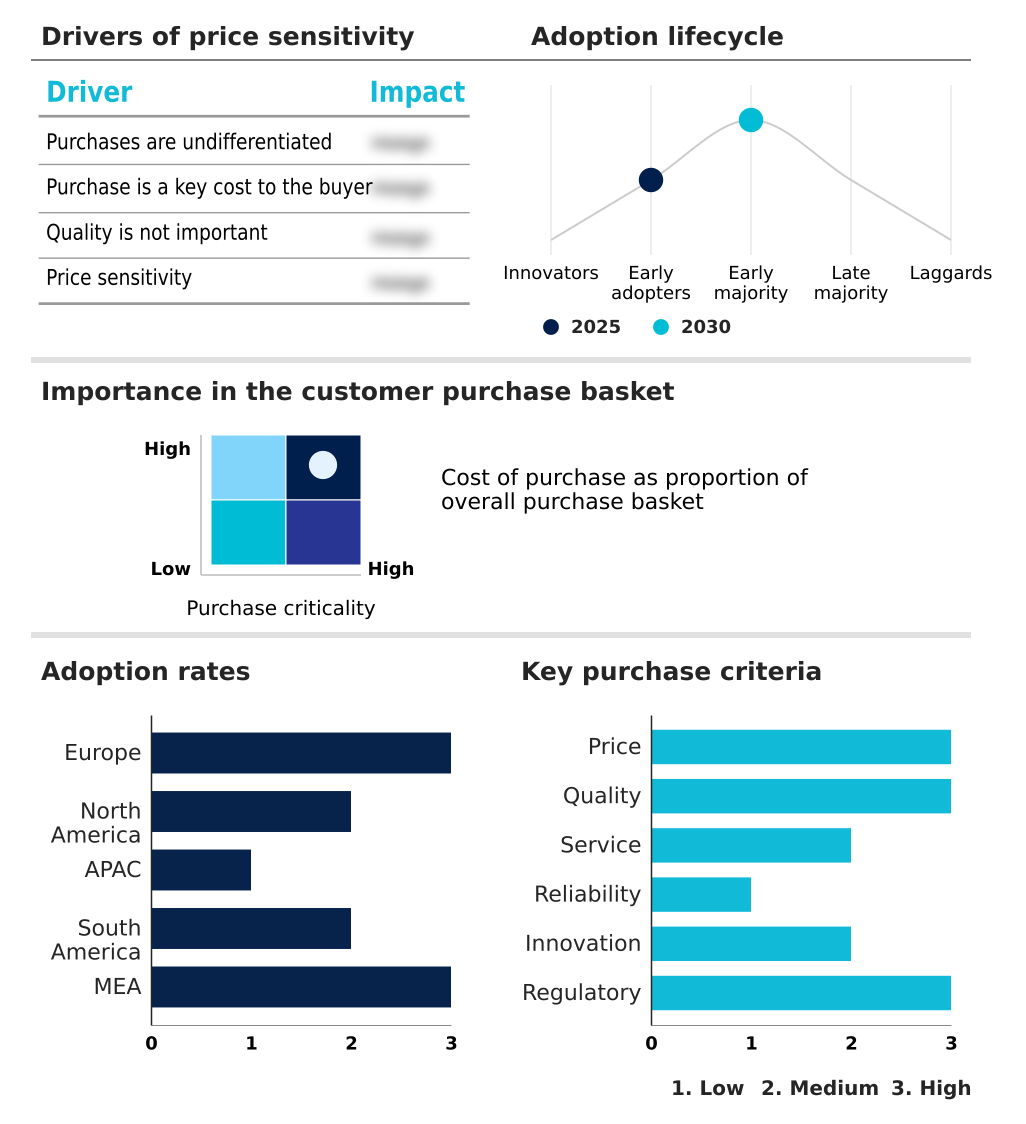
The chocolate market forecasting report includes the adoption lifecycle of the market, covering from the innovator’s stage to the laggard’s stage. It focuses on adoption rates in different regions based on penetration. Furthermore, the chocolate market report also includes key purchase criteria and drivers of price sensitivity to help companies evaluate and develop their market growth analysis strategies.
Customer Landscape of Chocolate Industry
Competitive Landscape
Companies are implementing various strategies, such as strategic alliances, chocolate market forecast, partnerships, mergers and acquisitions, geographical expansion, and product/service launches, to enhance their presence in the industry.
AUGUST STORCK KG - Vendors provide diverse cocoa and chocolate solutions, from industrial ingredients and coatings to finished confectionery products, addressing varied manufacturing and premium retail channel requirements.
The industry research and growth report includes detailed analyses of the competitive landscape of the market and information about key companies, including:
- AUGUST STORCK KG
- Barry Callebaut AG
- Blommer Chocolate Co.
- Cargill Inc.
- Cemoi
- Divine Chocolate Ltd.
- Ezaki Glico Co. Ltd.
- Ferrero International S.A.
- Ghirardelli Chocolate Co.
- ITC Ltd.
- Lindt and Sprungli AG
- Lotte Corp.
- Mars Inc.
- Meiji Holdings Co. Ltd.
- Mondelez International Inc.
- Nestle SA
- Olam Group Ltd.
- Perfetti Van Melle Group BV
- pladis Foods Ltd.
- The Hershey Co.
Qualitative and quantitative analysis of companies has been conducted to help clients understand the wider business environment as well as the strengths and weaknesses of key industry players. Data is qualitatively analyzed to categorize companies as pure play, category-focused, industry-focused, and diversified; it is quantitatively analyzed to categorize companies as dominant, leading, strong, tentative, and weak.
Recent Development and News in Chocolate market
- In November 2024, Barry Callebaut announced a long-term partnership with Planet A Foods to scale the production and distribution of ChoViva, a cocoa-free chocolate alternative, addressing supply chain sustainability.
- In October 2024, Ferrero North America revealed an investment exceeding USD 100 million for sports marketing campaigns, including the first-ever Super Bowl ad for its Kinder Bueno brand to boost market penetration.
- In May 2025, The Hershey Company expanded its portfolio with the launch of the Hershey Milk Chocolate with Caramel bar, capitalizing on consumer preference for multi-textured and filled chocolate formats.
- In March 2025, Lindt and Sprungli reinforced its experiential retail strategy by opening a new flagship store in London's Piccadilly Lights, offering exclusive products and customized consumer experiences.
Dive into Technavio’s robust research methodology, blending expert interviews, extensive data synthesis, and validated models for unparalleled Chocolate Market insights. See full methodology.
| Market Scope | |
|---|---|
| Page number | 294 |
| Base year | 2025 |
| Historic period | 2020-2024 |
| Forecast period | 2026-2030 |
| Growth momentum & CAGR | Accelerate at a CAGR of 5.1% |
| Market growth 2026-2030 | USD 54821.7 million |
| Market structure | Fragmented |
| YoY growth 2025-2026(%) | 4.9% |
| Key countries | UK, Germany, France, Italy, Spain, The Netherlands, US, Canada, Mexico, China, India, Indonesia, Japan, Australia, South Korea, Brazil, Argentina, Colombia, Saudi Arabia, UAE, South Africa, Egypt and Turkey |
| Competitive landscape | Leading Companies, Market Positioning of Companies, Competitive Strategies, and Industry Risks |
Research Analyst Overview
- The chocolate market is defined by a strategic pivot toward value-added production and operational resilience. Boardroom decisions now center on mitigating raw material volatility through agile hedging strategies and direct sustainable cocoa sourcing programs, a necessity after farmgate prices in key regions rose by over 50% in one season.
- This focus on supply chain resilience is complemented by artisanal innovation and a premiumization strategy. Bean-to-bar craftsmanship using single-origin cocoa is no longer niche, influencing sensory profile analysis and formulations. Innovations in sugar reduction technology and plant-based chocolate formulation, including non-dairy white chocolate and caramelized white chocolate, are critical for market penetration.
- Advanced tempering technology and control over cocoa butter content allow for multi-textural formats with unique flavor fusion.
- Success now hinges on integrating traceability systems, ethical sourcing certification, and circular economy principles, from cacao fermentation and the conching process to the use of food-grade recycled plastic and post-consumer resin, ensuring compliance with standards like geocoordinate tracking while managing chocolate viscosity, cocoa solids percentage, and ingredients like alkalized cocoa powder or non-tempering fats.
- This includes developing cocoa-free alternatives via precision fermentation and investing in climate-smart agriculture and experiential retail to engage consumers seeking high-cocoa dark chocolate with botanical extracts infusion.
What are the Key Data Covered in this Chocolate Market Research and Growth Report?
-
What is the expected growth of the Chocolate Market between 2026 and 2030?
-
USD 54.82 billion, at a CAGR of 5.1%
-
-
What segmentation does the market report cover?
-
The report is segmented by Product (Milk chocolate, Dark chocolate, and White chocolate), Distribution Channel (Offline, and Online), Type (Traditional, and Artificial) and Geography (Europe, North America, APAC, South America, Middle East and Africa)
-
-
Which regions are analyzed in the report?
-
Europe, North America, APAC, South America and Middle East and Africa
-
-
What are the key growth drivers and market challenges?
-
Strategic premiumization and artisanal innovation, Volatility of raw material costs and supply disruption
-
-
Who are the major players in the Chocolate Market?
-
AUGUST STORCK KG, Barry Callebaut AG, Blommer Chocolate Co., Cargill Inc., Cemoi, Divine Chocolate Ltd., Ezaki Glico Co. Ltd., Ferrero International S.A., Ghirardelli Chocolate Co., ITC Ltd., Lindt and Sprungli AG, Lotte Corp., Mars Inc., Meiji Holdings Co. Ltd., Mondelez International Inc., Nestle SA, Olam Group Ltd., Perfetti Van Melle Group BV, pladis Foods Ltd. and The Hershey Co.
-
Market Research Insights
- The market is evolving through chocolate confectionery innovation and a pivot toward the premium confectionery market. A focus on ethically sourced chocolate and supply chain transparency is now standard, with some initiatives diverting over 100 tonnes of plastic from landfills through sustainable packaging solutions.
- The craft chocolate movement, driven by bean-to-bar chocolate makers, emphasizes gourmet chocolate ingredients and unique chocolate flavor pairing. This addresses a demand for authenticity, where searches for single-origin dark chocolate have surged by 94%.
- Furthermore, the rise of vegan chocolate alternatives and health-conscious confectionery is pushing the boundaries of product formulation, including plant-based milk chocolate and reduced-sugar chocolate options that appeal to new consumer segments.
We can help! Our analysts can customize this chocolate market research report to meet your requirements.
 RIA -
RIA - 
