
Cleanroom Consumables Market Size 2025-2029
The cleanroom consumables market size is forecast to increase by USD 7.18 billion, at a CAGR of 7.3% between 2024 and 2029.
- The market is experiencing significant growth due to the increasing adoption of cleanrooms in various industries, including pharmaceuticals, electronics, and biotechnology. This trend is driven by the stringent regulations and quality standards that necessitate the use of cleanrooms to ensure product purity and consistency. Moreover, the growing awareness regarding modular cleanrooms, which offer cost-effective solutions with easy installation and dismantling, is further fueling market growth. However, the high operational costs associated with cleanrooms remain a substantial challenge for market participants. These costs include the expense of maintaining a controlled environment, energy consumption, and the cost of consumables such as filters, gowns, and other disposables.
- Companies seeking to capitalize on market opportunities must focus on optimizing their cleanroom operations to minimize costs while maintaining the required standards. Additionally, investments in research and development of cost-effective and sustainable cleanroom solutions could provide a competitive edge. Navigating these challenges requires a strategic approach to supply chain management, cost optimization, and continuous improvement in cleanroom technology.
What will be the Size of the Cleanroom Consumables Market during the forecast period?

The market continues to evolve, driven by the dynamic nature of cleanroom applications across various sectors. Cleanroom air handling systems are constantly being optimized to maintain stringent environmental conditions, ensuring the integrity of critical environments. Cleanroom tools, such as mops and furniture, are engineered to minimize contamination and adhere to ISO standards. Cleanroom research and development initiatives are pushing the boundaries of innovation, leading to advancements in cleanroom gowning and compliance solutions. Critical environments demand rigorous monitoring, with environmental monitoring systems providing real-time data on particle size and microbial sampling. Cleanroom process control and facility management require continuous attention, with cleanroom certification and validation protocols ensuring adherence to stringent standards.
Cleanroom material handling solutions, including filters, containers, and labels, are designed to minimize contamination risks. Cleanroom HVAC systems are essential for maintaining optimal cleanroom conditions, while cleanroom training and certification programs equip professionals with the necessary skills to manage these complex environments. Cleanroom compliance and cleanroom validation are ongoing processes, with continuous improvement a key focus for market participants. ISO standards play a crucial role in shaping the market, driving innovation and ensuring adherence to stringent regulations. Cleanroom tapes, for instance, are engineered to provide effective ESD protection, while cleanroom air purification systems ensure the removal of airborne particles.
The market is a critical component of the broader industrial landscape, with ongoing research and development initiatives driving innovation and pushing the boundaries of cleanroom technology. The market's continuous evolution reflects the dynamic nature of cleanroom applications and the need for ongoing improvement and adaptation to meet the evolving demands of critical environments.
How is this Cleanroom Consumables Industry segmented?
The cleanroom consumables industry research report provides comprehensive data (region-wise segment analysis), with forecasts and estimates in "USD million" for the period 2025-2029, as well as historical data from 2019-2023 for the following segments.
- Product
- Safety consumables
- Cleaning consumables
- Cleanroom stationery
- End-user
- Semiconductor industry
- Pharmaceutical industry
- Hospitals
- Others
- Distribution Channel
- Direct sales
- Online retailers
- Specialized distributors
- OEMs
- Geography
- North America
- US
- Canada
- Europe
- France
- Germany
- UK
- APAC
- Australia
- China
- India
- Japan
- South Korea
- Rest of World (ROW)
- North America
By Product Insights
The safety consumables segment is estimated to witness significant growth during the forecast period.
In the realm of cleanrooms, where maintaining stringent cleanliness standards is paramount to ensure safety and productivity, a myriad of consumables play a crucial role. Among these, gloves and safety apparel are essential safety components. Cleanroom gloves, crafted from materials like latex, nitrile, or neoprene, serve as a barrier against particles, liquids, and chemicals, thereby protecting the hands of workers from contamination. In the intricate world of semiconductor manufacturing, gloves are indispensable, preventing the transfer of oils or other contaminants onto delicate microchips. Safety apparel, another vital consumable, includes cleanroom garments designed to minimize the risk of contamination.
These garments often incorporate ESD protection, ensuring an electrostatic-free environment, and are made from materials that meet ISO standards for cleanroom applications. In addition, cleanroom waste management solutions, filters, swabs, process control tools, and training programs are integral parts of the cleanroom ecosystem, all working in harmony to maintain a critical environment that prioritizes contamination control and compliance.
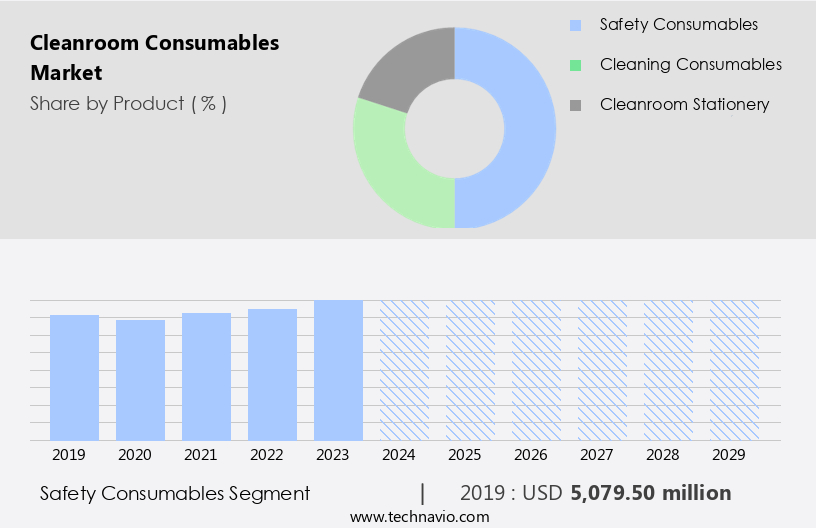
The Safety consumables segment was valued at USD 5.08 billion in 2019 and showed a gradual increase during the forecast period.
Regional Analysis
APAC is estimated to contribute 65% to the growth of the global market during the forecast period. Technavio's analysts have elaborately explained the regional trends and drivers that shape the market during the forecast period.

The market in the Asia Pacific region is experiencing significant growth due to the increasing adoption of cleanroom technology across various industries and the stringent regulations and standards for contamination control. The semiconductor industry, particularly in countries like China, Japan, and Korea, is driving this demand. As major players in semiconductor manufacturing, these countries require cleanrooms to ensure the quality and reliability of electronic components. Consequently, there is a high demand for cleanroom consumables such as gloves, garments, wipes, and adhesive mats. Cleanroom design, monitoring, and certification are crucial aspects of this industry, with particle size and contamination levels being key concerns.
ESD protection, material handling, process control, and facility management are also essential components of cleanroom operations. Cleanroom consumables include filters, certification, bags, papers, wipes, training, validation, HVAC, mops, furniture, and various other tools and supplies. Research and development in cleanroom technology and critical environments continue to evolve, with a focus on immersive, harmonious, and strike designs that emphasize contamination control and compliance with ISO standards. Cleanroom gowning and compliance are also essential practices in this industry, with environmental monitoring playing a crucial role in maintaining a cleanroom's integrity.
Market Dynamics
Our researchers analyzed the data with 2024 as the base year, along with the key drivers, trends, and challenges. A holistic analysis of drivers will help companies refine their marketing strategies to gain a competitive advantage.
What are the key market drivers leading to the rise in the adoption of Cleanroom Consumables Industry?
- The increasing adoption of cleanroom consumables is a primary factor driving market growth across various industries.
- Cleanrooms are essential controlled environments that minimize contamination and ensure the production of high-quality and safe products across various industries. The market is experiencing growth due to the increasing awareness of the importance of maintaining cleanroom standards. These consumables are vital components used to prevent contamination and preserve cleanroom integrity. They include gloves, apparel, wipes, face masks, shoe covers, and adhesive mats, among others. These consumables are designed to meet stringent cleanroom requirements and are integral to maintaining a clean and controlled environment.
- Cleanroom audits, microbial sampling, particle counting, cleanroom cleaning solutions, cleanroom air purification, cleanroom containers, cleanroom labels, and cleanroom dispensers are all crucial aspects of cleanroom management that the market caters to. The market's growth is driven by the need for enhanced product quality, increased regulatory compliance, and the continuous advancement of cleanroom technology.
What are the market trends shaping the Cleanroom Consumables Industry?
- The increasing recognition of modular cleanrooms signifies a significant market trend. This modern approach to controlled environments offers numerous advantages, making it a popular choice for various industries.
- Modular cleanrooms have emerged as a preferred solution in the market, catering to industries such as pharmaceuticals, biotechnology, electronics, and healthcare. These structures offer numerous advantages, including flexibility, which sets them apart from traditional cleanrooms. Modular cleanrooms are designed with interchangeable components, enabling easy modifications and expansions without requiring significant structural changes. This flexibility allows companies to optimize their cleanroom space according to their evolving needs, leading to cost savings in the long run. Cleanroom air handling, tools, mops, furniture, gowning, compliance, environmental monitoring, and tapes are essential components of modular cleanrooms. These consumables adhere to ISO standards, ensuring a critical environment.
- Modifications in research and development continually influence the market, necessitating the use of advanced cleanroom consumables to maintain stringent cleanroom conditions. Companies prioritize cleanroom compliance and environmental monitoring to maintain product quality and prevent contamination. Cleanroom consumables play a crucial role in maintaining a harmonious and immersive cleanroom environment. They are designed to strike a balance between functionality and ease of use, emphasizing efficiency and cost-effectiveness. Companies invest in these consumables to ensure their cleanroom operations run smoothly and meet industry regulations. The modular market is driven by the evolving needs of various industries and the importance of maintaining a critical environment.
- Companies continue to prioritize flexibility, cost savings, and regulatory compliance when selecting cleanroom consumables. Recent research indicates that this trend is expected to continue, underscoring the importance of staying informed about the latest advancements and offerings in the market.
What challenges does the Cleanroom Consumables Industry face during its growth?
- The escalating operational costs linked to cleanroom maintenance represent a significant challenge impeding industry expansion.
- Cleanrooms are essential controlled environments used in industries where stringent cleanliness standards are required, such as pharmaceuticals, biotechnology, and semiconductor manufacturing. The high cost of cleanrooms is primarily attributed to the intricate engineering and construction involved. These facilities necessitate specialized HVAC systems to maintain the desired cleanliness levels and temperature control. These systems filter out particulates and regulate airflow, ensuring a highly purified environment. Cleanroom consumables play a vital role in maintaining the cleanliness of these environments. These include cleanroom vials, swabs, gloves, and material handling equipment. Contamination levels in cleanrooms must be kept at a minimum to ensure the integrity of medical devices and other products manufactured within them.
- Cleanroom design incorporates ESD protection to prevent electrostatic discharge, which can lead to contamination. Cleanroom monitoring systems continuously measure and record environmental conditions to ensure compliance with established standards. Cleanroom consumables are designed to meet these specific requirements, ensuring the preservation of the cleanroom environment. The market is driven by the need for stringent cleanliness standards in industries such as pharmaceuticals, biotechnology, and semiconductor manufacturing. The high cost of constructing and maintaining cleanrooms necessitates the use of high-quality consumables to ensure the longevity and effectiveness of these facilities.
Exclusive Customer Landscape
The cleanroom consumables market forecasting report includes the adoption lifecycle of the market, covering from the innovator's stage to the laggard's stage. It focuses on adoption rates in different regions based on penetration. Furthermore, the cleanroom consumables market report also includes key purchase criteria and drivers of price sensitivity to help companies evaluate and develop their market growth analysis strategies.

Customer Landscape
Key Companies & Market Insights
Companies are implementing various strategies, such as strategic alliances, cleanroom consumables market forecast, partnerships, mergers and acquisitions, geographical expansion, and product/service launches, to enhance their presence in the industry.
3M Co. - This company specializes in providing high-quality cleanroom consumables to ensure optimal contamination control in various industries.
The industry research and growth report includes detailed analyses of the competitive landscape of the market and information about key companies, including:
- 3M Co.
- Alpha Pro Tech Ltd.
- Ansell Ltd.
- Aramark
- Berkshire Corp.
- Cole Parmer Instrument Co. LLC
- Contec Inc.
- DuPont de Nemours Inc.
- Dycem Ltd.
- Foamtec International WCC
- Helapet ltd.
- High Tech Conversions Inc.
- ITW Contamination Control BV
- Kimberly Clark Corp.
- Micronclean Ltd.
- Micronova Manufacturing Inc.
- STERIS Plc.
- Terra Universal Inc.
- Thermo Fisher Scientific Inc.
- Valutek Inc.
Qualitative and quantitative analysis of companies has been conducted to help clients understand the wider business environment as well as the strengths and weaknesses of key industry players. Data is qualitatively analyzed to categorize companies as pure play, category-focused, industry-focused, and diversified; it is quantitatively analyzed to categorize companies as dominant, leading, strong, tentative, and weak.
Recent Development and News in Cleanroom Consumables Market
- In January 2023, 3M, a leading manufacturer of cleanroom consumables, launched its new line of HEPA filters, the 3M Filtrete HEPA HVAC Filters, designed specifically for use in cleanroom environments. These filters offer enhanced efficiency and improved particle capture, ensuring better air quality and increased protection for sensitive applications (3M Press Release).
- In May 2024, DuPont and Ion Science, a leading provider of gas and particle detection solutions, announced their strategic partnership to develop advanced cleanroom monitoring systems. This collaboration combines DuPont's cleanroom consumables expertise with Ion Science's gas and particle detection technology, aiming to provide comprehensive cleanroom solutions for various industries (DuPont Press Release).
- In October 2024, Terra Universal, a prominent cleanroom consumables supplier, acquired Bio-Microbic Systems, a leading manufacturer of microbiological air samplers and monitoring systems. This acquisition strengthens Terra Universal's position in the cleanroom market by expanding its product portfolio and enhancing its capabilities in microbiological monitoring solutions (Terra Universal Press Release).
- In March 2025, the European Union (EU) implemented new regulations for cleanroom certification, increasing the requirements for particle count and cleanroom design standards. This regulatory change is expected to drive demand for advanced cleanroom consumables and technologies to meet the new regulations (European Commission Press Release).
Research Analyst Overview
- The market encompasses a diverse range of products essential for maintaining stringent cleanroom environments. Key components include vacuum cleaners, air filtration systems, and low particle emission equipment, such as Ultra-Low Particulate Air (ULPA) filters and HEPA filters. Cleanroom documentation and validation services are integral to ensuring regulatory compliance, while swab systems and surface sampling facilitate cleanroom risk assessment. Reusable consumables, such as mop systems and nonwoven fabrics, offer cost savings but require rigorous cleaning and maintenance. Cleanroom HVAC systems, microbial air samplers, and cleanroom qualification plans are crucial for maintaining high purity levels. Cleanroom Material Testing and Cleanroom Design Standards guide the selection of appropriate construction materials.
- Cleanroom Standard Operating Procedures (SOPs) and monitoring equipment enable continuous cleanroom performance evaluation. Low extractable consumables minimize contamination risks. Cleanroom validation reports provide evidence of successful cleanroom qualification. In summary, the market is dynamic, driven by the need for advanced filtration technologies, rigorous documentation, and continuous monitoring to ensure high-purity environments.
Dive into Technavio's robust research methodology, blending expert interviews, extensive data synthesis, and validated models for unparalleled Cleanroom Consumables Market insights. See full methodology.
|
Market Scope |
|
|
Report Coverage |
Details |
|
Page number |
230 |
|
Base year |
2024 |
|
Historic period |
2019-2023 |
|
Forecast period |
2025-2029 |
|
Growth momentum & CAGR |
Accelerate at a CAGR of 7.3% |
|
Market growth 2025-2029 |
USD 7184.1 million |
|
Market structure |
Fragmented |
|
YoY growth 2024-2025(%) |
6.7 |
|
Key countries |
China, US, Japan, India, South Korea, Germany, Australia, UK, Canada, and France |
|
Competitive landscape |
Leading Companies, Market Positioning of Companies, Competitive Strategies, and Industry Risks |
What are the Key Data Covered in this Cleanroom Consumables Market Research and Growth Report?
- CAGR of the Cleanroom Consumables industry during the forecast period
- Detailed information on factors that will drive the growth and forecasting between 2025 and 2029
- Precise estimation of the size of the market and its contribution of the industry in focus to the parent market
- Accurate predictions about upcoming growth and trends and changes in consumer behaviour
- Growth of the market across APAC, North America, Europe, South America, and Middle East and Africa
- Thorough analysis of the market's competitive landscape and detailed information about companies
- Comprehensive analysis of factors that will challenge the cleanroom consumables market growth of industry companies
We can help! Our analysts can customize this cleanroom consumables market research report to meet your requirements.
 RIA -
RIA - 
