Commercial Aircraft Electronic Flight Bag (EFB) Systems Market Analysis North America, APAC, Europe, Middle East and Africa, South America - US, China, India, Germany, France - Size and Forecast 2024-2028

Commercial Aircraft Electronic Flight Bag (EFB) Systems Market Analysis North America, APAC, Europe, Middle East and Africa, South America - US, China, India, Germany, France - Size and Forecast 2024-2028

Published: Feb 2024 177 Pages SKU: IRTNTR45841

Market Overview at a Glance

$1.11 B
Market Opportunity
9.05%
CAGR
8.33
YoY growth 2023-2024(%)

Commercial Aircraft Electronic Flight Bag (EFB) Systems Market Size 2024-2028

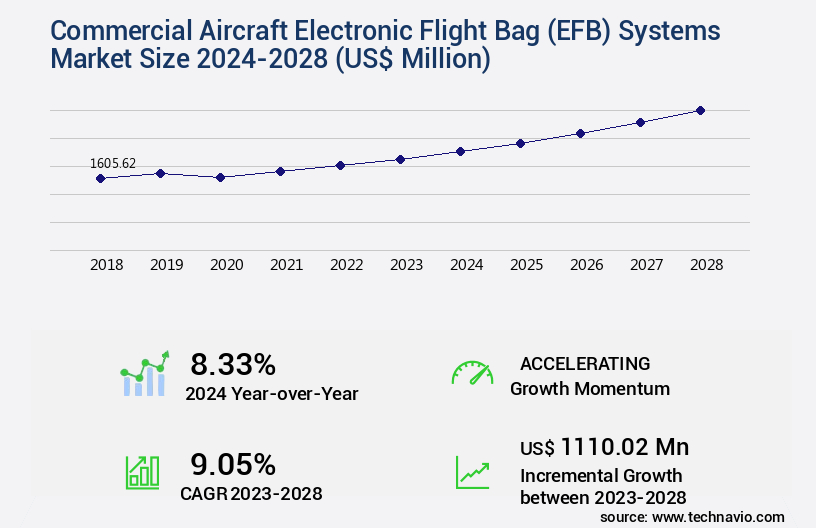
The commercial aircraft electronic flight bag (EFB) systems market size is valued to increase USD 1.11 billion, at a CAGR of 9.05% from 2023 to 2028. Use of advanced avionics systems for commercial aircraft will drive the commercial aircraft electronic flight bag (efb) systems market.

Major Market Trends & Insights

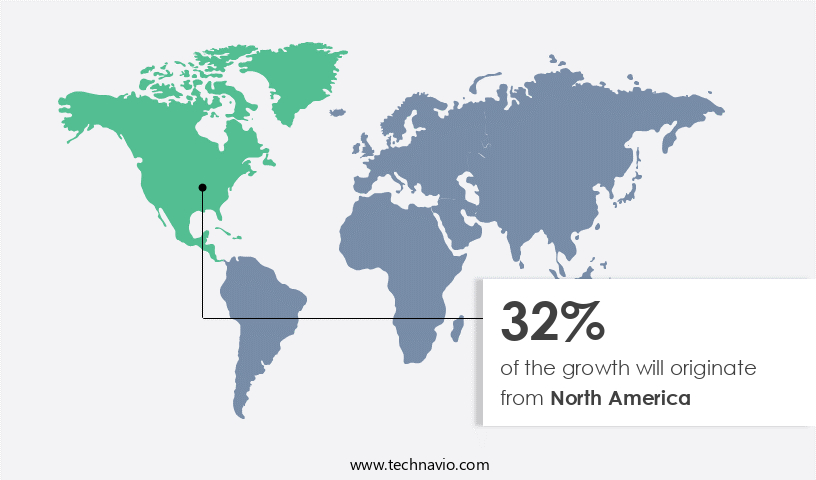
  • North America dominated the market and accounted for a 32% growth during the forecast period.
  • By Type - Class I/ABC segment was valued at USD 715.79 billion in 2022
  • By Application - Narrow-body aircraft segment accounted for the largest market revenue share in 2022

Market Size & Forecast

  • Market Opportunities: USD 96.60 million
  • Market Future Opportunities: USD 1110.02 million
  • CAGR : 9.05%
  • North America: Largest market in 2022

Market Summary

  • The market represents a dynamic and continually evolving sector in the aviation industry. EFB systems, which integrate advanced avionics and portable tablet computers, are revolutionizing cockpit operations by providing real-time information and enhancing situational awareness. Core technologies, such as wireless connectivity and graphical user interfaces, are driving the evolution of EFB systems. Applications, including flight planning, navigation, and real-time weather information, are expanding the capabilities of these systems.
  • Service types, such as hardware maintenance and software updates, ensure the continuous functionality of EFB systems. Regulatory compliance, particularly with regards to safety and security, is a significant challenge for market players. Despite these challenges, opportunities abound in the form of increasing demand for fuel efficiency and reduced operational costs. Innovations in advanced avionics systems, such as synthetic vision and electronic charts, are further enhancing the value proposition of EFB systems. However, the presence of software errors and program issues in Automatic Dependent Surveillance-Broadcast (ADS-B) systems poses a significant challenge to market growth. In conclusion, the Commercial Aircraft EFB Systems Market is a vibrant and evolving sector, characterized by ongoing innovation, regulatory compliance, and the pursuit of operational efficiency.

What will be the Size of the Commercial Aircraft Electronic Flight Bag (EFB) Systems Market during the forecast period?

Commercial Aircraft Electronic Flight Bag (EFB) Systems Market Size

Get Key Insights on Market Forecast (PDF) Request Free Sample

How is the Commercial Aircraft Electronic Flight Bag (EFB) Systems Market Segmented and what are the key trends of market segmentation?

The commercial aircraft electronic flight bag (efb) systems industry research report provides comprehensive data (region-wise segment analysis), with forecasts and estimates in "USD million" for the period 2024-2028, as well as historical data from 2018-2022 for the following segments.

  • Type
    • Class I/ABC
    • Class II/ABC
    • Class III/ABC
  • Application
    • Narrow-body aircraft
    • Wide-body aircraft
    • Regional jet
  • Geography
    • North America
      • US
    • Europe
      • France
      • Germany
    • APAC
      • China
      • India
    • Rest of World (ROW)

By Type Insights

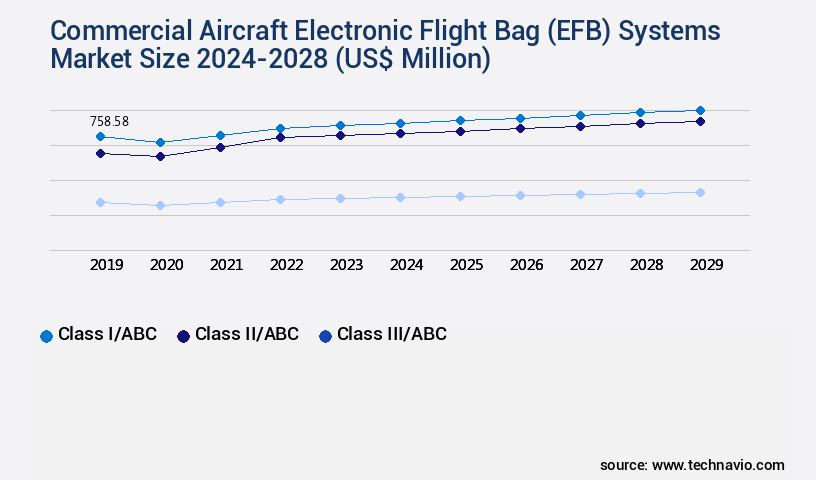
The class i/abc segment is estimated to witness significant growth during the forecast period.

Commercial Aircraft Electronic Flight Bag (EFB) systems have gained significant traction in the aviation industry, with adoption reaching approximately 35% of global aircraft fleets. These systems offer a range of features designed to enhance operational efficiency and safety. Communication systems enable real-time data exchange between crew members and ground personnel, while maintenance tracking systems facilitate proactive maintenance planning. Airport diagrams display and runway analysis tools assist pilots in navigating complex airport environments. Crew resource management tools improve teamwork and decision-making, and electronic checklists streamline pre-flight procedures. Regulatory compliance standards ensure the secure implementation of these systems, with display technology features offering high-resolution, sunlight-readable screens for optimal visibility.

Document management systems allow for easy access to essential documents, while wireless communication protocols enable seamless connectivity. Flight deck integration ensures a cohesive cockpit experience, with fuel management systems providing real-time data on fuel consumption and performance calculations. Navigation data integration offers accurate and up-to-date information, and system security protocols protect sensitive data. Flight manual access, in-flight entertainment, and flight planning tools further enhance the value of EFB systems. The market for these systems is projected to grow, with industry experts anticipating expansion in various sectors, including business aviation and regional airlines. Approximately 50% of the global business jet fleet is expected to adopt EFB systems by 2025.

Furthermore, the integration of advanced technologies, such as artificial intelligence and machine learning, is expected to drive innovation and improve system functionality. EFB systems are evolving to meet the demands of the modern aviation landscape, offering a comprehensive suite of tools designed to optimize operational efficiency, enhance safety, and improve the overall flying experience.

Commercial Aircraft Electronic Flight Bag (EFB) Systems Market Size

Request Free Sample

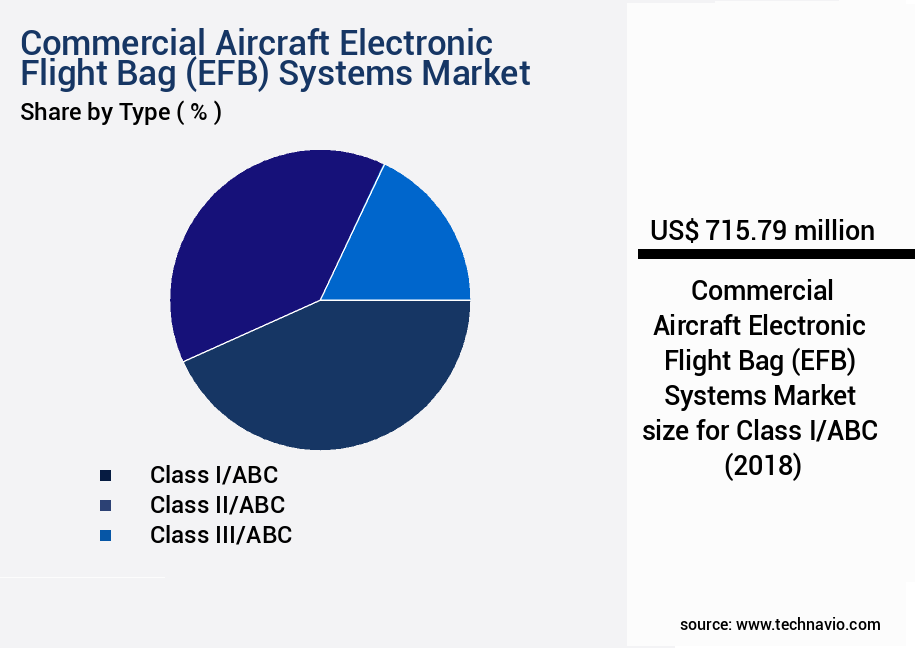
The Class I/ABC segment was valued at USD 715.79 billion in 2018 and showed a gradual increase during the forecast period.

Commercial Aircraft Electronic Flight Bag (EFB) Systems Market Size

Request Free Sample

Regional Analysis

North America is estimated to contribute 32% to the growth of the global market during the forecast period.Technavio's analysts have elaborately explained the regional trends and drivers that shape the market during the forecast period.

Commercial Aircraft Electronic Flight Bag (EFB) Systems Market Share by Geography

See How Commercial Aircraft Electronic Flight Bag (EFB) Systems Market Demand is Rising in North America Request Free Sample

The North American commercial aircraft manufacturing sector experiences significant growth, driven by its extensive aviation industry and advanced technology solutions. With over one-third of the global operational fleets, this region is a key contributor to the market's demand. Major players like Boeing, Embraer, and Bombardier, based in North America, have a global presence, further boosting the industry's impact. The region's robust manufacturing and connectivity network support the modernization of commercial fleets through maintenance, repair, and overhaul (MRO) services. These upgrade activities reflect the demand for efficient and technologically advanced components and parts. The sector's importance is underscored by the presence of a substantial number of aircraft in operation, making North America a significant player in the global commercial aviation landscape.

Market Dynamics

Our researchers analyzed the data with 2023 as the base year, along with the key drivers, trends, and challenges. A holistic analysis of drivers will help companies refine their marketing strategies to gain a competitive advantage.

The market is witnessing significant growth as airlines and aviation organizations increasingly adopt advanced digital solutions to streamline operations and enhance pilot efficiency. EFB integration with aircraft systems is a key trend, enabling real-time data access and analysis, improving situational awareness, and reducing pilot workload. EFB data visualization techniques are essential for effective decision-making, with graphical representations offering quicker insights than text-based data. The impact of EFB on pilot workload reduction is substantial, with studies indicating an average decrease of up to 30% in workload during critical phases of flight. EFB system lifecycle management is another crucial aspect, requiring a systematic approach to hardware platform selection, software development lifecycle, and data analytics and reporting.

Advanced EFB features and capabilities, such as wireless connectivity reliability, user interface design best practices, data security and encryption protocols, and regulatory compliance challenges, are essential considerations for market players. More than 70% of new EFB implementations across fleets focus on enhancing operational efficiency and reducing costs. Advanced EFB systems are gaining popularity due to their ability to provide real-time performance metrics, enabling airlines to optimize fleet utilization and improve maintenance planning. Comparatively, the adoption rates of EFB systems in smaller airlines and regional carriers lag behind their larger counterparts, presenting significant growth opportunities for market players.

This disparity can be attributed to the high upfront costs and the need for specialized expertise in implementing and managing these systems. In conclusion, the commercial aircraft EFB systems market is poised for continued growth, driven by the need for improved operational efficiency, enhanced pilot situational awareness, and regulatory compliance. Market players must focus on addressing the unique challenges of hardware platform selection, software development lifecycle, data analytics and reporting, and regulatory compliance to capture market share and maintain a competitive edge.

Commercial Aircraft Electronic Flight Bag (EFB) Systems Market Size

What are the key market drivers leading to the rise in the adoption of Commercial Aircraft Electronic Flight Bag (EFB) Systems Industry?

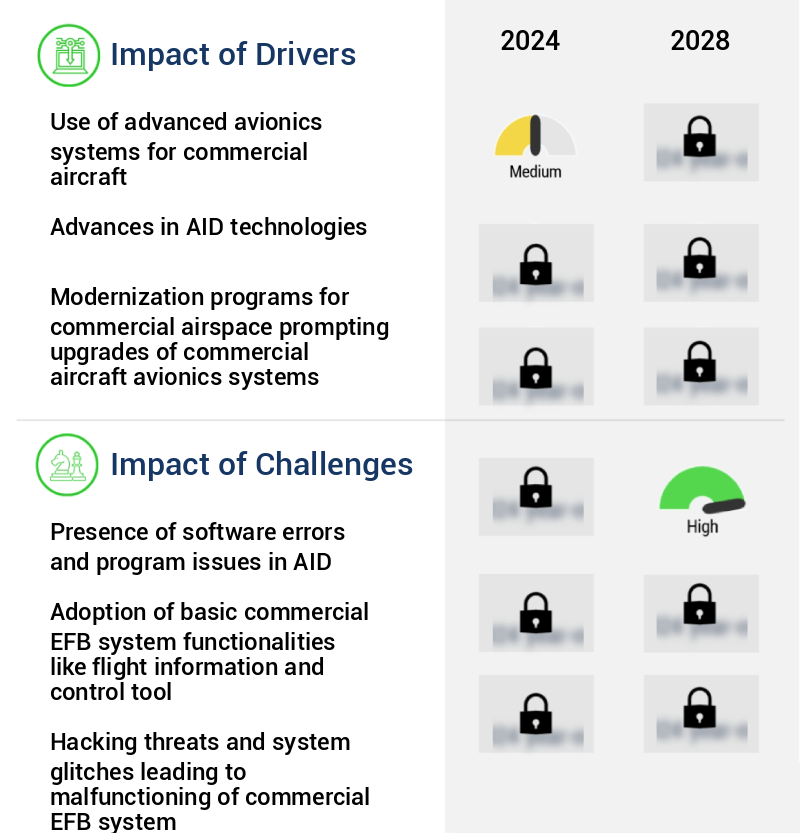
  • The use of advanced avionics systems is a mandatory and key driver for the commercial aircraft market, enhancing safety, efficiency, and overall performance. 
  • The aviation industry is governed by regulatory bodies like the European Union Aviation Safety Agency (EASA), FAA, and the International Civil Aviation Organization (ICAO), prioritizing passenger, cargo, and crew safety. Automation plays a pivotal role in achieving these objectives. By enhancing flight operational safety and aircraft efficiency, automation reduces operational costs, a crucial factor for commercial airlines catering to vast passenger numbers.
  • Modern aircraft are equipped with advanced avionics systems, including autopilot, communications, navigation, surveillance systems, and electrical emergency systems. Autopilot, a proven safety aid, is essential during adverse weather conditions, low visibility, or congested airspace. The integration of automation significantly contributes to the aviation sector's ongoing evolution, ensuring a safer, more efficient, and cost-effective travel experience.

What are the market trends shaping the Commercial Aircraft Electronic Flight Bag (EFB) Systems Industry?

  • The trend in the market involves innovations in portable tablet computers. Portable tablet computers are the subject of current market advancements.
  • The aviation industry is witnessing significant technological advancements in aircraft connectivity, with technology providers continually enhancing the flight deck experience. New features, such as Electronic Flight Bags (EFBs) and portable devices, are gaining popularity, necessitating upgrades or replacements of interface devices. The shift towards software-driven solutions is reducing the dominance of integrated devices (class I, II, and III architecture). However, this transition brings technical complications, necessitating proper certifications from aviation agencies.
  • As the use of these advanced systems becomes more prevalent, they will increasingly replace traditional methods, offering numerous benefits, including improved communication, navigation, and operational efficiency. The adoption of these technologies is a continuous process, with ongoing developments and evolving patterns shaping the aviation sector.

What challenges does the Commercial Aircraft Electronic Flight Bag (EFB) Systems Industry face during its growth?

  • The presence of software errors and program issues in Artificial Intelligence and Deep Learning (AID) systems poses a significant challenge to the industry's growth, as these complications hinder advancements and efficiency in the development and implementation of innovative technologies. 
  • The aerospace sector is witnessing a significant shift towards real-time flight data analysis software applications to optimize operational costs. Numerous aircraft component manufacturers are investing in upgrading system software and incorporating new features. For instance, UTC Aerospace Systems introduced OpsInsight Electronic Flight Folder, an advanced tool for pre-flight planning and post-flight analysis. Designed for iPads, this application streamlines flight planning and enables crew members to review all relevant Notice to Air Missions (NOTAMs) prior to takeoff. During flights, OpsInsight compares actual performance data against calculated values for time and fuel consumption, offering valuable insights for enhancing operational efficiency.
  • This trend signifies the continuous evolution of the aerospace industry, with software solutions playing a pivotal role in driving cost savings and improving overall performance.

Exclusive Technavio Analysis on Customer Landscape

The commercial aircraft electronic flight bag (efb) systems market forecasting report includes the adoption lifecycle of the market, covering from the innovator's stage to the laggard's stage. It focuses on adoption rates in different regions based on penetration. Furthermore, the commercial aircraft electronic flight bag (efb) systems market report also includes key purchase criteria and drivers of price sensitivity to help companies evaluate and develop their market growth analysis strategies.

Commercial Aircraft Electronic Flight Bag (EFB) Systems Market Share by Geography

 Customer Landscape of Commercial Aircraft Electronic Flight Bag (EFB) Systems Industry

Competitive Landscape

Companies are implementing various strategies, such as strategic alliances, commercial aircraft electronic flight bag (efb) systems market forecast, partnerships, mergers and acquisitions, geographical expansion, and product/service launches, to enhance their presence in the industry.

Airbus SE - This company specializes in providing a range of digital cameras, including the Canon EOS 1500D, Canon EOS 200D, and Canon EOS R10 models. These cameras offer advanced features and high-quality imaging capabilities for photography enthusiasts and professionals. The company's commitment to innovation and technology ensures that its products meet the evolving needs of the market.

The industry research and growth report includes detailed analyses of the competitive landscape of the market and information about key companies, including:

  • Airbus SE
  • Anuvu Operations LLC
  • Astronautics Corp. of America
  • Astronics Corp.
  • Carlisle Companies Inc.
  • Collins Aerospace
  • Deutsche Lufthansa AG
  • Honeywell International Inc.
  • L3Harris Technologies Inc.
  • Teledyne Technologies Inc.
  • Thales Group
  • Viasat Inc.
  • Apprimus Informatik GmbH
  • CMC Electronics Inc.
  • DextraData GmbH
  • International Flight Support
  • Keyzo IT Solutions Ltd.

Qualitative and quantitative analysis of companies has been conducted to help clients understand the wider business environment as well as the strengths and weaknesses of key industry players. Data is qualitatively analyzed to categorize companies as pure play, category-focused, industry-focused, and diversified; it is quantitatively analyzed to categorize companies as dominant, leading, strong, tentative, and weak.

Recent Development and News in Commercial Aircraft Electronic Flight Bag (EFB) Systems Market

  • In January 2024, Thales, a leading provider of avionics and electronic systems for the aerospace industry, announced the successful certification of its AvantX EFB (Electronic Flight Bag) system by the European Union Aviation Safety Agency (EASA) and the Federal Aviation Administration (FAA) (Thales press release, 2024). This certification enables Thales to offer its AvantX system to commercial airlines operating in both Europe and North America.
  • In March 2024, Garmin International, a global leader in aviation technology, launched its new G3X Touch integrated flight deck solution, featuring an EFB system with wireless datalink capabilities, providing real-time weather information and aviation databases (Garmin press release, 2024). This innovation allows pilots to access essential flight information wirelessly, enhancing safety and operational efficiency.
  • In April 2025, Honeywell Aerospace and Lufthansa Systems, a subsidiary of Lufthansa Group, entered into a strategic partnership to integrate Honeywell's EFB systems into Lufthansa's cockpit solutions (Honeywell press release, 2025). This collaboration aims to provide airlines with a more comprehensive and integrated avionics solution, enhancing safety and operational efficiency.
  • In May 2025, Boeing announced that its 737 MAX aircraft would be equipped with Apple iPads as part of the standard EFB system, replacing traditional paper charts and manuals (Boeing press release, 2025). This move represents a significant shift towards digital solutions in commercial aviation and is expected to reduce weight, improve reliability, and lower costs for airlines.

Dive into Technavio's robust research methodology, blending expert interviews, extensive data synthesis, and validated models for unparalleled Commercial Aircraft Electronic Flight Bag (EFB) Systems Market insights. See full methodology.

Market Scope

Report Coverage

Details

Page number

177

Base year

2023

Historic period

2018-2022

Forecast period

2024-2028

Growth momentum & CAGR

Accelerate at a CAGR of 9.05%

Market growth 2024-2028

USD 1110.02 million

Market structure

Fragmented

YoY growth 2023-2024(%)

8.33

Key countries

US, China, India, Germany, and France

Competitive landscape

Leading Companies, Market Positioning of Companies, Competitive Strategies, and Industry Risks

Request Free Sample

Research Analyst Overview

  • The Commercial Aircraft Electronic Flight Bag (EFB) market continues to evolve, with innovative technologies shaping the aviation industry. EFB systems are revolutionizing communication between crew members and ground teams, enabling real-time data exchange. These systems integrate advanced features such as maintenance tracking systems, airport diagrams display, runway analysis tools, and crew resource management. EFB hardware specifications vary, with touchscreen functionality becoming increasingly popular. Communication systems employ wireless communication protocols for seamless data exchange, ensuring operational efficiency. Flight logbook functionality and electronic checklists streamline record-keeping, while regulatory compliance standards are met through robust system security protocols and document management systems.
  • GPS navigation systems and flight planning tools are essential components, offering precise location information and optimized flight routes. Performance calculations and navigation data integration provide valuable insights for pilots, enhancing situational awareness. In-flight entertainment systems offer passengers a more enjoyable travel experience, while fuel management systems help airlines reduce costs. Display technology features, such as high-resolution screens and customizable interfaces, improve usability. EFB software applications offer weather data access, aircraft performance data, and efb maintenance procedures, ensuring pilots have all necessary information at their fingertips. Flight data monitoring and data connectivity options enable continuous performance analysis and real-time adjustments.
  • Aircraft systems monitoring and regulatory compliance are crucial aspects of EFB systems, ensuring safe and efficient operations. EFBs also integrate with flight manual access, providing pilots with essential reference materials. As the market continues to evolve, we can expect further advancements in display technology, wireless communication, and data management systems.

What are the Key Data Covered in this Commercial Aircraft Electronic Flight Bag (EFB) Systems Market Research and Growth Report?

  • What is the expected growth of the Commercial Aircraft Electronic Flight Bag (EFB) Systems Market between 2024 and 2028?

    • USD 1.11 billion, at a CAGR of 9.05%

  • What segmentation does the market report cover?

    • The report is segmented by Type (Class I/ABC, Class II/ABC, and Class III/ABC), Application (Narrow-body aircraft, Wide-body aircraft, and Regional jet), and Geography (North America, APAC, Europe, Middle East and Africa, and South America)

  • Which regions are analyzed in the report?

    • North America, APAC, Europe, Middle East and Africa, and South America

  • What are the key growth drivers and market challenges?

    • Use of advanced avionics systems for commercial aircraft, Presence of software errors and program issues in AID

  • Who are the major players in the Commercial Aircraft Electronic Flight Bag (EFB) Systems Market?

    • Airbus SE, Anuvu Operations LLC, Astronautics Corp. of America, Astronics Corp., Carlisle Companies Inc., Collins Aerospace, Deutsche Lufthansa AG, Honeywell International Inc., L3Harris Technologies Inc., Teledyne Technologies Inc., Thales Group, Viasat Inc., Apprimus Informatik GmbH, CMC Electronics Inc., DextraData GmbH, International Flight Support, and Keyzo IT Solutions Ltd.

Market Research Insights

  • The market continues to evolve, driven by the increasing demand for enhanced flight deck technology. Two significant trends shaping this market are the focus on system reliability metrics and data management strategies. According to industry estimates, the number of EFB installations is projected to reach over 20,000 by 2025, up from approximately 12,000 in 2020. This growth underscores the importance of robust EFB security features, software updates management, and data synchronization. Furthermore, EFB training programs, system performance optimization, and pilot training simulations are essential for ensuring seamless integration and effective utilization of these advanced systems.
  • As the market matures, regulatory compliance audits, system upgrade, and data backup protocols become increasingly critical for maintaining operational efficiency and safety. With the growing emphasis on reduced fuel consumption, data redundancy strategies, network security protocols, user feedback analysis, and enhanced safety features, the EFB market is poised for continued innovation and expansion.

We can help! Our analysts can customize this commercial aircraft electronic flight bag (efb) systems market research report to meet your requirements.

Get in touch

1 Executive Summary

  • 1.1 Market overview
    • Exhibit 01: Executive Summary – Chart on Market Overview
    • Exhibit 02: Executive Summary – Data Table on Market Overview
    • Exhibit 03: Executive Summary – Chart on Global Market Characteristics
    • Exhibit 04: Executive Summary – Chart on Market by Geography
    • Exhibit 05: Executive Summary – Chart on Market Segmentation by Type
    • Exhibit 06: Executive Summary – Chart on Market Segmentation by Application
    • Exhibit 07: Executive Summary – Chart on Incremental Growth
    • Exhibit 08: Executive Summary – Data Table on Incremental Growth
    • Exhibit 09: Executive Summary – Chart on Vendor Market Positioning

2 Market Landscape

  • 2.1 Market ecosystem
    • Exhibit 10: Parent market
    • Exhibit 11: Market Characteristics

3 Market Sizing

  • 3.1 Market definition
    • Exhibit 12: Offerings of vendors included in the market definition
  • 3.2 Market segment analysis
    • Exhibit 13: Market segments
  • 3.3 Market size 2023
    • 3.4 Market outlook: Forecast for 2023-2028
      • Exhibit 14: Chart on Global - Market size and forecast 2023-2028 ($ million)
      • Exhibit 15: Data Table on Global - Market size and forecast 2023-2028 ($ million)
      • Exhibit 16: Chart on Global Market: Year-over-year growth 2023-2028 (%)
      • Exhibit 17: Data Table on Global Market: Year-over-year growth 2023-2028 (%)

    4 Historic Market Size

    • 4.1 Global commercial aircraft electronic flight bag systems market 2018 - 2022
      • Exhibit 18: Historic Market Size – Data Table on global commercial aircraft electronic flight bag systems market 2018 - 2022 ($ million)
    • 4.2 Type Segment Analysis 2018 - 2022
      • Exhibit 19: Historic Market Size – Type Segment 2018 - 2022 ($ million)
    • 4.3 Application Segment Analysis 2018 - 2022
      • Exhibit 20: Historic Market Size – Application Segment 2018 - 2022 ($ million)
    • 4.4 Geography Segment Analysis 2018 - 2022
      • Exhibit 21: Historic Market Size – Geography Segment 2018 - 2022 ($ million)
    • 4.5 Country Segment Analysis 2018 - 2022
      • Exhibit 22: Historic Market Size – Country Segment 2018 - 2022 ($ million)

    5 Five Forces Analysis

    • 5.1 Five forces summary
      • Exhibit 23: Five forces analysis - Comparison between 2023 and 2028
    • 5.2 Bargaining power of buyers
      • Exhibit 24: Chart on Bargaining power of buyers – Impact of key factors 2023 and 2028
    • 5.3 Bargaining power of suppliers
      • Exhibit 25: Bargaining power of suppliers – Impact of key factors in 2023 and 2028
    • 5.4 Threat of new entrants
      • Exhibit 26: Threat of new entrants – Impact of key factors in 2023 and 2028
    • 5.5 Threat of substitutes
      • Exhibit 27: Threat of substitutes – Impact of key factors in 2023 and 2028
    • 5.6 Threat of rivalry
      • Exhibit 28: Threat of rivalry – Impact of key factors in 2023 and 2028
    • 5.7 Market condition
      • Exhibit 29: Chart on Market condition - Five forces 2023 and 2028

    6 Market Segmentation by Type

    • 6.1 Market segments
      • Exhibit 30: Chart on Type - Market share 2023-2028 (%)
      • Exhibit 31: Data Table on Type - Market share 2023-2028 (%)
    • 6.2 Comparison by Type
      • Exhibit 32: Chart on Comparison by Type
      • Exhibit 33: Data Table on Comparison by Type
    • 6.3 Class I/ABC - Market size and forecast 2023-2028
      • Exhibit 34: Chart on Class I/ABC - Market size and forecast 2023-2028 ($ million)
      • Exhibit 35: Data Table on Class I/ABC - Market size and forecast 2023-2028 ($ million)
      • Exhibit 36: Chart on Class I/ABC - Year-over-year growth 2023-2028 (%)
      • Exhibit 37: Data Table on Class I/ABC - Year-over-year growth 2023-2028 (%)
    • 6.4 Class II/ABC - Market size and forecast 2023-2028
      • Exhibit 38: Chart on Class II/ABC - Market size and forecast 2023-2028 ($ million)
      • Exhibit 39: Data Table on Class II/ABC - Market size and forecast 2023-2028 ($ million)
      • Exhibit 40: Chart on Class II/ABC - Year-over-year growth 2023-2028 (%)
      • Exhibit 41: Data Table on Class II/ABC - Year-over-year growth 2023-2028 (%)
    • 6.5 Class III/ABC - Market size and forecast 2023-2028
      • Exhibit 42: Chart on Class III/ABC - Market size and forecast 2023-2028 ($ million)
      • Exhibit 43: Data Table on Class III/ABC - Market size and forecast 2023-2028 ($ million)
      • Exhibit 44: Chart on Class III/ABC - Year-over-year growth 2023-2028 (%)
      • Exhibit 45: Data Table on Class III/ABC - Year-over-year growth 2023-2028 (%)
    • 6.6 Market opportunity by Type
      • Exhibit 46: Market opportunity by Type ($ million)
      • Exhibit 47: Data Table on Market opportunity by Type ($ million)

    7 Market Segmentation by Application

    • 7.1 Market segments
      • Exhibit 48: Chart on Application - Market share 2023-2028 (%)
      • Exhibit 49: Data Table on Application - Market share 2023-2028 (%)
    • 7.2 Comparison by Application
      • Exhibit 50: Chart on Comparison by Application
      • Exhibit 51: Data Table on Comparison by Application
    • 7.3 Narrow-body aircraft - Market size and forecast 2023-2028
      • Exhibit 52: Chart on Narrow-body aircraft - Market size and forecast 2023-2028 ($ million)
      • Exhibit 53: Data Table on Narrow-body aircraft - Market size and forecast 2023-2028 ($ million)
      • Exhibit 54: Chart on Narrow-body aircraft - Year-over-year growth 2023-2028 (%)
      • Exhibit 55: Data Table on Narrow-body aircraft - Year-over-year growth 2023-2028 (%)
    • 7.4 Wide-body aircraft - Market size and forecast 2023-2028
      • Exhibit 56: Chart on Wide-body aircraft - Market size and forecast 2023-2028 ($ million)
      • Exhibit 57: Data Table on Wide-body aircraft - Market size and forecast 2023-2028 ($ million)
      • Exhibit 58: Chart on Wide-body aircraft - Year-over-year growth 2023-2028 (%)
      • Exhibit 59: Data Table on Wide-body aircraft - Year-over-year growth 2023-2028 (%)
    • 7.5 Regional jet - Market size and forecast 2023-2028
      • Exhibit 60: Chart on Regional jet - Market size and forecast 2023-2028 ($ million)
      • Exhibit 61: Data Table on Regional jet - Market size and forecast 2023-2028 ($ million)
      • Exhibit 62: Chart on Regional jet - Year-over-year growth 2023-2028 (%)
      • Exhibit 63: Data Table on Regional jet - Year-over-year growth 2023-2028 (%)
    • 7.6 Market opportunity by Application
      • Exhibit 64: Market opportunity by Application ($ million)
      • Exhibit 65: Data Table on Market opportunity by Application ($ million)

    8 Customer Landscape

    • 8.1 Customer landscape overview
      • Exhibit 66: Analysis of price sensitivity, lifecycle, customer purchase basket, adoption rates, and purchase criteria

    9 Geographic Landscape

    • 9.1 Geographic segmentation
      • Exhibit 67: Chart on Market share by geography 2023-2028 (%)
      • Exhibit 68: Data Table on Market share by geography 2023-2028 (%)
    • 9.2 Geographic comparison
      • Exhibit 69: Chart on Geographic comparison
      • Exhibit 70: Data Table on Geographic comparison
    • 9.3 North America - Market size and forecast 2023-2028
      • Exhibit 71: Chart on North America - Market size and forecast 2023-2028 ($ million)
      • Exhibit 72: Data Table on North America - Market size and forecast 2023-2028 ($ million)
      • Exhibit 73: Chart on North America - Year-over-year growth 2023-2028 (%)
      • Exhibit 74: Data Table on North America - Year-over-year growth 2023-2028 (%)
    • 9.4 APAC - Market size and forecast 2023-2028
      • Exhibit 75: Chart on APAC - Market size and forecast 2023-2028 ($ million)
      • Exhibit 76: Data Table on APAC - Market size and forecast 2023-2028 ($ million)
      • Exhibit 77: Chart on APAC - Year-over-year growth 2023-2028 (%)
      • Exhibit 78: Data Table on APAC - Year-over-year growth 2023-2028 (%)
    • 9.5 Europe - Market size and forecast 2023-2028
      • Exhibit 79: Chart on Europe - Market size and forecast 2023-2028 ($ million)
      • Exhibit 80: Data Table on Europe - Market size and forecast 2023-2028 ($ million)
      • Exhibit 81: Chart on Europe - Year-over-year growth 2023-2028 (%)
      • Exhibit 82: Data Table on Europe - Year-over-year growth 2023-2028 (%)
    • 9.6 Middle East and Africa - Market size and forecast 2023-2028
      • Exhibit 83: Chart on Middle East and Africa - Market size and forecast 2023-2028 ($ million)
      • Exhibit 84: Data Table on Middle East and Africa - Market size and forecast 2023-2028 ($ million)
      • Exhibit 85: Chart on Middle East and Africa - Year-over-year growth 2023-2028 (%)
      • Exhibit 86: Data Table on Middle East and Africa - Year-over-year growth 2023-2028 (%)
    • 9.7 South America - Market size and forecast 2023-2028
      • Exhibit 87: Chart on South America - Market size and forecast 2023-2028 ($ million)
      • Exhibit 88: Data Table on South America - Market size and forecast 2023-2028 ($ million)
      • Exhibit 89: Chart on South America - Year-over-year growth 2023-2028 (%)
      • Exhibit 90: Data Table on South America - Year-over-year growth 2023-2028 (%)
    • 9.8 US - Market size and forecast 2023-2028
      • Exhibit 91: Chart on US - Market size and forecast 2023-2028 ($ million)
      • Exhibit 92: Data Table on US - Market size and forecast 2023-2028 ($ million)
      • Exhibit 93: Chart on US - Year-over-year growth 2023-2028 (%)
      • Exhibit 94: Data Table on US - Year-over-year growth 2023-2028 (%)
    • 9.9 China - Market size and forecast 2023-2028
      • Exhibit 95: Chart on China - Market size and forecast 2023-2028 ($ million)
      • Exhibit 96: Data Table on China - Market size and forecast 2023-2028 ($ million)
      • Exhibit 97: Chart on China - Year-over-year growth 2023-2028 (%)
      • Exhibit 98: Data Table on China - Year-over-year growth 2023-2028 (%)
    • 9.10 Germany - Market size and forecast 2023-2028
      • Exhibit 99: Chart on Germany - Market size and forecast 2023-2028 ($ million)
      • Exhibit 100: Data Table on Germany - Market size and forecast 2023-2028 ($ million)
      • Exhibit 101: Chart on Germany - Year-over-year growth 2023-2028 (%)
      • Exhibit 102: Data Table on Germany - Year-over-year growth 2023-2028 (%)
    • 9.11 France - Market size and forecast 2023-2028
      • Exhibit 103: Chart on France - Market size and forecast 2023-2028 ($ million)
      • Exhibit 104: Data Table on France - Market size and forecast 2023-2028 ($ million)
      • Exhibit 105: Chart on France - Year-over-year growth 2023-2028 (%)
      • Exhibit 106: Data Table on France - Year-over-year growth 2023-2028 (%)
    • 9.12 India - Market size and forecast 2023-2028
      • Exhibit 107: Chart on India - Market size and forecast 2023-2028 ($ million)
      • Exhibit 108: Data Table on India - Market size and forecast 2023-2028 ($ million)
      • Exhibit 109: Chart on India - Year-over-year growth 2023-2028 (%)
      • Exhibit 110: Data Table on India - Year-over-year growth 2023-2028 (%)
    • 9.13 Market opportunity by geography
      • Exhibit 111: Market opportunity by geography ($ million)
      • Exhibit 112: Data Tables on Market opportunity by geography ($ million)

    10 Drivers, Challenges, and Trends

    • 10.1 Market drivers
      • 10.2 Market challenges
        • 10.3 Impact of drivers and challenges
          • Exhibit 113: Impact of drivers and challenges in 2023 and 2028
        • 10.4 Market trends

          11 Vendor Landscape

          • 11.1 Overview
            • 11.2 Vendor landscape
              • Exhibit 114: Overview on Criticality of inputs and Factors of differentiation
            • 11.3 Landscape disruption
              • Exhibit 115: Overview on factors of disruption
            • 11.4 Industry risks
              • Exhibit 116: Impact of key risks on business

            12 Vendor Analysis

            • 12.1 Vendors covered
              • Exhibit 117: Vendors covered
            • 12.2 Market positioning of vendors
              • Exhibit 118: Matrix on vendor position and classification
            • 12.3 Airbus SE
              • Exhibit 119: Airbus SE - Overview
              • Exhibit 120: Airbus SE - Business segments
              • Exhibit 121: Airbus SE - Key news
              • Exhibit 122: Airbus SE - Key offerings
              • Exhibit 123: Airbus SE - Segment focus
            • 12.4 Anuvu Operations LLC
              • Exhibit 124: Anuvu Operations LLC - Overview
              • Exhibit 125: Anuvu Operations LLC - Product / Service
              • Exhibit 126: Anuvu Operations LLC - Key offerings
            • 12.5 Apprimus Informatik GmbH
              • Exhibit 127: Apprimus Informatik GmbH - Overview
              • Exhibit 128: Apprimus Informatik GmbH - Product / Service
              • Exhibit 129: Apprimus Informatik GmbH - Key offerings
            • 12.6 Astronics Corp.
              • Exhibit 130: Astronics Corp. - Overview
              • Exhibit 131: Astronics Corp. - Business segments
              • Exhibit 132: Astronics Corp. - Key offerings
              • Exhibit 133: Astronics Corp. - Segment focus
            • 12.7 CMC Electronics Inc.
              • Exhibit 134: CMC Electronics Inc. - Overview
              • Exhibit 135: CMC Electronics Inc. - Product / Service
              • Exhibit 136: CMC Electronics Inc. - Key offerings
            • 12.8 Collins Aerospace
              • Exhibit 137: Collins Aerospace - Overview
              • Exhibit 138: Collins Aerospace - Product / Service
              • Exhibit 139: Collins Aerospace - Key offerings
            • 12.9 Deutsche Lufthansa AG
              • Exhibit 140: Deutsche Lufthansa AG - Overview
              • Exhibit 141: Deutsche Lufthansa AG - Business segments
              • Exhibit 142: Deutsche Lufthansa AG - Key offerings
              • Exhibit 143: Deutsche Lufthansa AG - Segment focus
            • 12.10 DextraData GmbH
              • Exhibit 144: DextraData GmbH - Overview
              • Exhibit 145: DextraData GmbH - Product / Service
              • Exhibit 146: DextraData GmbH - Key offerings
            • 12.11 Honeywell International Inc.
              • Exhibit 147: Honeywell International Inc. - Overview
              • Exhibit 148: Honeywell International Inc. - Business segments
              • Exhibit 149: Honeywell International Inc. - Key news
              • Exhibit 150: Honeywell International Inc. - Key offerings
              • Exhibit 151: Honeywell International Inc. - Segment focus
            • 12.12 International Flight Support
              • Exhibit 152: International Flight Support - Overview
              • Exhibit 153: International Flight Support - Product / Service
              • Exhibit 154: International Flight Support - Key offerings
            • 12.13 Keyzo IT Solutions Ltd.
              • Exhibit 155: Keyzo IT Solutions Ltd. - Overview
              • Exhibit 156: Keyzo IT Solutions Ltd. - Product / Service
              • Exhibit 157: Keyzo IT Solutions Ltd. - Key offerings
            • 12.14 L3Harris Technologies Inc.
              • Exhibit 158: L3Harris Technologies Inc. - Overview
              • Exhibit 159: L3Harris Technologies Inc. - Business segments
              • Exhibit 160: L3Harris Technologies Inc. - Key news
              • Exhibit 161: L3Harris Technologies Inc. - Key offerings
              • Exhibit 162: L3Harris Technologies Inc. - Segment focus
            • 12.15 Teledyne Technologies Inc.
              • Exhibit 163: Teledyne Technologies Inc. - Overview
              • Exhibit 164: Teledyne Technologies Inc. - Business segments
              • Exhibit 165: Teledyne Technologies Inc. - Key news
              • Exhibit 166: Teledyne Technologies Inc. - Key offerings
              • Exhibit 167: Teledyne Technologies Inc. - Segment focus
            • 12.16 Thales Group
              • Exhibit 168: Thales Group - Overview
              • Exhibit 169: Thales Group - Business segments
              • Exhibit 170: Thales Group - Key news
              • Exhibit 171: Thales Group - Key offerings
              • Exhibit 172: Thales Group - Segment focus
            • 12.17 Viasat Inc.
              • Exhibit 173: Viasat Inc. - Overview
              • Exhibit 174: Viasat Inc. - Business segments
              • Exhibit 175: Viasat Inc. - Key news
              • Exhibit 176: Viasat Inc. - Key offerings
              • Exhibit 177: Viasat Inc. - Segment focus

            13 Appendix

            • 13.1 Scope of the report
              • 13.2 Inclusions and exclusions checklist
                • Exhibit 178: Inclusions checklist
                • Exhibit 179: Exclusions checklist
              • 13.3 Currency conversion rates for US$
                • Exhibit 180: Currency conversion rates for US$
              • 13.4 Research methodology
                • Exhibit 181: Research methodology
                • Exhibit 182: Validation techniques employed for market sizing
                • Exhibit 183: Information sources
              • 13.5 List of abbreviations
                • Exhibit 184: List of abbreviations

              Research Methodology

              Technavio presents a detailed picture of the market by way of study, synthesis, and summation of data from multiple sources. The analysts have presented the various facets of the market with a particular focus on identifying the key industry influencers. The data thus presented is comprehensive, reliable, and the result of extensive research, both primary and secondary.

              INFORMATION SOURCES

              Primary sources

              • Manufacturers and suppliers
              • Channel partners
              • Industry experts
              • Strategic decision makers

              Secondary sources

              • Industry journals and periodicals
              • Government data
              • Financial reports of key industry players
              • Historical data
              • Press releases

              DATA ANALYSIS

              Data Synthesis

              • Collation of data
              • Estimation of key figures
              • Analysis of derived insights

              Data Validation

              • Triangulation with data models
              • Reference against proprietary databases
              • Corroboration with industry experts

              REPORT WRITING

              Qualitative

              • Market drivers
              • Market challenges
              • Market trends
              • Five forces analysis

              Quantitative

              • Market size and forecast
              • Market segmentation
              • Geographical insights
              • Competitive landscape

              Interested in this report?

              Get your sample now to see our research methodology and insights!

              Download Now

              Frequently Asked Questions

              Commercial Aircraft Electronic Flight Bag (EFB) Systems market growth will increase by $ 1110.02 mn during 2024-2028.

              The Commercial Aircraft Electronic Flight Bag (EFB) Systems market is expected to grow at a CAGR of 9.05% during 2024-2028.

              Commercial Aircraft Electronic Flight Bag (EFB) Systems market is segmented by Type( Class I/ABC, Class II/ABC, Class III/ABC, MEA, South America) Application( Narrow-body aircraft, Wide-body aircraft, Regional jet, MEA, South America)

              Airbus SE, Anuvu Operations LLC, Astronautics Corp. of America, Astronics Corp., Carlisle Companies Inc., Collins Aerospace, Deutsche Lufthansa AG, Honeywell International Inc., L3Harris Technologies Inc., Teledyne Technologies Inc., Thales Group, Viasat Inc., Apprimus Informatik GmbH, CMC Electronics Inc., DextraData GmbH, International Flight Support, Keyzo IT Solutions Ltd. are a few of the key vendors in the Commercial Aircraft Electronic Flight Bag (EFB) Systems market.

              North America will register the highest growth rate of 32% among the other regions. Therefore, the Commercial Aircraft Electronic Flight Bag (EFB) Systems market in North America is expected to garner significant business opportunities for the vendors during the forecast period.

              US, China, India, Germany, France

              • Use of advanced avionics systems for commercial aircraftThe aviation industry is regulated by agencies such as the European Union Aviation Safety Agency (EASA) is the driving factor this market.
              • FAA is the driving factor this market.
              • and the International Civil Aviation Organization (ICAO). The primary goal of these organizations is to ensure the safety of passengers is the driving factor this market.
              • cargo is the driving factor this market.
              • and crew. Therefore is the driving factor this market.
              • the role of automation has become vital. Automation enhances flight operational safety and aircraft efficiency while decreasing operational costs. This is especially critical for commercial airlines is the driving factor this market.
              • which cater to millions of passengers. Currently is the driving factor this market.
              • many aircraft are equipped with highly efficient avionics systems such as autopilot is the driving factor this market.
              • communications is the driving factor this market.
              • navigation is the driving factor this market.
              • surveillance systems is the driving factor this market.
              • and electrical emergency systems. An autopilot system is a proven safety aid that is required when the aircraft is flying through cloudy or foggy weather is the driving factor this market.
              • during low visibility is the driving factor this market.
              • or in congested airspace. According to the FAA norms is the driving factor this market.
              • an autopilot system is mandatory when an aircraft is operated by a single pilot. The FAA encourages the development and installation of autopilots in aircraft to enhance safety. Autopilot manufacturers invest in creating new is the driving factor this market.
              • digital smart autopilots and modernized technology that can be installed in various aircraft types without the need for expensive certifications. Commercial EFB systems can aid pilots and crew members in managing their tasks in a more efficient manner and ensure aircraft safety and fuel efficiency. Such an initiative will increase the volume consumption of EFB devices is the driving factor this market.
              • thus driving the global Commercial Aircraft EFB systems market growth during the forecast period. is the driving factor this market.

              The Commercial Aircraft Electronic Flight Bag (EFB) Systems market vendors should focus on grabbing business opportunities from the Class I/ABC segment as it accounted for the largest market share in the base year.