Contact Lenses Market Size 2025-2029
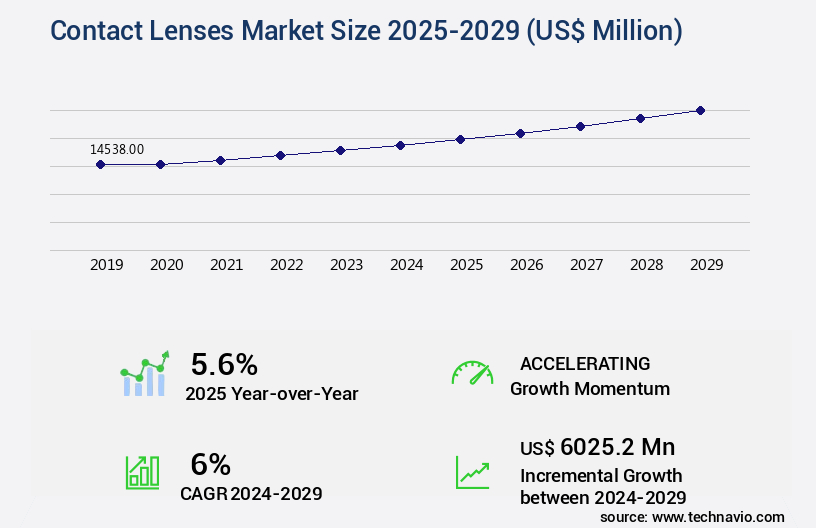
The contact lenses market size is valued to increase by USD 6.03 billion, at a CAGR of 6% from 2024 to 2029. Growing prevalence of myopia will drive the contact lenses market.
Major Market Trends & Insights
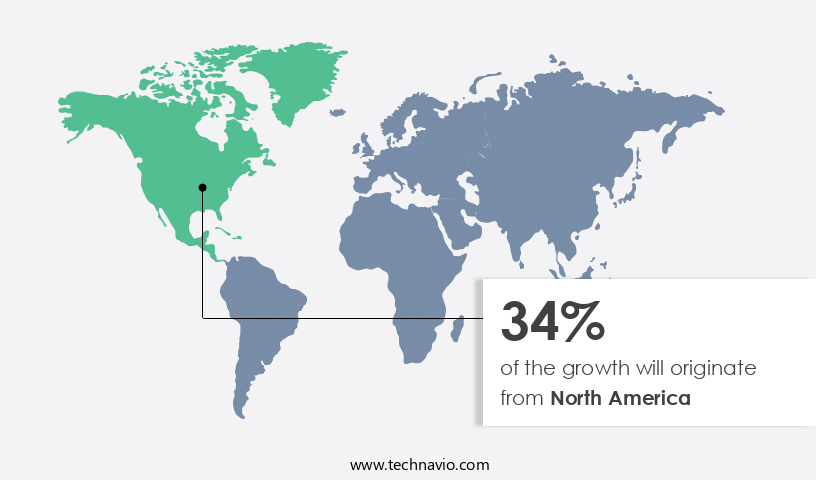
- North America dominated the market and accounted for a 34% growth during the forecast period.
- By Product - Soft lenses segment was valued at USD 7.17 billion in 2023
- By Distribution Channel - Offline segment accounted for the largest market revenue share in 2023
Market Size & Forecast
- Market Opportunities: USD 63.52 million
- Market Future Opportunities: USD 6025.20 million
- CAGR from 2024 to 2029 : 6%
Market Summary
- Contact lenses, a vital segment of the global eye care industry, experienced significant growth in recent years, driven by the increasing prevalence of myopia and the adoption of advanced technologies. According to market data, the market reached a value of USD 13.6 billion in 2020, underscoring its importance in the optical industry. Advancements in technology have transformed contact lenses from simple corrective devices to smart, multifunctional solutions. Innovations such as daily disposable lenses, toric lenses for astigmatism, and colored contact lenses have expanded their appeal to a broader consumer base. Moreover, the integration of digital technologies like sensors, wireless connectivity, and prescription scanning has enabled contact lenses to monitor eye health and provide real-time data to healthcare professionals.
- Despite these advancements, the market faces challenges, primarily due to stringent regulations. Governments and regulatory bodies worldwide enforce rigorous standards to ensure the safety and efficacy of contact lenses. These regulations necessitate extensive clinical trials, rigorous testing, and continuous monitoring, which can significantly increase the cost of production and distribution. In conclusion, the market continues to evolve, driven by the rising prevalence of myopia and the adoption of advanced technologies. Despite regulatory challenges, the market's future looks promising, with opportunities in emerging markets and continued innovation in lens technology.
What will be the Size of the Contact Lenses Market during the forecast period?
Get Key Insights on Market Forecast (PDF) Request Free Sample
How is the Contact Lenses Market Segmented ?
The contact lenses industry research report provides comprehensive data (region-wise segment analysis), with forecasts and estimates in "USD million" for the period 2025-2029, as well as historical data from 2019-2023 for the following segments.
- Product
- Soft lenses
- Rigid gas permeable lenses
- Hybrid lenses
- Distribution Channel
- Offline
- Online
- Type
- Daily wear
- Extended wear
- Traditional
- Variant
- Spherical
- Multifocal
- Cosmetic
- Monovision
- Solution
- Opaque
- Enhancers
- Visibility tinted
- Application
- Conventional
- Decorative
- Orthokeratology
- Geography
- North America
- US
- Canada
- Europe
- France
- Germany
- Italy
- The Netherlands
- UK
- APAC
- China
- India
- Japan
- Rest of World (ROW)
- North America
By Product Insights
The soft lenses segment is estimated to witness significant growth during the forecast period.
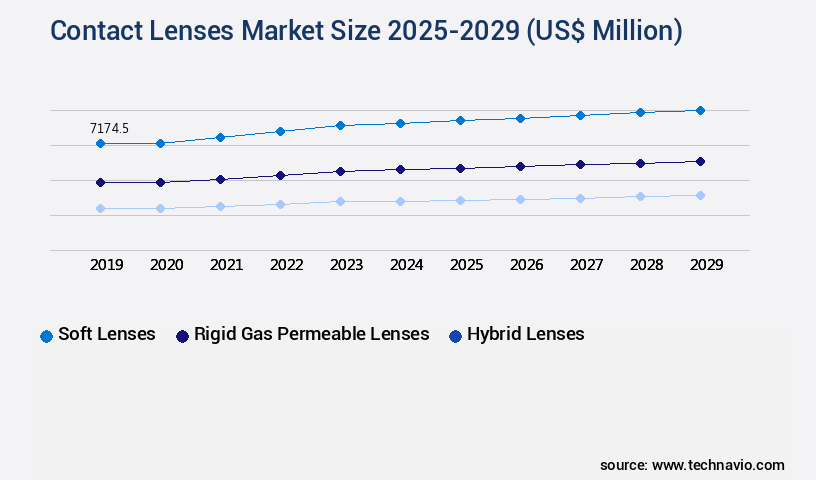
The market is characterized by the continuous evolution of various lens types, including soft and rigid gas permeable (RGP) lenses. Soft contact lenses, comprising over 80% of the global market share, are expected to grow at a faster rate than the overall market. These lenses, made from hydrogels, offer greater comfort and flexibility compared to RGP lenses. Hydrogel's water content and pliability enable better adaptation to the eye's shape and improved oxygen permeability, ensuring eye health and enhancing user experience. Key soft lens types include daily disposable, extended wear, multifocal, and toric lenses, catering to diverse vision needs.
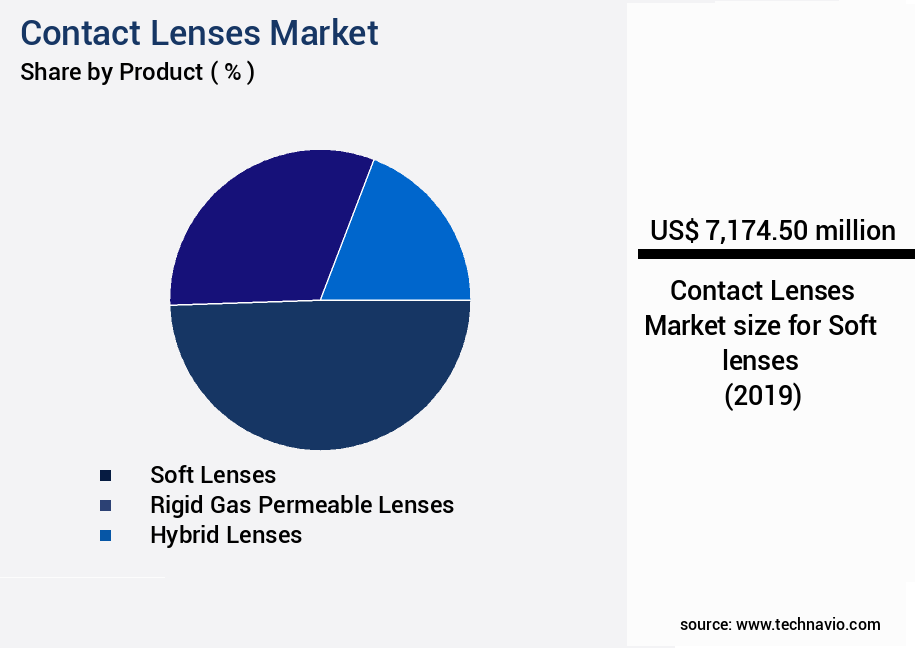
The Soft lenses segment was valued at USD 7.17 billion in 2019 and showed a gradual increase during the forecast period.
Daily disposable lenses offer the convenience of being discarded after each use, reducing the risk of lens-related infections. The market also encompasses specialized lenses, such as intraocular lenses implants, orthokeratology lenses, and scleral lenses, addressing specific eye conditions. A notable trend is the integration of advanced technology, like corneal topography mapping and UV blocking, to enhance lens performance and user experience. For instance, hydrophilic lens properties and silicone hydrogel lenses improve lens wettability and oxygen permeability, respectively. Additionally, lens power parameters, such as base curve measurements and lens dehydration effects, are crucial considerations in lens selection.
Proper lens handling instructions, care regimens, and disinfection protocols are essential to ensure lens longevity and eye health. Approximately 45 million Americans use contact lenses, underscoring the market's significant impact on vision correction.
Regional Analysis
North America is estimated to contribute 34% to the growth of the global market during the forecast period. Technavio's analysts have elaborately explained the regional trends and drivers that shape the market during the forecast period.
See How Contact Lenses Market Demand is Rising in North America Request Free Sample
Refractive errors, particularly nearsightedness (myopia) and farsightedness (hyperopia), are the most prevalent eye issues in the US, affecting approximately 194 million adult vision corrector users. The increasing usage of digital screens among teenagers and adults, driven by the expanding digital penetration, is a leading cause of vision impairment in the US. Genetic factors also play a role, with over 150 myopic-prone genes identified. This rising incidence of myopia necessitates the use of contact lenses for vision correction.
Market Dynamics
Our researchers analyzed the data with 2024 as the base year, along with the key drivers, trends, and challenges. A holistic analysis of drivers will help companies refine their marketing strategies to gain a competitive advantage.
The market is a dynamic and innovative industry, driven by advancements in lens technology and increasing consumer demand for vision correction solutions. Silicone hydrogel lenses, with their superior oxygen transmissibility, dominate the market, offering improved comfort and health for wearers. In the realm of multifocal contact lens design, intricate parameters are meticulously considered to address the complexities of presbyopia and astigmatism correction. Despite these advancements, lens fitting challenges persist, particularly in cases of astigmatism and irregular corneas. Daily disposable lenses, with their ease of use and reduced risk of complications, have emerged as a popular choice for patients, with material selection criteria prioritizing comfort and oxygen permeability.
Extended wear lenses continue to face management challenges due to potential complications, necessitating careful monitoring and follow-up care. Refractive error correction using contact lenses has proven to significantly improve visual acuity for millions worldwide. Contact lens solutions, essential for proper care and maintenance, are subjected to rigorous evaluation for effectiveness and dry eye management capabilities. UV blocking lens protection against sun damage is a crucial consideration, with increasing consumer awareness driving demand for this feature. Customized lenses, such as those for hyperopic and myopic corrections, cater to individual needs, with toric lens parameters specifically designed for astigmatic correction.
Contact lens handling instructions for patients and consistent lens care regimen compliance are vital for ensuring the longevity and effectiveness of the lenses. Intraocular lens implantation procedures, a viable alternative to contact lenses for some, necessitate careful consideration of patient factors and surgical techniques. Keratoconus management with scleral lenses and orthokeratology lens efficacy in myopia control demonstrates the versatility of contact lenses in addressing various vision correction needs. Rigid gas permeable lens fitting techniques continue to evolve, offering improved comfort and accuracy for patients. The market is a thriving industry, with innovation and consumer demand driving growth.
Adoption rates for daily disposable lenses, in comparison to traditional extended wear lenses, have seen significant increases, reflecting the industry's commitment to enhancing patient comfort and eye health.
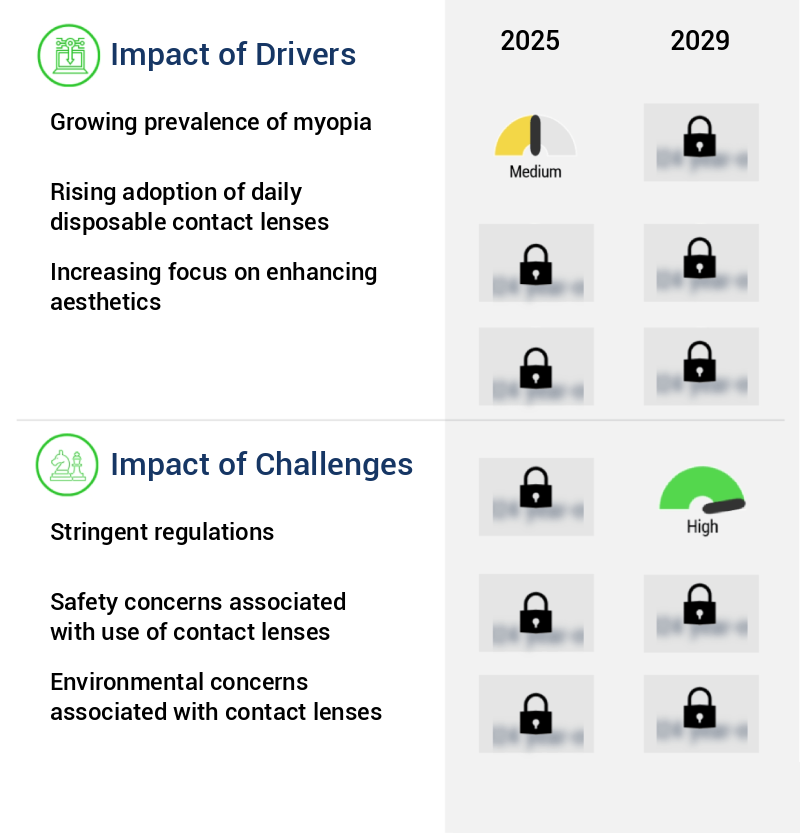
What are the key market drivers leading to the rise in the adoption of Contact Lenses Industry?
- The increasing prevalence of myopia serves as the primary market driver.
- Myopia, or nearsightedness, is a prevalent vision impairment condition affecting individuals' ability to see distant objects clearly. This condition, characterized by blurry vision of distant objects, can increase the risk of vision-threatening complications such as retinal breaks, detachment, and glaucoma. Although the exact cause of myopia remains unclear, it is often a genetic disorder or the result of prolonged eye strain from digital screens or other eye-stressing activities. Age-related macular degeneration (AMD) is another significant cause of visual impairment. The macula, a small area at the back of the eye responsible for sharp, central vision, deteriorates with age in AMD, leading to vision loss.
- While the prevalence of myopia is on the rise, particularly among children and young adults, AMD primarily affects older adults. Both conditions necessitate continuous research and advancements in treatments and preventive measures. The market for myopia management solutions is expanding, with a focus on orthokeratology lenses, multifocal contact lenses, and pharmaceutical interventions. In contrast, AMD treatments range from intravitreal injections to laser photocoagulation and photodynamic therapy. The market for vision care solutions is dynamic, with ongoing advancements and innovations. Myopia management and AMD treatments are critical areas of focus, with a growing emphasis on early intervention and prevention strategies.
- As the global population ages and the prevalence of vision impairments continues to rise, the demand for effective solutions in these areas is expected to increase significantly.
What are the market trends shaping the Contact Lenses Industry?
- The rising adoption of advanced technologies in contact lenses represents a significant market trend. This trend reflects the increasing demand for technologically superior and convenient vision solutions.
- The vision care industry is witnessing a surge in technological advancements, with numerous research and development activities underway. Innovations such as telescopic contact lenses, brightness/light controlling lenses, 3D-printed contact lenses, augmented reality contact lenses, and health and glucose monitoring lenses are poised to revolutionize the market. For instance, soft lens advancements, like the KeraSoft IC, have significantly improved the industry. This silicone hydrogel lens boasts an innovative design, offering enhanced comfort, health benefits, and superior visual acuity for individuals with keratoconus and other irregular corneas.
- These developments underscore the continuous evolution of the vision care market, providing solutions for diverse needs and applications across various sectors.
What challenges does the Contact Lenses Industry face during its growth?
- The stringent regulations pose a significant challenge to the industry's growth, requiring companies to adhere to rigorous compliance standards.
- The market is subject to numerous regulatory frameworks, with both the US Food and Drug Administration (FDA) and the Federal Trade Commission (FTC) playing significant roles. Contact lenses are classified as medical devices by the FDA, necessitating stringent regulations for their development, manufacture, distribution, and sales. In the US, the Opticians Act 1989 Order 2005 governs the sales and fitting of corrective and non-corrective contact lenses by registered medical practitioners.
- These regulatory hurdles, coupled with the complexity and cost involved, create challenges for companies looking to invest in the market. The intricate value chain system is influenced by various federal policies, shaping the development, production, distribution, and sales of contact lenses through diverse channels.
Exclusive Technavio Analysis on Customer Landscape
The contact lenses market forecasting report includes the adoption lifecycle of the market, covering from the innovator's stage to the laggard's stage. It focuses on adoption rates in different regions based on penetration. Furthermore, the contact lenses market report also includes key purchase criteria and drivers of price sensitivity to help companies evaluate and develop their market growth analysis strategies.
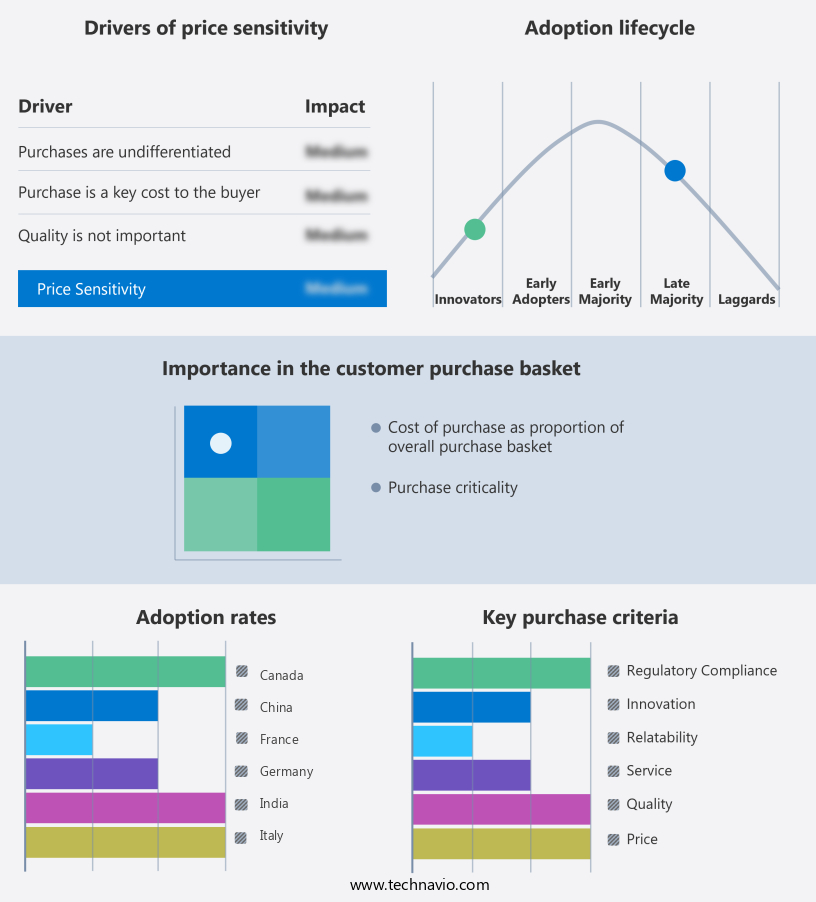
Customer Landscape of Contact Lenses Industry
Competitive Landscape
Companies are implementing various strategies, such as strategic alliances, contact lenses market forecast, partnerships, mergers and acquisitions, geographical expansion, and product/service launches, to enhance their presence in the industry.
Advanced Vision Technologies - This company specializes in providing a range of contact lenses, including Naturalens Scleral, Transbylite, and Naturasoft.
The industry research and growth report includes detailed analyses of the competitive landscape of the market and information about key companies, including:
- Advanced Vision Technologies
- Alcon Inc.
- Appenzeller Kontaktlinsen AG
- Art Optical Contact Lens Inc.
- Bausch Health Companies Inc.
- BenQ Materials Corp.
- Carl Zeiss AG
- Clearlab SG Pte Ltd.
- Contamac Ltd.
- Cooper Vision
- Essilor Contacts
- Gelflex Laboratories
- HOYA CORP.
- Johnson and Johnson Vision Care
- MARK ENNOVY PERSONALIZED CARE S.L.
- Menicon Co. Ltd.
- Metro Optics of Austin Inc.
- SEED Co. Ltd.
- STAAR Surgical Co.
- UltraVision CLPL
Qualitative and quantitative analysis of companies has been conducted to help clients understand the wider business environment as well as the strengths and weaknesses of key industry players. Data is qualitatively analyzed to categorize companies as pure play, category-focused, industry-focused, and diversified; it is quantitatively analyzed to categorize companies as dominant, leading, strong, tentative, and weak.
Recent Development and News in Contact Lenses Market
- In January 2024, CooperVision, a leading contact lens manufacturer, announced the launch of its new MiSight 1 day contact lenses, the first and only FDA-approved contact lenses for myopia control in the US (CooperVision Press Release, 2024).
- In March 2024, Alcon, a Novartis division, and Google entered into a strategic partnership to develop smart contact lenses with embedded sensors and wireless capabilities, aiming to revolutionize healthcare monitoring (Alcon Press Release, 2024).
- In April 2025, Johnson & Johnson Vision, a global leader in eye health, completed the acquisition of European contact lens manufacturer, Euclidian Group, expanding its market presence and product portfolio (Johnson & Johnson Vision Press Release, 2025).
- In May 2025, the Food and Drug Administration (FDA) approved the marketing of Menicon's new contact lens, the Prostora Toric II, designed for astigmatism correction, further broadening the company's product offerings (Menicon Press Release, 2025).
Dive into Technavio's robust research methodology, blending expert interviews, extensive data synthesis, and validated models for unparalleled Contact Lenses Market insights. See full methodology.
|
Market Scope |
|
|
Report Coverage |
Details |
|
Page number |
271 |
|
Base year |
2024 |
|
Historic period |
2019-2023 |
|
Forecast period |
2025-2029 |
|
Growth momentum & CAGR |
Accelerate at a CAGR of 6% |
|
Market growth 2025-2029 |
USD 6025.2 million |
|
Market structure |
Fragmented |
|
YoY growth 2024-2025(%) |
5.6 |
|
Key countries |
US, Canada, China, UK, Germany, Japan, India, France, Italy, and The Netherlands |
|
Competitive landscape |
Leading Companies, Market Positioning of Companies, Competitive Strategies, and Industry Risks |
Research Analyst Overview
- In the ever-evolving market, daily disposable and extended wear lenses continue to dominate, accounting for a significant market share. Daily disposable lenses, with their convenience and reduced risk of infection, have experienced notable growth, outpacing the demand for extended wear lenses due to health concerns and the preference for increased comfort and ease. Advancements in technology have led to the emergence of various lens types, including intraocular lens implants, multifocal contact lenses, and orthokeratology lenses. These innovations cater to diverse needs, such as presbyopia correction, UV protection, and keratoconus management. Corneal topography mapping and lens material properties, like hydrophilic and silicone hydrogel, have significantly impacted the market.
- Hydrophilic lenses, with their high water content, offer improved comfort and oxygen permeability, while silicone hydrogel lenses provide enhanced oxygen transmission and reduced dehydration effects. Lens power parameters and lens care regimens, including contact lens solutions and disinfection protocols, are crucial considerations for contact lens users. Proper handling instructions, cleaning methods, and fitting techniques are essential to ensure optimal visual acuity and lens longevity. Scleral lenses, with their larger diameter dimensions, offer unique benefits for those with irregular corneas, making them a valuable addition to the contact lens market. Soft lens materials and lens dehydration effects also influence consumer choices, with ongoing research focusing on improving oxygen transmission and reducing lens drying.
- UV blocking lenses have gained popularity due to their ability to protect the eyes from harmful UV rays, further expanding the market's reach. The continuous evolution of contact lens technology and the growing demand for advanced lens features ensure a vibrant and dynamic market. Approximately 45 million people worldwide wear contact lenses, underscoring their widespread adoption and significance in addressing various refractive error correction needs.
What are the Key Data Covered in this Contact Lenses Market Research and Growth Report?
-
What is the expected growth of the Contact Lenses Market between 2025 and 2029?
-
USD 6.03 billion, at a CAGR of 6%
-
-
What segmentation does the market report cover?
-
The report is segmented by Product (Soft lenses, Rigid gas permeable lenses, and Hybrid lenses), Distribution Channel (Offline and Online), Type (Daily wear, Extended wear, and Traditional), Variant (Spherical, Multifocal, Cosmetic, and Monovision), Solution (Opaque, Enhancers, and Visibility tinted), Application (Conventional, Decorative, and Orthokeratology), and Geography (North America, Europe, APAC, Middle East and Africa, and South America)
-
-
Which regions are analyzed in the report?
-
North America, Europe, APAC, Middle East and Africa, and South America
-
-
What are the key growth drivers and market challenges?
-
Growing prevalence of myopia, Stringent regulations
-
-
Who are the major players in the Contact Lenses Market?
-
Advanced Vision Technologies, Alcon Inc., Appenzeller Kontaktlinsen AG, Art Optical Contact Lens Inc., Bausch Health Companies Inc., BenQ Materials Corp., Carl Zeiss AG, Clearlab SG Pte Ltd., Contamac Ltd., Cooper Vision, Essilor Contacts, Gelflex Laboratories, HOYA CORP., Johnson and Johnson Vision Care, MARK ENNOVY PERSONALIZED CARE S.L., Menicon Co. Ltd., Metro Optics of Austin Inc., SEED Co. Ltd., STAAR Surgical Co., and UltraVision CLPL
-
Market Research Insights
- The market encompasses a diverse range of products and technologies, with a focus on enhancing optical clarity, ensuring biocompatibility, and addressing discomfort factors. According to industry estimates, the global contact lens market was valued at USD 11.2 billion in 2020. This growth is driven by advancements in lens material, such as silicone hydrogel, which offers improved tear film stability and oxygen permeability. In contrast, traditional hydrogel lenses, which accounted for 35% of the market share in 2020, face increasing competition due to their higher risk of complications, including infectious keratitis and giant papillary conjunctivitis.
- To mitigate these risks, manufacturers invest in research and development to improve lens replacement schedules, prevent allergic reactions, and manage lens deposition and protein buildup. For instance, advancements in lens durability testing and corneal edema reduction have led to extended wear options, enhancing patient compliance and convenience. Furthermore, the development of advanced fitting sets and handling techniques aims to optimize ocular surface health and minimize discomfort. Overall, the market continues to evolve, with a focus on enhancing visual performance metrics and addressing patient needs for comfort and convenience.
We can help! Our analysts can customize this contact lenses market research report to meet your requirements.
 RIA -
RIA - 
