
Digital Oilfield Market Size 2025-2029
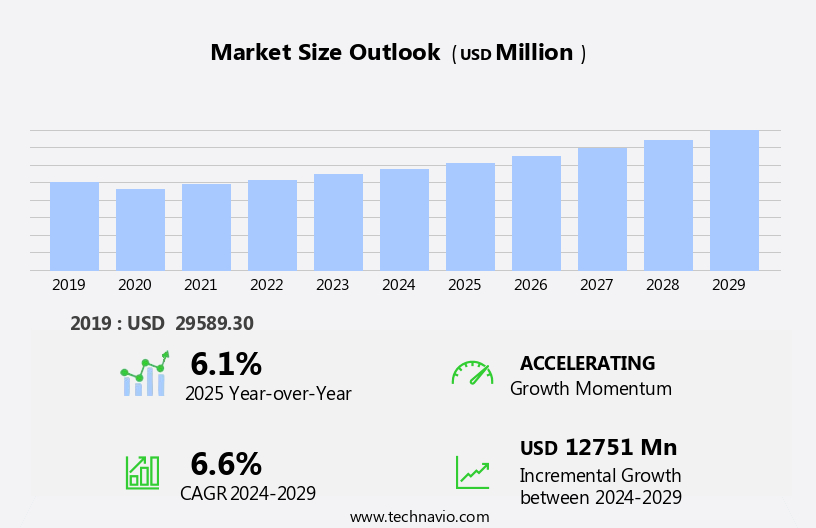
The digital oilfield market size is forecast to increase by USD 12.75 billion at a CAGR of 6.6% between 2024 and 2029.
- The market is experiencing significant growth due to the integration of advanced technologies such as Internet of Things (IoT) and sensor technology. These innovations enable real-time tracking and monitoring of oilfield operations, leading to increased efficiency and productivity. Geospatial data and 3D visualizing techniques are also being utilized to optimize drilling processes and enhance predictive analysis capabilities. The initial investment required for digitalizing oilfields can be substantial, but the long-term benefits, including cost savings and improved safety, make it a worthwhile investment for companies In the oil and gas industry. The adoption of these technologies is a key trend driving market growth, as the industry continues to seek ways to enhance operational performance and remain competitive.
What will be the Size of the Digital Oilfield Market During the Forecast Period?
- The market encompasses the application of advanced technologies, including hardware and software solutions, to optimize petroleum production and enhance safety management in both onshore and offshore reservoir production. Key components of this market include IoT sensors, geospatial data, and 3D visualizing techniques for exploration, drilling, and production cycles. Hardware solutions, such as wireless sensors and supervisory control systems, enable real-time data collection and analysis, while software applications employ predictive analysis and advance analytics to optimize product optimization and wellbores.
- Digital oilfield technologies also facilitate cost-effective management of surface facilities and subsurface geology through intelligent data filtering and cutting-edge technology. These innovations contribute to the overall growth and efficiency of the petroleum industry, improving safety, reducing operational costs, and increasing production yields.
How is this Digital Oilfield Industry segmented and which is the largest segment?
The digital oilfield industry research report provides comprehensive data (region-wise segment analysis), with forecasts and estimates in "USD billion" for the period 2025-2029, as well as historical data from 2019-2023 for the following segments.
- Solution
- Hardware
- Software
- Service
- Application
- Onshore
- Offshore
- Service
- Drilling optimization
- Production optimization
- Safety management
- Reservoir optimization
- Geography
- North America
- Canada
- US
- Middle East and Africa
- South Africa
- Europe
- UK
- Norway
- APAC
- China
- South America
- Brazil
- North America
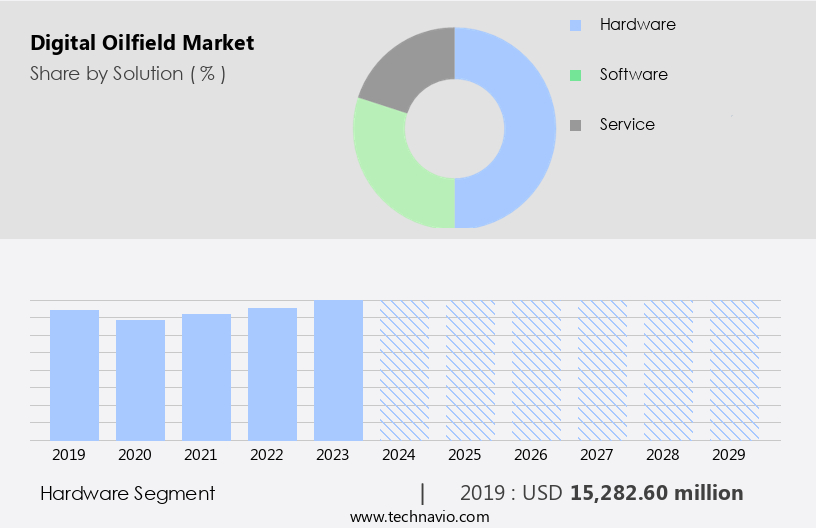
By Solution Insights
- The hardware segment is estimated to witness significant growth during the forecast period. Digital oilfield systems incorporate advanced hardware components, including wireless connectivity systems, temperature and gas leak sensors, pressure gauges, and data management hardware. These expensive and complex components are installed in challenging field conditions, but the increase in expertise mitigates the challenges. A significant portion of the hardware is equipped with sensors that monitor equipment functionality, generate data, and transmit it in real-time via wired or wireless networks. Sensors consist of a transducer, microcomputer, transceiver, and power source. Digital oilfield techniques enhance operational efficiency, reduce non-productive time, and improve safety through intelligent decisions based on real-time data analysis. Hardware solutions include distributed control systems, smart wells, safety systems, and programmable logic controllers.
Get a glance at the market report of share of various segments Request Free Sample
The hardware segment was valued at USD 15.28 billion in 2019 and showed a gradual increase during the forecast period.
Regional Analysis
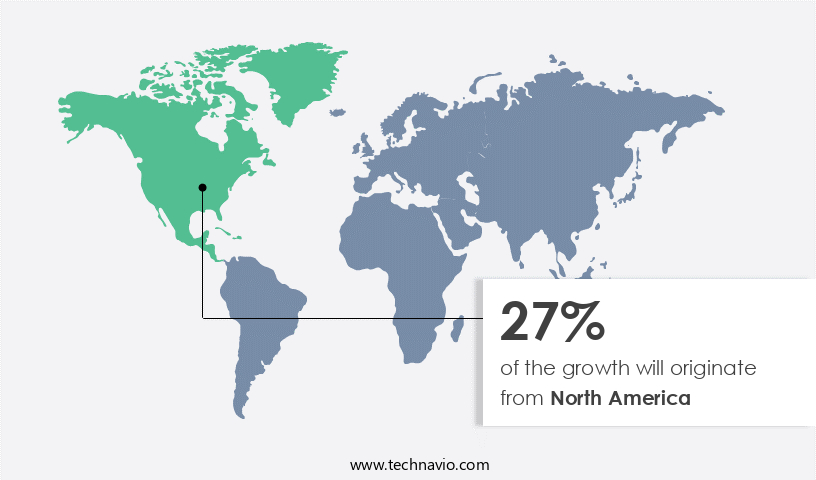
- North America is estimated to contribute 27% to the growth of the global market during the forecast period. Technavio's analysts have elaborately explained the regional trends and drivers that shape the market during the forecast period. The market in North America is primarily driven by the significant oil production In the US and Canada, making these countries the major revenue contributors. The US, with its shale revolution, has witnessed a substantial impact on its oil industry, enabling oil companies to sustain profitability despite low oil prices. This revolution led to the commercialization of hydraulic fracturing technology, attracting numerous small and independent energy players, resulting in an increase in drilling activities.
For more insights on the market size of various regions, Request Free Sample
Digitalization plays a crucial role in optimizing production and exploration In the oil and gas sector. Technologies such as IoT, Advance Analytics, Robotics, Cloud Computing, Mobility, and Predictive Analysis are transforming the industry by enabling real-time monitoring, automation, and intelligent decision-making.
Market Dynamics
Our researchers analyzed the data with 2024 as the base year, along with the key drivers, trends, and challenges. A holistic analysis of drivers will help companies refine their marketing strategies to gain a competitive advantage.
What are the key market drivers leading to the rise In the adoption of Digital Oilfield Industry?
- Enhancing efficiency of oilfields through remote monitoring and controlling is the key driver of the market. The market encompasses the implementation of advanced technologies, such as IoT, cloud computing, mobility, automation, and analytics, to optimize petroleum production and exploration. Digital intelligence plays a pivotal role in enabling intelligent decisions, problem-solving, and teamwork In the oilfield market. This includes the use of advanced analytical and statistical tools for reservoir optimization, production planning, and exploration. Hardware solutions, such as wireless sensors and distributed control systems, enable real-time data acquisition and supervisory control. Software systems, including predictive analysis and automation solutions, facilitate data management and processing. These technologies contribute to cost-effective and environmentally sustainable oil extraction, reducing non-productive time and minimizing human intervention.
- Safety management is a critical component of the market, with safety systems and programmable logic controllers ensuring operational risk mitigation. Digitalization of oil and gas operations enhances the ability to monitor and respond to risks in real-time, reducing the likelihood of accidents and minimizing their impact. The market encompasses both onshore and offshore markets, with applications ranging from deep water exploration to surface facilities and seabed installations. The integration of digital technologies in oilfield operations leads to improved productivity, reduced costs, and enhanced environmental protection. Big data management and advanced data analysis are essential components of the market, enabling real-time monitoring, predictive analysis, and intelligent filtering of data.
What are the market trends shaping the Digital Oilfield Industry?
- Integration of IoT and sensor technology for real-time tracking of operations is the upcoming market trend. The market is significantly influenced by IoT and sensor technology, driving the digital transformation In the oil and gas industry. IoT devices and sensors are integrated into various oilfield operations, including drilling rigs and production facilities. Real-time data collected on parameters such as temperature, pressure, flow rates, equipment health, and environmental conditions enable proactive decision-making and swift responses to anomalies. Predictive maintenance strategies are implemented through continuous monitoring of equipment and machinery conditions using IoT-enabled sensors. Data analysis mobility and big data analytics are essential for optimizing production, exploration, and supply chain processes. Cloud computing, mobility, and automation solutions contribute to cost-effectiveness and environmental protection, reducing non-productive time and human intervention.
- Advanced data analysis software systems facilitate intelligent decisions, minimizing operational risks related to safety and oil recovery. Innovations in technology-based solutions, such as distributed control systems, automated solutions, and smart wells, enhance workflows and predictive analysis capabilities. Intelligently filtered data from 3D visualizing techniques and geospatial data aid in subsurface geology and hydrocarbon resources. Digitalization in oil and gas operations encompasses exploration, real-time monitoring, and end-use applications, fostering productivity and profitability In the industry.
What challenges does the Digital Oilfield Industry face during its growth?
- Significant initial investment in digitalizing oilfields is a key challenge affecting the industry growth. The market encompasses the integration of advanced technologies, data sources, and communication systems to optimize petroleum production and exploration. Digitalization offers substantial benefits, including improved reservoir production, problem solving, teamwork, and operational risk management. However, high implementation costs pose a significant challenge. These costs encompass hardware, software, data storage, and communication infrastructure expenses, as well as the hiring of skilled personnel. For smaller operators, these expenses can be prohibitive, potentially hindering industry-wide adoption and limiting the realization of digital oilfield technologies' potential benefits. High implementation costs can also divert resources from other operational or strategic initiatives, making it challenging for companies to allocate resources effectively.
- Cost-effective technology-based solutions, such as cloud computing, mobility, IoT, and big data analytics, can help mitigate these costs and improve the profitability of digital oilfield projects. Additionally, automation, distributed control systems, and predictive analysis can enhance productivity, reduce non-productive time, and improve safety. Ultimately, digital oilfield techniques offer significant potential for increasing hydrocarbon resources' productivity, optimizing production cycles, and protecting the environment, making the investment worthwhile for oil and gas producers.
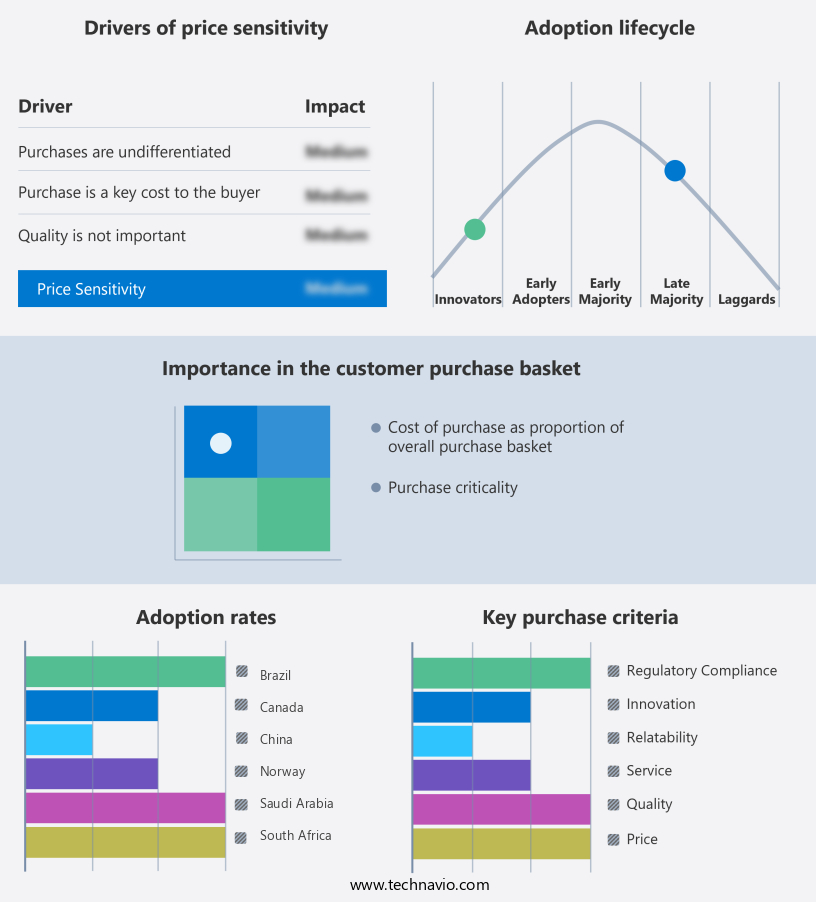
Exclusive Customer Landscape
The digital oilfield market forecasting report includes the adoption lifecycle of the market, covering from the innovator's stage to the laggard's stage. It focuses on adoption rates in different regions based on penetration. Furthermore, the digital oilfield market report also includes key purchase criteria and drivers of price sensitivity to help companies evaluate and develop their market growth analysis strategies.
Customer Landscape
Key Companies & Market Insights
Companies are implementing various strategies, such as strategic alliances, digital oilfield market forecast, partnerships, mergers and acquisitions, geographical expansion, and product/service launches, to enhance their presence In the industry.
ABB Ltd. - The company offers digital oilfield solution such as ABB Ability solutions that combine ABBs deep domain expertise with connectivity and software innovation to empower real-time, data-driven decisions for safer, smarter operations that maximize resource efficiency and contribute to a low-carbon future.
The industry research and growth report includes detailed analyses of the competitive landscape of the market and information about key companies, including:
- Aviat Networks Inc.
- Cisco Systems Inc.
- Cognizant Technology Solutions Corp.
- Detechtion Technologies
- Emerson Electric Co.
- GE Vernova Inc.
- Halliburton Co.
- Hitachi Ltd.
- Honeywell International Inc.
- Infosys Ltd.
- Kongsberg Gruppen ASA
- MicroSeismic Inc.
- Moxa Inc.
- Pason Systems Inc.
- Petrolink International Ltd.
- Schlumberger Ltd.
- Sensia LLC
- Siemens AG
- Weatherford International Plc
Qualitative and quantitative analysis of companies has been conducted to help clients understand the wider business environment as well as the strengths and weaknesses of key industry players. Data is qualitatively analyzed to categorize companies as pure play, category-focused, industry-focused, and diversified; it is quantitatively analyzed to categorize companies as dominant, leading, strong, tentative, and weak.
Research Analyst Overview
The market encompasses the application of advanced technologies and techniques to optimize the production of petroleum resources. This sector focuses on enhancing reservoir production, ensuring safety management, and improving operational efficiency in both onshore and offshore oil fields. Digital oilfield techniques encompass various aspects of hardware and software solutions, data storage, and mobility. Hardware solutions include wireless sensors and distributed control systems, while software systems incorporate advanced analytics, automation, and data management. These technologies enable real-time monitoring, predictive analysis, and intelligent decision-making. The integration of IoT, robotics, cloud computing, and other digital intelligence solutions plays a significant role In the market.
In addition, these technologies facilitate data collection, analysis, and mobility, allowing field operators, engineers, and producers to access critical information from anywhere, at any time. The oilfield market benefits from the application of digital oilfield techniques in several ways. Production optimization is a primary focus, with advanced analytical and statistical tools used to optimize reservoir productivity and hydrocarbon resources extraction. These techniques also aid in problem-solving, teamwork, and planning, reducing non-productive time and human intervention. Safety is another critical aspect of the market. Digital solutions enable real-time monitoring and predictive analysis, allowing for quick identification and resolution of safety issues.
Additionally, safety systems, such as programmable logic controllers and distributed control systems, ensure operational risk is minimized. Cost-effectiveness and environmental protection are essential considerations In the market. Advanced data analysis and automation help reduce wastage of resources, while distributed control systems and smart wells contribute to environmental protection by minimizing emissions and reducing the need for manual intervention. Innovations in digital oilfield technologies continue to shape the market, with advancements in wireless technology, big data analytics, and subsurface geology. These technologies enable more efficient exploration and production cycles, as well as the integration of renewable energy sources, such as offshore wind, into oilfield operations.
Furthermore, the market faces various challenges, including the need for big data management, cybersecurity, and the integration of distributed control systems and automated solutions. However, the benefits of digitalization In the oil and gas industry far outweigh these challenges, making it a vital sector for innovation and growth. This market encompasses various aspects of hardware and software solutions, data storage, and mobility, enabling real-time monitoring, predictive analysis, and intelligent decision-making. The integration of digital oilfield techniques contributes to improved safety, cost-effectiveness, and environmental protection, making it a crucial area for innovation and growth In the oil and gas industry.
|
Market Scope |
|
|
Report Coverage |
Details |
|
Page number |
229 |
|
Base year |
2024 |
|
Historic period |
2019-2023 |
|
Forecast period |
2025-2029 |
|
Growth momentum & CAGR |
Accelerate at a CAGR of 6.6% |
|
Market growth 2025-2029 |
USD 12.75 billion |
|
Market structure |
Fragmented |
|
YoY growth 2024-2025(%) |
6.1 |
|
Key countries |
US, Saudi Arabia, Norway, Canada, Brazil, UAE, UK, China, South Africa, and The Netherlands |
|
Competitive landscape |
Leading Companies, market growth and forecasting, Market Positioning of Companies, Competitive Strategies, and Industry Risks |
What are the Key Data Covered in this Digital Oilfield Market Research and Growth Report?
- CAGR of the Digital Oilfield industry during the forecast period
- Detailed information on factors that will drive the growth and forecasting between 2025 and 2029
- Precise estimation of the size of the market and its contribution of the industry in focus to the parent market
- Accurate predictions about upcoming growth and trends and changes in consumer behaviour
- Growth of the market across North America, Middle East and Africa, Europe, APAC, and South America
- Thorough analysis of the market's competitive landscape and detailed information about companies
- Comprehensive analysis of factors that will challenge the digital oilfield market growth of industry companies
We can help! Our analysts can customize this digital oilfield market research report to meet your requirements.
 RIA -
RIA - 
