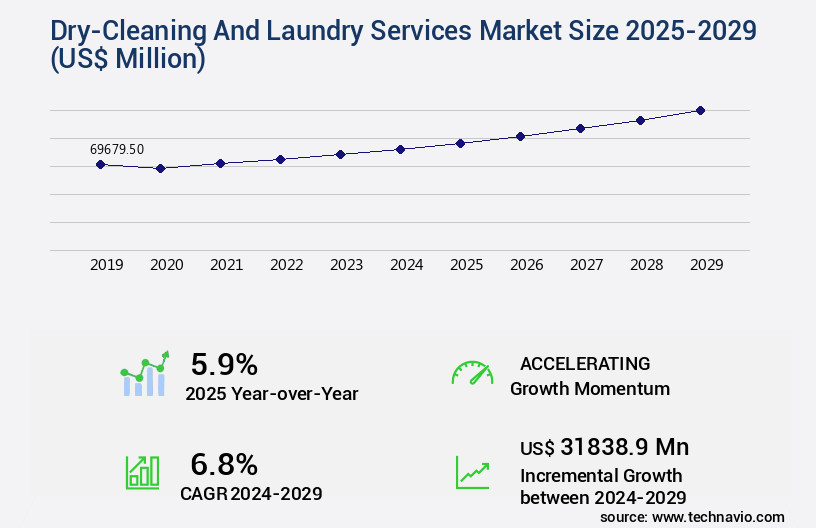
Dry-Cleaning And Laundry Services Market Size 2025-2029
The dry-cleaning and laundry services market size is valued to increase USD 31.84 billion, at a CAGR of 6.8% from 2024 to 2029. Growing tourism and hospitality industry will drive the dry-cleaning and laundry services market.
Major Market Trends & Insights
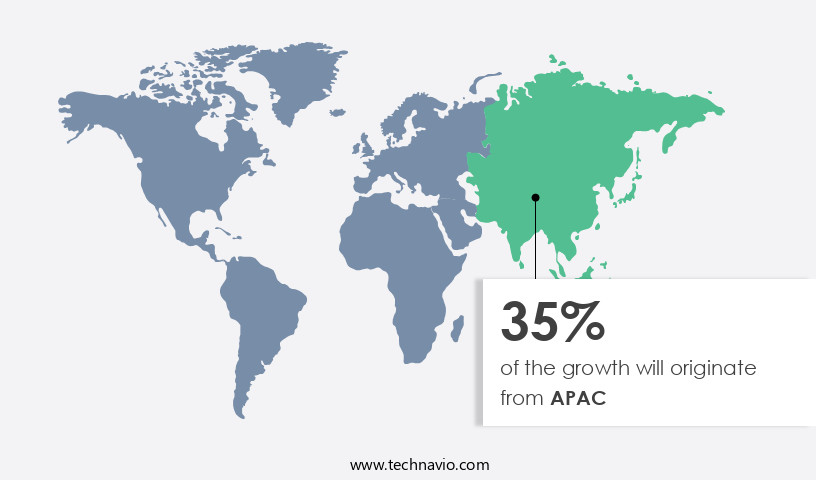
- APAC dominated the market and accounted for a 35% growth during the forecast period.
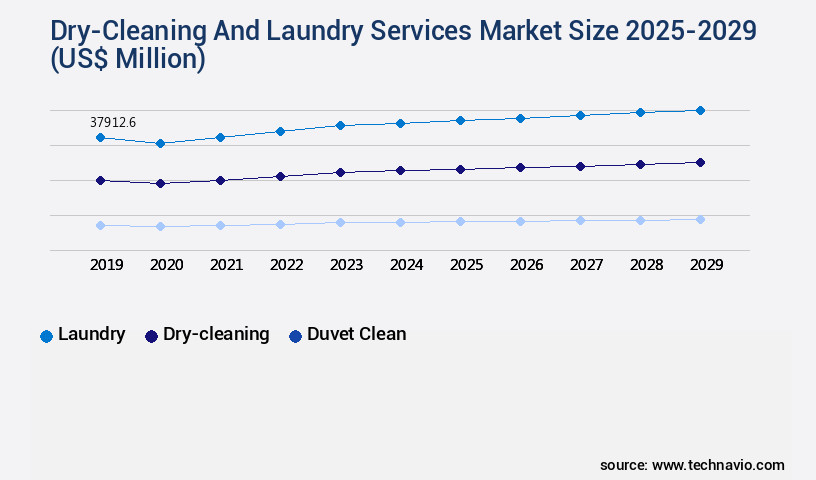
- By Type - Laundry segment was valued at USD 37.91 billion in 2023
- By End-user - Commercial segment accounted for the largest market revenue share in 2023
Market Size & Forecast
- Market Opportunities: USD 62.83 million
- Market Future Opportunities: USD 31838.90 million
- CAGR : 6.8%
- APAC: Largest market in 2023
Market Summary
- The market encompasses a broad spectrum of industries dedicated to providing professional cleaning services for various textiles and garments. This market is characterized by the adoption of core technologies, such as automated sorting systems and advanced fabric care treatments, which enhance efficiency and improve service quality. The market caters to diverse applications, including residential, commercial, and industrial sectors, with service types ranging from dry-cleaning and laundry to ironing and pressing. Regulations, such as environmental guidelines and labor laws, play a significant role in shaping the market landscape. For instance, the European Union's Textile Marking Regulation mandates the use of specific labels on textiles to ensure proper sorting and processing.
- In terms of regional dynamics, the Asia Pacific region is expected to dominate the market due to the growing tourism and hospitality industry and sustained practices of laundry services in countries like China and India. According to a recent study, the Asia Pacific market is projected to account for over 50% of the global market share. Despite the market's growth, it faces challenges such as increasing competition and rising labor costs. Nonetheless, opportunities exist in the form of expanding e-commerce platforms, growing demand for eco-friendly laundry solutions, and the adoption of automation and robotics.
What will be the Size of the Dry-Cleaning And Laundry Services Market during the forecast period?
Get Key Insights on Market Forecast (PDF) Request Free Sample
How is the Dry-Cleaning And Laundry Services Market Segmented and what are the key trends of market segmentation?
The dry-cleaning and laundry services industry research report provides comprehensive data (region-wise segment analysis), with forecasts and estimates in "USD million" for the period 2025-2029, as well as historical data from 2019-2023 for the following segments.
- Type
- Laundry
- Dry-cleaning
- Duvet clean
- End-user
- Commercial
- Residential
- Coin-operated
- Deployment
- Offline
- Online
- Geography
- North America
- US
- Canada
- Europe
- France
- Germany
- Italy
- UK
- APAC
- China
- India
- Japan
- South Korea
- Rest of World (ROW)
- North America
By Type Insights
The laundry segment is estimated to witness significant growth during the forecast period.
The market experiences significant growth, with the laundry segment leading the way in 2024. This segment's dominance can be attributed to the increasing preference for laundry services among consumers. Wash-and-fold and ironing services are popular choices, as they offer convenience and save time. The rise of casual clothing trends and the subsequent increase in washing frequency further bolster the demand for laundry services. Consumers' heightened awareness of personal cleanliness also contributes to the market's expansion. Moreover, operational efficiency improvements in the industry are gaining traction. Energy-efficient equipment and innovative laundry facility designs are being adopted to minimize water and energy consumption.
Water reclamation systems and industrial washing machines are essential components of these designs. Companies are also focusing on employee training programs, delivery route optimization, and inventory management systems to enhance operational efficiency. Energy efficiency metrics and water conservation strategies are essential considerations for market participants. Commercial laundry equipment manufacturers are developing energy-efficient machines, while fabric preservation methods are being employed to minimize water usage. Equipment maintenance schedules and chemical spill response plans are also crucial to ensure the safety and sustainability of operations. Innovations in fabric care chemicals, garment finishing processes, and stain removal techniques are improving the overall quality of laundry services.
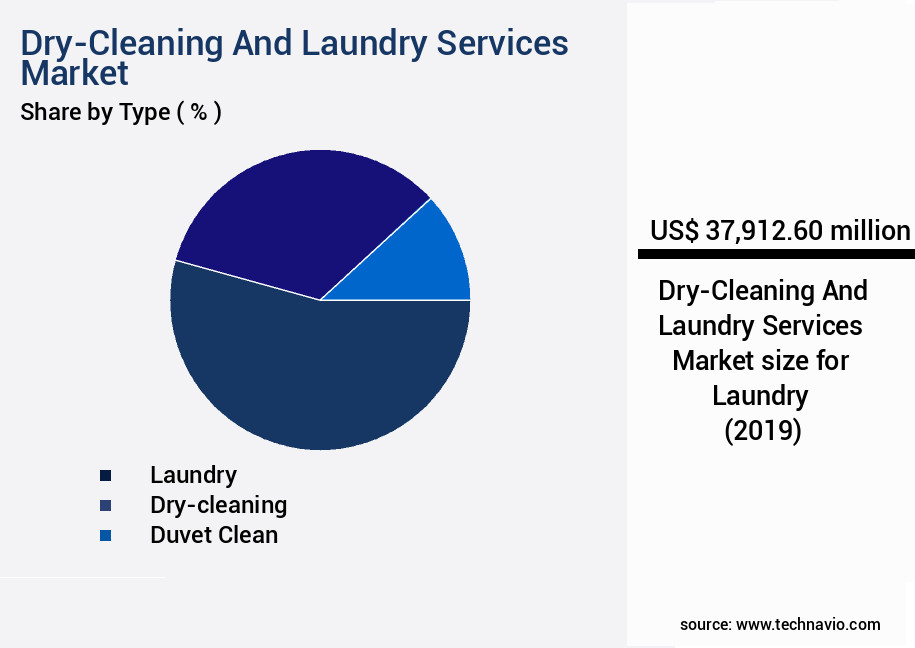
The Laundry segment was valued at USD 37.91 billion in 2019 and showed a gradual increase during the forecast period.
Spotting and pre-treatment techniques, colorfastness testing, and laundry automation systems are essential components of these advancements. Quality control measures, such as fiber damage prevention and customer order management, ensure that customers receive high-quality, damage-free garments. Sustainable cleaning practices and chemical usage reduction strategies are gaining importance in the market. Pricing strategies are being adjusted to accommodate these changes, while safety compliance standards are being strictly adhered to. The future of the market lies in continuous innovation and the ability to cater to evolving consumer needs.
Regional Analysis
APAC is estimated to contribute 35% to the growth of the global market during the forecast period. Technavio's analysts have elaborately explained the regional trends and drivers that shape the market during the forecast period.
See How Dry-Cleaning And Laundry Services Market Demand is Rising in APAC Request Free Sample
The market in APAC experiences significant growth, driven by the expanding middle class and increasing incomes. Urbanization and lifestyle changes, particularly in dual-income households, further fuel the market's expansion. Commercial sectors, including hospitals, hotels, and restaurants, also contribute substantially to the market's growth. Evolving fashion trends in the region necessitate professional cleaning services, particularly for delicate fabrics. Advanced cleaning technologies, such as efficient and eco-friendly cleaning agents and processes, are increasingly adopted to attract customers.
The market's growth is influenced by these factors during the forecast period.
Market Dynamics
Our researchers analyzed the data with 2024 as the base year, along with the key drivers, trends, and challenges. A holistic analysis of drivers will help companies refine their marketing strategies to gain a competitive advantage.
The market is a critical sector that caters to the hygiene and appearance needs of consumers and businesses. This market is characterized by continuous innovation and improvement, with a focus on enhancing the effectiveness of various processes and reducing environmental impact. One significant aspect of the market involves the use of different detergents and optimal temperature settings for laundry. Understanding the effects of these factors on fabric is crucial for maintaining the quality and longevity of garments. Moreover, improving the efficiency of dry cleaning machines is a priority, as is reducing water and energy consumption.
Sustainability is another essential consideration, with the implementation of eco-friendly laundry practices gaining traction. Preventing fabric shrinkage and effectively removing stubborn stains are ongoing challenges that require continuous research and development. Maintaining commercial laundry equipment and adhering to safety procedures for handling cleaning chemicals are essential for ensuring the smooth operation of laundry facilities. Design considerations for laundry facilities and effective strategies for customer service are also vital for success in this market. Laundry automation is a growing trend, offering numerous benefits, including improved workflow, reduced labor costs, and enhanced accuracy. An analysis of laundry detergent formulations reveals that a significant portion of research and development efforts focus on minimizing environmental impact.
Strategies for inventory management and optimizing the pricing structure for services are essential for maintaining profitability in the market. Customer relationship management and employee training are also crucial for ensuring effective operations and compliance with safety and environmental regulations. Adoption rates of automation technologies in large-scale commercial laundry operations are nearly double those in small-scale facilities, highlighting the growing importance of technology in the market. This trend is driven by the need for increased efficiency, reduced labor costs, and enhanced accuracy.
What are the key market drivers leading to the rise in the adoption of Dry-Cleaning And Laundry Services Industry?
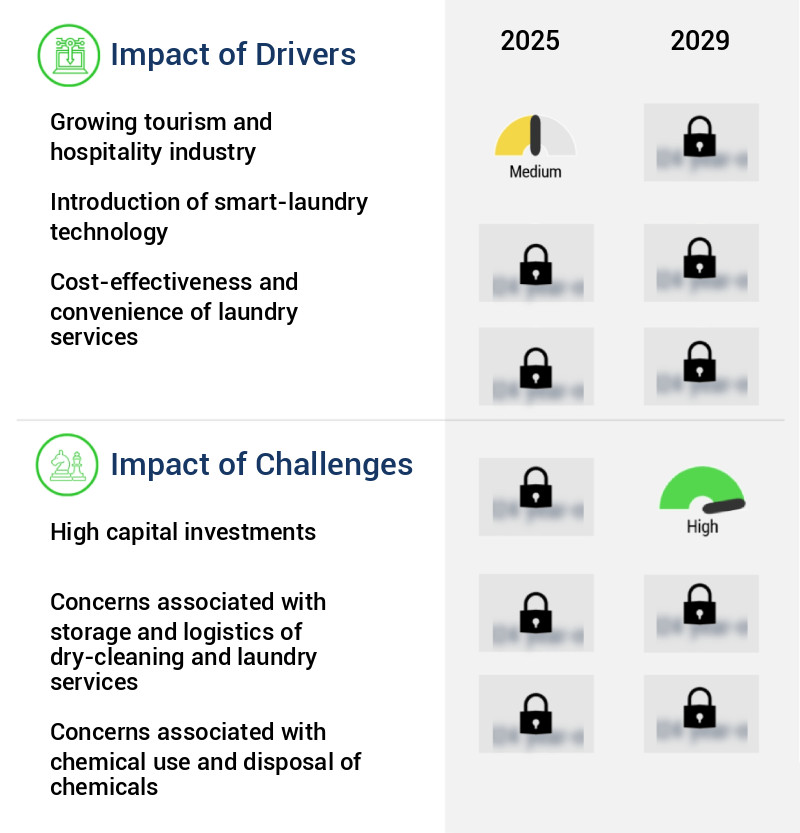
- The tourism and hospitality industry's continued growth serves as the primary market driver.
- The escalating number of tourists worldwide drives the demand for laundry services in the hospitality sector. With the surge in international travel, the number of tourists reached an estimated 235 million by March 2023, doubling the figure from the previous year. This trend significantly impacts the hospitality industry, necessitating increased capacity to manage the higher volume of linens, towels, and other textiles. The World Tourism Organization reports a 50% expansion in real terms from 2021, pushing international tourist receipts beyond the USD 1 trillion mark in 2023.
- In response, hotels and resorts prioritize maintaining high cleanliness and hygiene standards, making laundry services an essential component of their operations.
What are the market trends shaping the Dry-Cleaning And Laundry Services Industry?
- The trend in the market is shifting towards sustained laundry practices. Sustainability is increasingly becoming a priority in the laundry industry.
- With growing environmental consciousness, customers are increasingly favoring eco-friendly laundry practices over traditional methods. Green practices, which include water and energy conservation, are gaining traction in both residential and commercial sectors. On average, households consume over 13,000 gallons of water for washing approximately 300 loads of laundry. By adopting Energy Star-certified washing machines, water consumption can be reduced by more than 5,000 gallons. The professional laundry industry is also embracing sustainability. Companies are implementing water and energy-saving measures, leading to substantial savings.
- For instance, Energy Star-certified commercial washing machines can save up to 50% in water and 35% in energy consumption compared to conventional models. This shift towards eco-friendly practices not only benefits the environment but also contributes to cost savings.
What challenges does the Dry-Cleaning And Laundry Services Industry face during its growth?
- A significant challenge to industry growth is the requirement for substantial capital investments.
- The commercial laundry industry entails substantial investments, with the need to purchase industrial washing machines being a significant expense. These machines can cost anywhere from approximately USD 230,000 USD to USD 1,000,000, depending on the location, machine type, and scale of the operation. Utilities, such as water and electricity, also impact the business's cost structure. Any substantial price fluctuations in these resources can negatively affect the laundry business's profitability. Moreover, regular maintenance is essential to ensure the longevity and optimal performance of the machines. Companies must invest in chemicals, including detergents, spot-stain removers, and bleach, to sanitize fabrics effectively.
- The ongoing expenses for these chemicals, along with maintenance costs, add to the business's operational expenditures. The commercial laundry market is dynamic, with ongoing shifts in consumer preferences and technological advancements. For instance, the increasing demand for eco-friendly laundry solutions has led to the development of green detergents and energy-efficient machines. Additionally, the rise of on-demand laundry services and automation technologies have transformed the industry landscape. In conclusion, starting a commercial laundry business requires substantial capital investments and ongoing operational expenses. While these costs can be substantial, the laundry industry offers opportunities for growth and innovation, with evolving consumer preferences and technological advancements shaping its future.
Exclusive Technavio Analysis on Customer Landscape
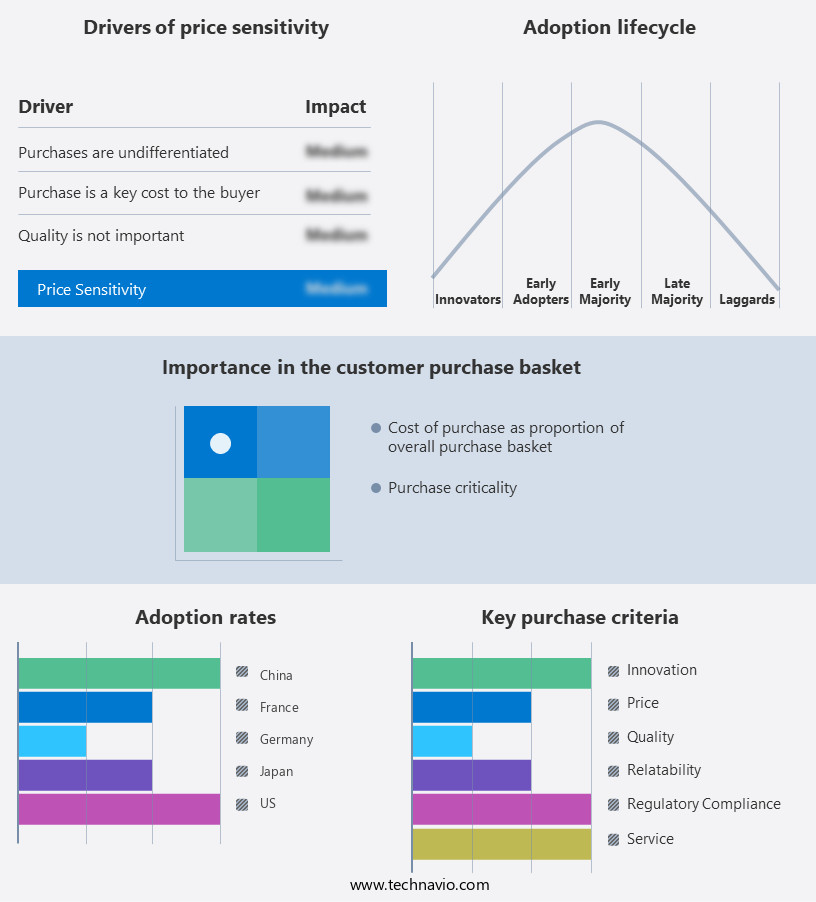
The dry-cleaning and laundry services market forecasting report includes the adoption lifecycle of the market, covering from the innovator's stage to the laggard's stage. It focuses on adoption rates in different regions based on penetration. Furthermore, the dry-cleaning and laundry services market report also includes key purchase criteria and drivers of price sensitivity to help companies evaluate and develop their market growth analysis strategies.
Customer Landscape of Dry-Cleaning And Laundry Services Industry
Competitive Landscape
Companies are implementing various strategies, such as strategic alliances, dry-cleaning and laundry services market forecast, partnerships, mergers and acquisitions, geographical expansion, and product/service launches, to enhance their presence in the industry.
American Dry Cleaning Co. - This company specializes in dry cleaning and laundry services, delivering same-day turnaround with pickup and delivery options for wash and fold services.
The industry research and growth report includes detailed analyses of the competitive landscape of the market and information about key companies, including:
- American Dry Cleaning Co.
- Angelica Textile Services
- ByNext Inc.
- CSC ServiceWorks Inc.
- Evans Express Laundry Center
- EVI Industries Inc.
- Great American cleaners
- Inc and Co Group Ltd.
- Jyothy Fabricare Services Ltd.
- Lapels Dry Cleaning
- Laundry Town Inc.
- Marberry Cleaners and Launderers
- Mulberrys Garment Care
- OXXO Care Cleaners
- Quickclean Pvt. Ltd.
- Rinse Inc.
- Simply Laundry Inc.
- The Procter and Gamble Co.
- Washmen Laundry LLC
- Yates Dry Cleaning
Qualitative and quantitative analysis of companies has been conducted to help clients understand the wider business environment as well as the strengths and weaknesses of key industry players. Data is qualitatively analyzed to categorize companies as pure play, category-focused, industry-focused, and diversified; it is quantitatively analyzed to categorize companies as dominant, leading, strong, tentative, and weak.
Recent Development and News in Dry-Cleaning And Laundry Services Market
- In January 2024, GreenEarth Technologies, a leading provider of environmentally friendly dry-cleaning solutions, announced the launch of its new "Eco-Cleaning" service, which uses a non-toxic, silicone-based solvent to replace traditional petroleum-based chemicals. This innovation addresses growing consumer concerns about the environmental impact of dry-cleaning (Source: GreenEarth Technologies Press Release).
- In March 2024, Coinstar, a leading provider of self-service coin-counting kiosks, entered the dry-cleaning market by acquiring a majority stake in CleanStar Technologies, a company specializing in automated dry-cleaning machines. This strategic move aimed to expand Coinstar's offerings and tap into the growing demand for convenient, self-service laundry and dry-cleaning solutions (Source: Coinstar Investor Relations).
- In May 2024, FlyCleaners, a leading on-demand laundry and dry-cleaning service, secured a USD 10 million Series B funding round led by Sequoia Capital India. The investment will be used to expand FlyCleaners' operations in India and enhance its technology platform (Source: Sequoia Capital India Press Release).
- In February 2025, the European Union passed new regulations on the use of per- and polyfluoroalkyl substances (PFAS) in textile treatments, including those used in dry-cleaning processes. The regulations aim to reduce the environmental impact of these chemicals and will come into effect in January 2027 (Source: European Commission Press Release). This regulatory development is expected to drive demand for alternative, eco-friendly dry-cleaning solutions in the European market.
Dive into Technavio's robust research methodology, blending expert interviews, extensive data synthesis, and validated models for unparalleled Dry-Cleaning And Laundry Services Market insights. See full methodology.
|
Market Scope |
|
|
Report Coverage |
Details |
|
Page number |
212 |
|
Base year |
2024 |
|
Historic period |
2019-2023 |
|
Forecast period |
2025-2029 |
|
Growth momentum & CAGR |
Accelerate at a CAGR of 6.8% |
|
Market growth 2025-2029 |
USD 31838.9 million |
|
Market structure |
Fragmented |
|
YoY growth 2024-2025(%) |
5.9 |
|
Key countries |
US, China, Germany, Japan, UK, India, South Korea, Canada, Italy, and France |
|
Competitive landscape |
Leading Companies, Market Positioning of Companies, Competitive Strategies, and Industry Risks |
Research Analyst Overview
- In the dynamic and evolving landscape of dry-cleaning and laundry services, energy efficiency has emerged as a critical factor in facility design and operational efficiency. Energy-efficient equipment, such as industrial washing machines and dry cleaning machines, is increasingly adopted to reduce energy consumption and operational costs. One notable trend is the integration of water reclamation systems, which recycle and reuse water in the laundry process, significantly reducing water usage. Moreover, the industry is focusing on employee training programs to optimize delivery route planning and improve spotting and pre-treatment techniques. This not only enhances the quality of services but also reduces the need for excessive use of laundry detergents and fabric care chemicals.
- Laundry automation systems, including colorfastness testing and quality control measures, are essential for maintaining high standards while minimizing human intervention. Fabric preservation methods, such as fiber damage prevention and shrinkage control techniques, are also gaining traction to ensure the longevity of garments. Water conservation strategies, like equipment maintenance schedules and wastewater treatment, are crucial for sustainable cleaning practices. Chemical usage reduction is another area of focus, with the industry exploring alternative fabric care chemicals and eco-friendly laundry detergents. Pricing strategies and safety compliance standards are also essential aspects of the market. By implementing efficient systems and adhering to safety regulations, businesses can ensure a competitive edge while maintaining a strong commitment to customer satisfaction.
- In summary, the market is continuously evolving, with a strong emphasis on energy efficiency, operational efficiency improvements, and sustainable practices. By focusing on these areas, businesses can not only reduce costs but also enhance the overall quality of their services and meet the evolving demands of their customers.
What are the Key Data Covered in this Dry-Cleaning And Laundry Services Market Research and Growth Report?
-
What is the expected growth of the Dry-Cleaning And Laundry Services Market between 2025 and 2029?
-
USD 31.84 billion, at a CAGR of 6.8%
-
-
What segmentation does the market report cover?
-
The report segmented by Type (Laundry, Dry-cleaning, and Duvet clean), End-user (Commercial, Residential, and Coin-operated), Deployment (Offline and Online), and Geography (APAC, Europe, North America, Middle East and Africa, and South America)
-
-
Which regions are analyzed in the report?
-
APAC, Europe, North America, Middle East and Africa, and South America
-
-
What are the key growth drivers and market challenges?
-
Growing tourism and hospitality industry, High capital investments
-
-
Who are the major players in the Dry-Cleaning And Laundry Services Market?
-
Key Companies American Dry Cleaning Co., Angelica Textile Services, ByNext Inc., CSC ServiceWorks Inc., Evans Express Laundry Center, EVI Industries Inc., Great American cleaners, Inc and Co Group Ltd., Jyothy Fabricare Services Ltd., Lapels Dry Cleaning, Laundry Town Inc., Marberry Cleaners and Launderers, Mulberrys Garment Care, OXXO Care Cleaners, Quickclean Pvt. Ltd., Rinse Inc., Simply Laundry Inc., The Procter and Gamble Co., Washmen Laundry LLC, and Yates Dry Cleaning
-
Market Research Insights
- The market encompasses a range of offerings, from professional services to self-service laundromats. According to industry estimates, this market generated over USD 100 billion in revenue worldwide in 2020, with professional laundry services accounting for approximately two-thirds of this total. Fiber identification and stain identification play crucial roles in maintaining cleaning efficacy and customer satisfaction. In contrast, self-service laundromats cater to consumers seeking cost reduction and convenience. These establishments have seen a rise in popularity, with over 30,000 self-service laundromats operating in the US alone. Material degradation and waste reduction are key concerns for both segments, with solvent recycling and automated sorting systems being employed to minimize environmental impact.
- Marketing and advertising, online order placement, and mobile app integration are essential strategies for businesses seeking to attract and retain customers. Process optimization and production efficiency are also vital for profitability improvements, with data analytics and quality assurance checks playing a pivotal role in ensuring consistent performance. Smart laundry technology, including cleaning efficacy enhancements and detergent formulation advancements, continues to drive innovation within the market.
We can help! Our analysts can customize this dry-cleaning and laundry services market research report to meet your requirements.
 RIA -
RIA - 
