Electric Motor Sales Market Size 2025-2029
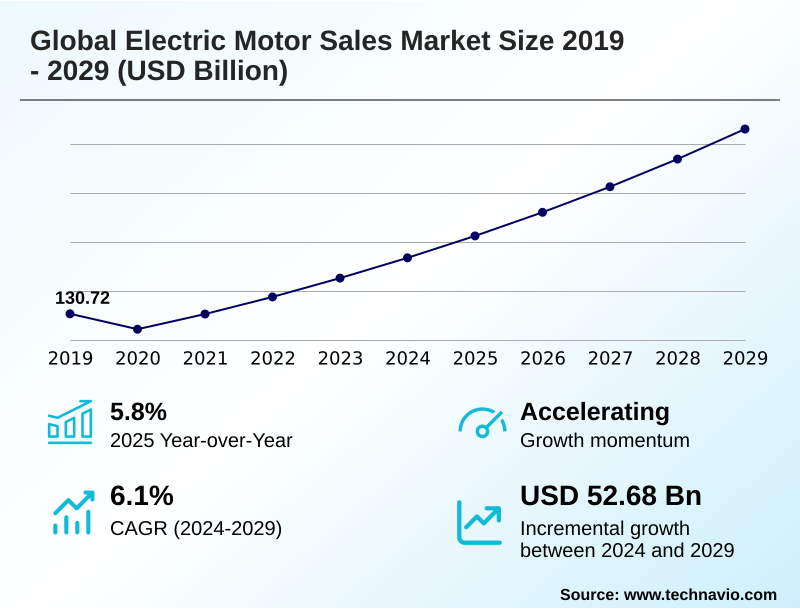
The electric motor sales market size is valued to increase by USD 52.68 billion, at a CAGR of 6.1% from 2024 to 2029. Transition of global automotive industry to EV and robotic technologies will drive the electric motor sales market.
Major Market Trends & Insights
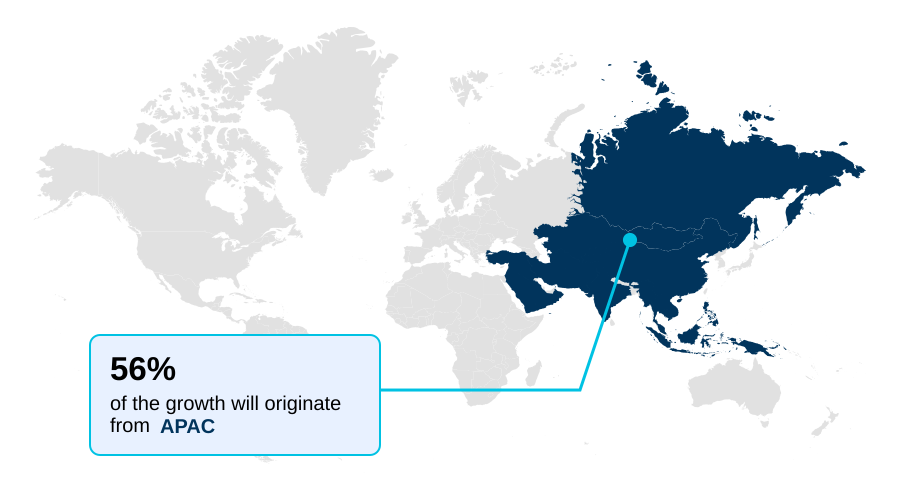
- APAC dominated the market and accounted for a 55.8% growth during the forecast period.
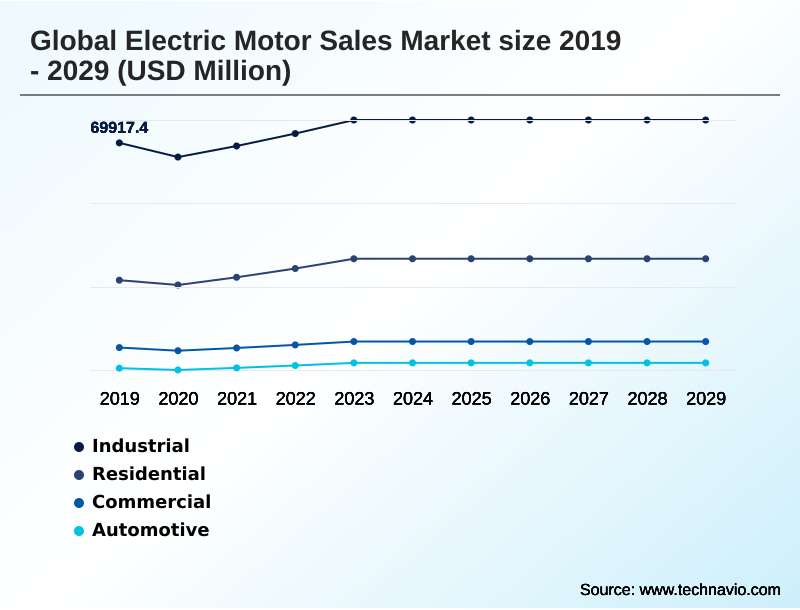
- By Application - Industrial segment was valued at USD 75.92 billion in 2023
- By Channel - OEMs segment accounted for the largest market revenue share in 2023
Market Size & Forecast
- Market Opportunities: USD 75.58 billion
- Market Future Opportunities: USD 52.68 billion
- CAGR from 2024 to 2029 : 6.1%
Market Summary
- The electric motor sales market is undergoing a significant transformation, driven by the global shift towards electrification and automation. A primary catalyst is the accelerating adoption of electric vehicles, which creates sustained demand for advanced traction motors and sophisticated powertrain electrification solutions.
- Concurrently, the push for Industry 4.0 is fueling the integration of industrial automation motors and smart systems across manufacturing, logistics, and processing industries. For example, a modern automated warehouse leverages a network of robotic arm actuators and autonomous guided vehicles, where motor performance directly impacts throughput and operational efficiency, with optimized systems reducing order fulfillment times by over 25%.
- This demand is complemented by stricter energy efficiency regulations, which compel businesses to invest in high-performance AC induction motors and brushless DC motors. These systems, often paired with variable frequency drives (VFD), offer precise control and significant energy savings.
- However, the market faces challenges from supply chain volatility for key materials and the proliferation of low-quality alternatives that undermine performance and reliability.
What will be the Size of the Electric Motor Sales Market during the forecast period?
Get Key Insights on Market Forecast (PDF) Get Free Sample
How is the Electric Motor Sales Market Segmented?
The electric motor sales industry research report provides comprehensive data (region-wise segment analysis), with forecasts and estimates in "USD million" for the period 2025-2029, as well as historical data from 2019-2023 for the following segments.
- Application
- Industrial
- Residential
- Commercial
- Automotive
- Channel
- OEMs
- Aftermarket
- Type
- AC motors
- DC motors
- Hermetic motors
- Geography
- APAC
- Japan
- China
- India
- Europe
- Germany
- UK
- France
- North America
- US
- Canada
- Mexico
- South America
- Brazil
- Argentina
- Colombia
- Middle East and Africa
- UAE
- Saudi Arabia
- South Africa
- Rest of World (ROW)
- APAC
By Application Insights
The industrial segment is estimated to witness significant growth during the forecast period.
The industrial sector remains a foundational segment, driven by the relentless pursuit of automation and energy efficiency. Industrial applications rely on robust components like servo motors and electromechanical actuators for powering pumps, conveyors, and complex machinery.
The push toward smart manufacturing is fueling demand for integrated motor drives with predictive maintenance sensors to optimize operations.
Regulatory mandates are a significant catalyst, compelling operators to adopt motors meeting higher electric motor efficiency standards (IE-code), such as the IE4 super-premium efficiency class. This transition away from older, less efficient units is creating continuous market activity.
For instance, facilities upgrading to IE4-compliant systems report energy consumption reductions of up to 15%, directly impacting operational expenditures and aligning with sustainability goals.
The use of industrial electric motors and high-voltage electric motors is crucial for heavy-duty tasks, while motion control solutions and power transmission components ensure system-wide performance.
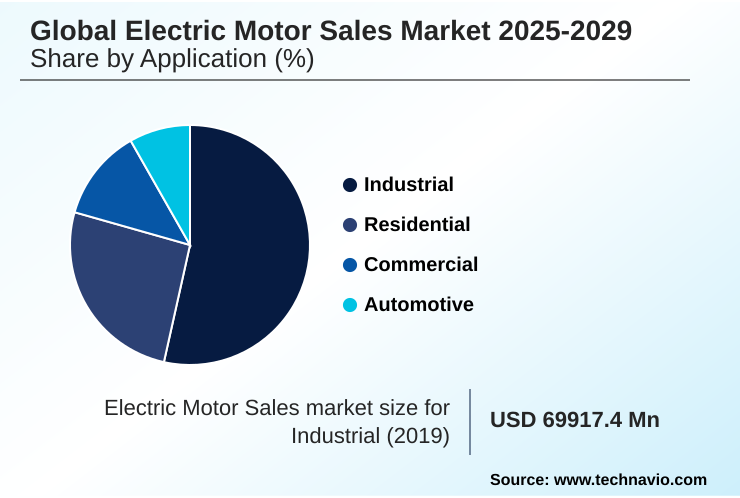
The Industrial segment was valued at USD 75.92 billion in 2023 and showed a gradual increase during the forecast period.
Regional Analysis
APAC is estimated to contribute 55.8% to the growth of the global market during the forecast period.Technavio’s analysts have elaborately explained the regional trends and drivers that shape the market during the forecast period.
See How Electric Motor Sales Market Demand is Rising in APAC Get Free Sample
The geographic landscape is dominated by the APAC region, underpinned by its vast manufacturing ecosystem.
China leads this dominance, accounting for approximately 58% of global electric vehicle production and housing a supply chain that produces over 60% of the world's electric cars.
This massive scale drives demand for traction motors and permanent magnet synchronous motors (PMSM). The region's growth is further supported by emerging manufacturing hubs and strong demand for high-power density motors and submersible motors in industrial and infrastructure projects.
In Japan, a mature market, the focus is on high-precision applications like robotics and advanced manufacturing, which require sophisticated stator and rotor design and superior motor performance testing.
This creates a market for high-value advanced motor materials and components, reflecting a focus on technological leadership rather than just volume.
Market Dynamics
Our researchers analyzed the data with 2024 as the base year, along with the key drivers, trends, and challenges. A holistic analysis of drivers will help companies refine their marketing strategies to gain a competitive advantage.
- Strategic decisions in the electric motor sales market are increasingly focused on optimizing total cost of ownership, moving beyond initial procurement price. The impact of VFD on AC motor efficiency is a critical consideration for industrial end-users, as variable frequency drives can reduce energy consumption significantly in applications with fluctuating loads.
- Similarly, the selection of brushless DC motor applications in robotics requires careful analysis of precision, durability, and control loop performance. A key debate involves comparing axial flux and radial flux motors, with each offering distinct advantages in torque density and form factor for specific EV and aerospace applications.
- Addressing thermal management for high-performance EV motors is paramount, as effective cooling is directly linked to sustained power output and battery longevity. The industry also faces significant challenges in rare-earth-free motor design, with many firms exploring switched reluctance motor advantages in industrial automation to mitigate supply chain risks.
- Predictive maintenance for industrial electric motors is shifting from a value-added service to a standard requirement, leveraging data from smart sensors to prevent unplanned downtime. This is particularly relevant when evaluating the efficiency gains from IE4 vs IE3 motors, where the lifecycle savings of an IE4 motor can exceed its initial cost premium by more than 30% in continuous-duty applications.
- Firms are also optimizing stator and rotor design for torque and integrating MCUs with PMSM for EV powertrains to achieve superior performance. The growing use of high-torque density motors for heavy machinery and understanding the role of power electronics in motor control are central to designing next-generation systems.
- Furthermore, applications for the regenerative braking system in commercial vehicles, smart motor technology for HVAC systems, and the specialized design of hermetic motor design for refrigeration compressors highlight the market's diversity.
- Analyzing lifecycle cost of industrial motors and selecting the right servo motor precision in manufacturing, electromechanical actuators in aerospace, fractional horsepower motor use in appliances, and submersible motor applications in water systems are all critical for success.
What are the key market drivers leading to the rise in the adoption of Electric Motor Sales Industry?
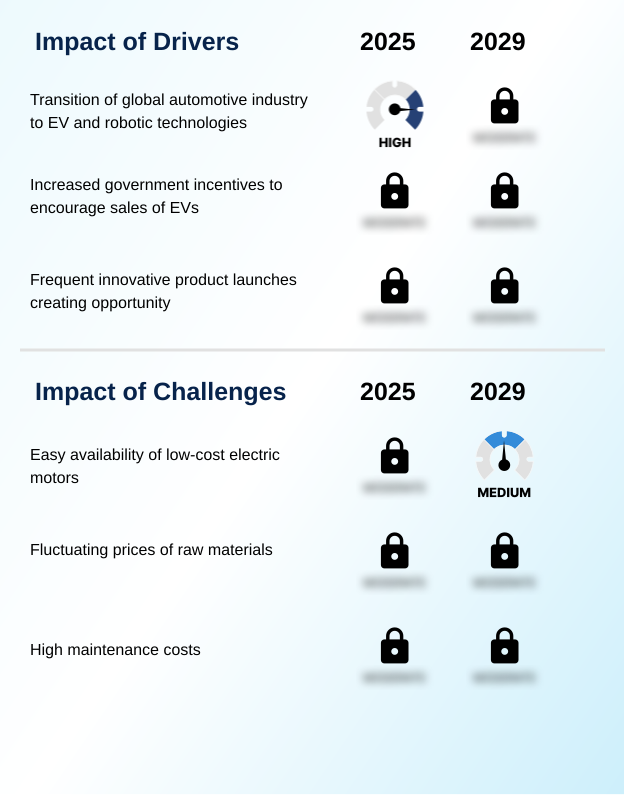
- The global transition of the automotive industry toward electric vehicles and the increasing adoption of robotic technologies are key drivers propelling market growth.
- Market growth is primarily driven by the global transition to electromobility and the expansion of industrial automation.
- Global sales of electric cars saw a 25% year-over-year increase in the first quarter of the year, creating immense demand for advanced traction motors and complete powertrain electrification solutions.
- This automotive shift is complemented by the relentless pace of industrial automation, where industrial automation motors are fundamental to robotics, conveyors, and smart factories.
- The adoption of robotics in manufacturing has increased efficiency by over 30% in certain assembly line tasks, powered by precise robotic arm actuators and servo motors.
- Government incentives and stricter emissions standards further accelerate this transition, while innovations like in-wheel motor technology and regenerative braking systems promise even greater efficiency and performance, ensuring sustained momentum for the market.
What are the market trends shaping the Electric Motor Sales Industry?
- The increasing demand for high-efficiency heating, ventilation, and air conditioning (HVAC) systems is a significant trend shaping the market. This is driven by new construction and retrofitting projects focused on energy conservation.
- Key trends are reshaping the competitive landscape, driven by demands for higher efficiency and customization. The increasing adoption of advanced HVAC system motors is notable, with new systems incorporating brushless DC motors and smart controls to reduce energy consumption by up to 20% compared to legacy units.
- Another significant trend is the in-house development of EV propulsion systems by major automakers. This move toward vertical integration enables superior drive system optimization and performance tuning, yielding improvements in vehicle range and responsiveness. This trend puts pressure on traditional suppliers to innovate with technologies like axial flux motors or offer more specialized motor control units (MCU).
- Furthermore, there's a growing focus on motor winding technology and materials science to enhance the high-torque density required for both compact EVs and industrial robotics, utilizing advanced magnetic materials for superior performance.
What challenges does the Electric Motor Sales Industry face during its growth?
- The widespread availability of low-cost, and often inferior quality, electric motors from unorganized sectors presents a key challenge to market growth and product standards.
- The market faces persistent challenges from the proliferation of low-cost, inferior-quality motors, which can compromise system reliability and operational efficiency. The use of such components can lead to a 40% increase in premature motor failure analysis cases and unplanned downtime, significantly elevating the electric motor lifecycle cost.
- These products often fail to meet established performance benchmarks, undermining the value proposition of high-efficiency systems. Another key challenge is the price volatility of raw materials needed for advanced motor materials and high-performance magnets, which complicates financial planning and pressures profit margins.
- To compete, manufacturers must emphasize the long-term value of quality components, supported by robust motor design simulation and thorough motor performance testing, proving that higher initial investment translates into lower operational expenditures and enhanced productivity.
Exclusive Technavio Analysis on Customer Landscape
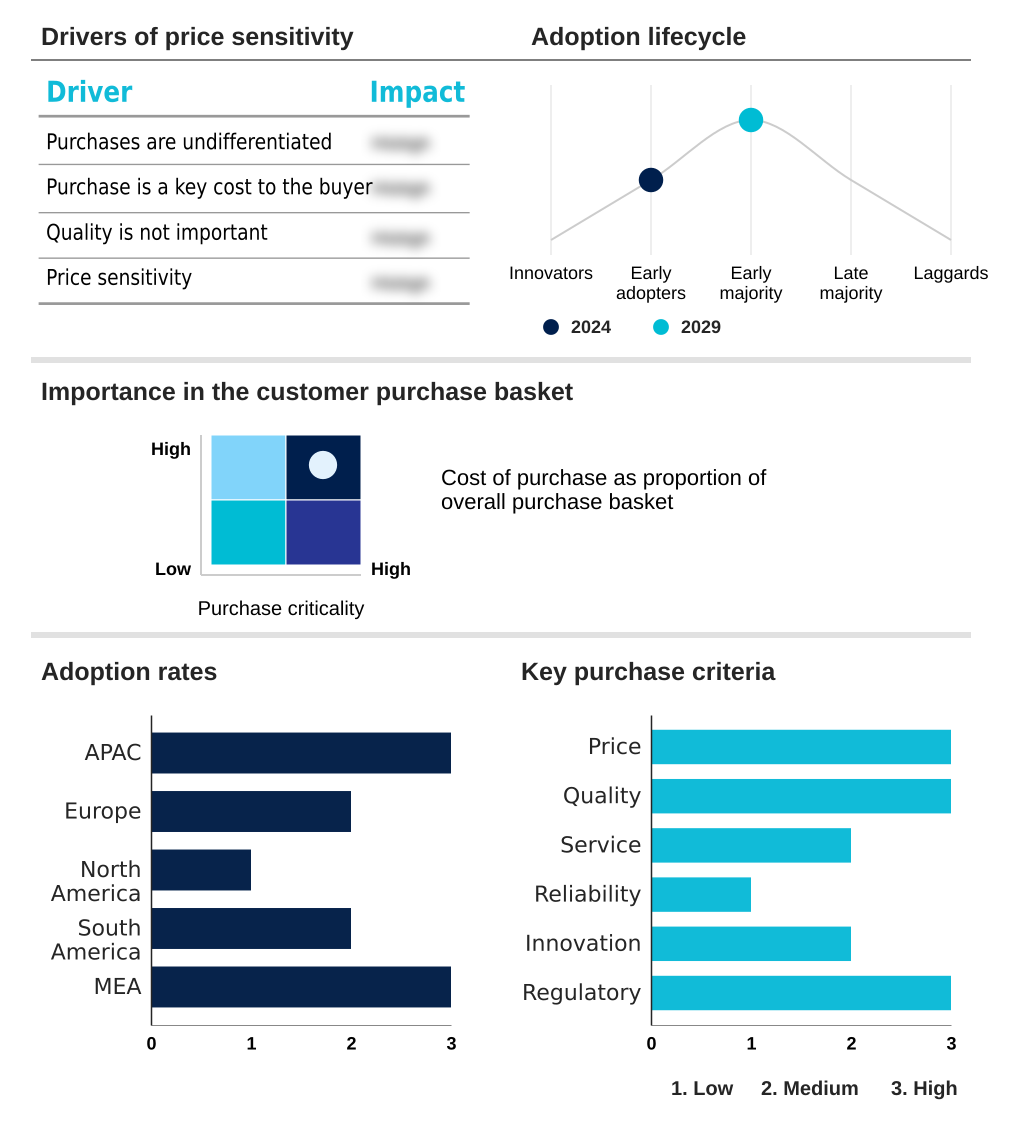
The electric motor sales market forecasting report includes the adoption lifecycle of the market, covering from the innovator’s stage to the laggard’s stage. It focuses on adoption rates in different regions based on penetration. Furthermore, the electric motor sales market report also includes key purchase criteria and drivers of price sensitivity to help companies evaluate and develop their market growth analysis strategies.
Customer Landscape of Electric Motor Sales Industry
Competitive Landscape
Companies are implementing various strategies, such as strategic alliances, electric motor sales market forecast, partnerships, mergers and acquisitions, geographical expansion, and product/service launches, to enhance their presence in the industry.
ABB Ltd. - Offerings feature advanced motion control products and systems, both custom and standard, for automation, robotics, medical, and vehicle markets.
The industry research and growth report includes detailed analyses of the competitive landscape of the market and information about key companies, including:
- ABB Ltd.
- Allied Motion Technologies Inc.
- AMETEK Inc.
- Arc Systems Inc.
- Brook Crompton UK Ltd.
- DENSO Corp.
- Franklin Electric Co. Inc.
- Hyosung Heavy Industries Corp.
- Johnson Electric Holdings Ltd.
- Marathon Electric Motors India Ltd.
- Maxon Computer GmbH
- Nidec Corp.
- Regal Rexnord Corp.
- Schneider Electric SE
- Siemens AG
- Toshiba Corp.
- WEG S.A
- Wolong Electric Group Co. Ltd.
Qualitative and quantitative analysis of companies has been conducted to help clients understand the wider business environment as well as the strengths and weaknesses of key industry players. Data is qualitatively analyzed to categorize companies as pure play, category-focused, industry-focused, and diversified; it is quantitatively analyzed to categorize companies as dominant, leading, strong, tentative, and weak.
Recent Development and News in Electric motor sales market
- In September, 2024, Siemens AG finalized the divestiture of its Innomotics large drives and electric motors business to KPS Capital Partners, sharpening its focus on core industrial automation and digitalization.
- In November, 2024, WEG S.A. announced the acquisition of Volt Electric Motor in Turkey, significantly expanding its manufacturing footprint and market access in the European region.
- In February, 2025, Magna International Inc. secured a major contract to supply a North American automotive OEM with a specialized primary rear eDrive system for a new line of electric trucks.
- In May, 2025, Toyota and Honda jointly announced substantial new investments exceeding several billion dollars to accelerate the development of their solid-state battery technology and expand EV production capacity.
Dive into Technavio’s robust research methodology, blending expert interviews, extensive data synthesis, and validated models for unparalleled Electric Motor Sales Market insights. See full methodology.
| Market Scope | |
|---|---|
| Page number | 290 |
| Base year | 2024 |
| Historic period | 2019-2023 |
| Forecast period | 2025-2029 |
| Growth momentum & CAGR | Accelerate at a CAGR of 6.1% |
| Market growth 2025-2029 | USD 52679.5 million |
| Market structure | Fragmented |
| YoY growth 2024-2025(%) | 5.8% |
| Key countries | Japan, China, India, South Korea, Australia, Indonesia, Germany, UK, France, Italy, Spain, The Netherlands, US, Canada, Mexico, Brazil, Argentina, Colombia, UAE, Saudi Arabia, South Africa, Egypt and Nigeria |
| Competitive landscape | Leading Companies, Market Positioning of Companies, Competitive Strategies, and Industry Risks |
Research Analyst Overview
- The electric motor sales market is evolving beyond simple component supply into a sophisticated ecosystem driven by digitalization and sustainability mandates. Core innovations in traction motors and brushless DC motors are enabling performance breakthroughs in both electric mobility and industrial automation.
- The integration of variable frequency drives (VFD) with AC induction motors is now a standard for achieving energy efficiency, a critical factor in boardroom-level decisions on operational expenditure and environmental compliance. For instance, facilities that adopt systems with integrated motor drives and predictive maintenance sensors have demonstrated a reduction in unplanned machine downtime by over 30%.
- The market is also seeing a push towards rare-earth-free motors, such as switched reluctance motors (SRM) and certain permanent magnet synchronous motors (PMSM), to mitigate supply chain volatility. Advances in stator and rotor design, power electronics integration, and thermal management systems are key differentiators.
- Furthermore, the emphasis on precise motor nameplate data reflects the importance of adherence to electric motor efficiency standards (IE-code), shaping both product development and procurement strategies.
What are the Key Data Covered in this Electric Motor Sales Market Research and Growth Report?
-
What is the expected growth of the Electric Motor Sales Market between 2025 and 2029?
-
USD 52.68 billion, at a CAGR of 6.1%
-
-
What segmentation does the market report cover?
-
The report is segmented by Application (Industrial, Residential, Commercial, and Automotive), Channel (OEMs, and Aftermarket), Type (AC motors, DC motors, and Hermetic motors) and Geography (APAC, Europe, North America, South America, Middle East and Africa)
-
-
Which regions are analyzed in the report?
-
APAC, Europe, North America, South America and Middle East and Africa
-
-
What are the key growth drivers and market challenges?
-
Transition of global automotive industry to EV and robotic technologies, Easy availability of low-cost electric motors
-
-
Who are the major players in the Electric Motor Sales Market?
-
ABB Ltd., Allied Motion Technologies Inc., AMETEK Inc., Arc Systems Inc., Brook Crompton UK Ltd., DENSO Corp., Franklin Electric Co. Inc., Hyosung Heavy Industries Corp., Johnson Electric Holdings Ltd., Marathon Electric Motors India Ltd., Maxon Computer GmbH, Nidec Corp., Regal Rexnord Corp., Schneider Electric SE, Siemens AG, Toshiba Corp., WEG S.A and Wolong Electric Group Co. Ltd.
-
Market Research Insights
- The dynamics of the electric motor sales market are shaped by a convergence of technological innovation and regulatory pressures. The demand for energy-efficient motor systems is paramount, with industrial facilities achieving up to a 12% reduction in energy costs by upgrading to motors compliant with the latest efficiency standards. This is particularly relevant for HVAC system motors and industrial machinery.
- Concurrently, the automotive sector's push for EV propulsion systems has intensified R&D in high-power density motors and advanced electric motor cooling techniques. Automakers are increasingly seeking custom motor engineering to gain a competitive edge, leading to performance gains of over 15% in vehicle range and acceleration compared to off-the-shelf solutions.
- This focus on performance and efficiency underscores the market's competitive landscape, where technological differentiation is a key determinant of success.
We can help! Our analysts can customize this electric motor sales market research report to meet your requirements.
 RIA -
RIA - 
