Enjoy complimentary customisation on priority with our Enterprise License!
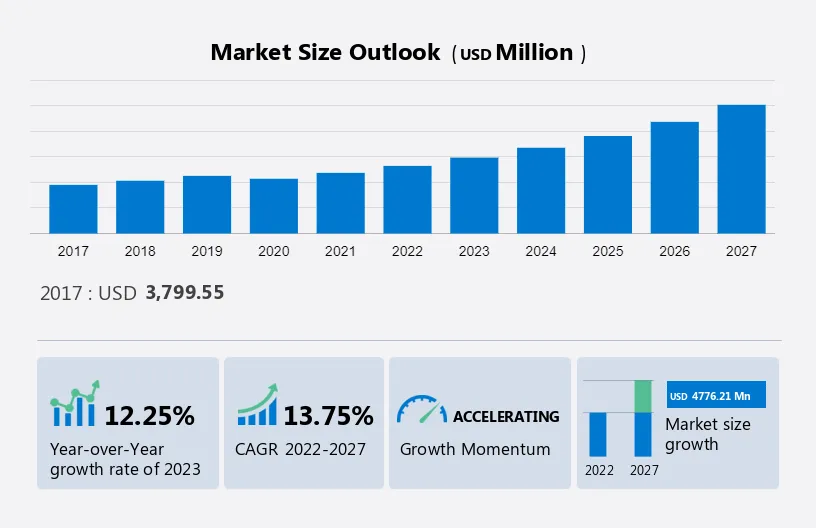
The expense management software market size is estimated to reach by USD 10.06 bn and will grow at a CAGR of 13.75% from 2022 and 2027. The growth of the market depends on several factors, including the increasing adoption of cloud-based solutions, the growing automation of manual processes, and the increasing need for cost reduction.
The market report extensively covers market segmentation by component (solution and service), application (large enterprises and SMEs), and geography (North America, Europe, APAC, South America, and Middle East and Africa). It also includes an in-depth analysis of drivers, trends, and challenges. Furthermore, the report includes historic market data from 2017 to 2021.
To learn more about this report, View Report Sample
The Increasing adoption of cloud-based solutions is notably driving the market growth, although security and privacy concerns associated with expense management software may impede the market growth. Our researchers analyzed the data with 2022 as the base year, along with the key drivers, trends, and challenges. A holistic analysis of drivers will help companies refine their marketing strategies to gain a competitive advantage.
Increasing adoption of cloud-based solutions is notably driving the expense the market growth. Cloud-based solutions are becoming increasingly popular in the market. Cloud-based expense management software solutions offer many advantages over traditional on-premises software solutions, being stored on remote servers and accessed over the Internet. Being able to use cloud-based expense management software from anywhere with an internet-connected device is one of its main advantages. This advantage is important in the modern workplace, where many people work remotely or travel frequently. Additionally, cloud-based expense management software provides real-time visibility into expenses, allowing organizations to track expenses incurred and quickly look for issues and discrepancies. This transparency helps organizations make better spending decisions, reducing the risk of fraud and error.
Cloud-based expense management software solutions are typically less expensive than traditional on-premises solutions. This is because, unlike the latter, there is no need to purchase expensive hardware or software licenses. Cloud-based solutions also improve scalability, as companies can easily scale up or down their software usage as their needs change. Hence, the increasing adoption of cloud-based solutions is driving the growth of the market during the forecast period.
Increasing use of AI and machine learning (ML) in expense management software is a key trend influencing the expense management software market growth. AI and ML technologies are increasingly being integrated into expense management software to automate processes and detect fraud, saving businesses time and money. AI and machine learning can help automate activities such as expense classification, duplicate expense report detection, and expense highlighting that exceed limits set by end-user organizations. By automating these operations, businesses can save time and reduce errors associated with manual processing. Additionally, AI and ML can help uncover fraudulent activity such as fake receipts and expense reports that do not meet company standards. These technologies can analyze data for trends and detect anomalies that help detect and prevent fraud.
AI and machine learning can also help businesses make better decisions by analyzing data and providing insights. Additionally, AI and machine learning can help improve the user experience associated with expense management software by providing personalized recommendations and suggestions based on the user's spending habits. All these advantages of AI and ML in expense management software will drive the growth of the market during the forecast period.
Security and privacy concerns associated with expense management software are challenging the market growth. Ensuring the security of sensitive data such as employee information, financial data, and credit card information is one of the biggest issues in the market. This information should be protected against theft, unauthorized access, and cyber-attacks with appropriate security software. Another issue is data protection, which is more important than ever as cloud-based solutions gain momentum. To avoid data breaches or prevent unauthorized access to sensitive information, companies must ensure that their software providers comply with all relevant data protection laws and have appropriate security measures in place.
Additionally, applications are used all over the world, and it is important to check the various privacy rules and regulations that apply in different countries. The security and privacy concerns in the market will continue to pose major challenges during the forecast period.
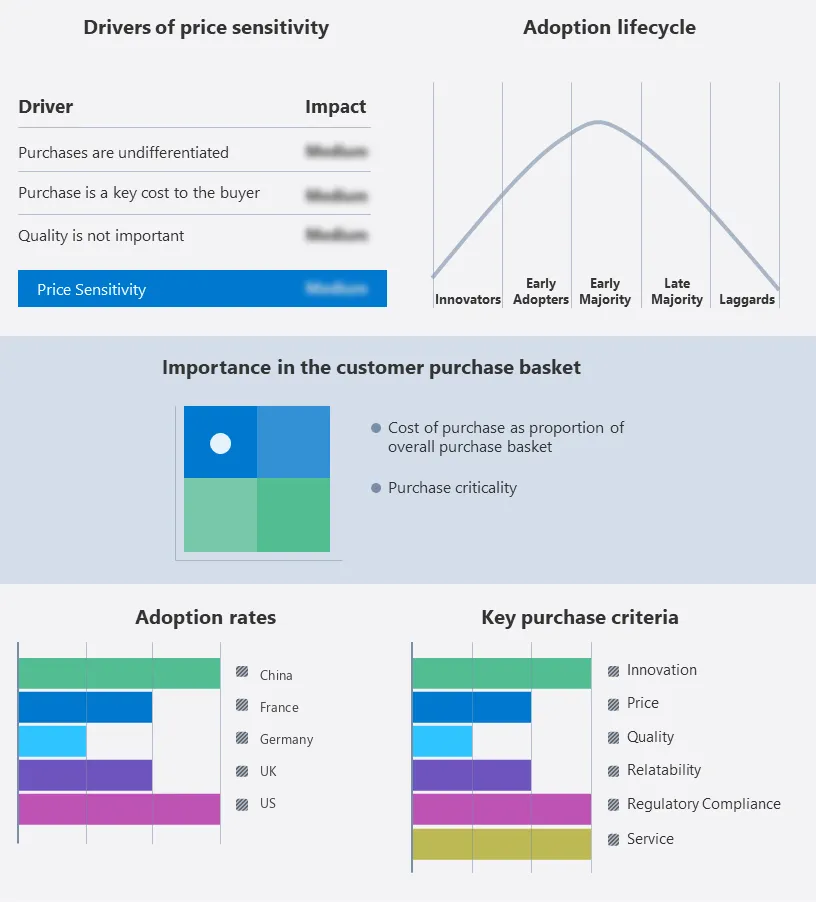
The report includes the adoption lifecycle of the market, covering from the innovator’s stage to the laggard’s stage. It focuses on adoption rates in different regions based on penetration. Furthermore, the report also includes key purchase criteria and drivers of price sensitivity to help companies evaluate and develop their growth strategies.
Global Expense Management Software Market Customer Landscape
Vendors are implementing various strategies, such as strategic alliances, partnerships, mergers and acquisitions, geographical expansion, and product/service launches, to enhance their presence in the market.
Coupa Software Inc: The company offers expense management software namely Coupa Expenses, this software manages travel expenses, supplier records, purchase orders, and budget recorders.
The report also includes detailed analyses of the competitive landscape of the market and information about 15 market vendors, including:
Qualitative and quantitative analysis of vendors has been conducted to help clients understand the wider business environment as well as the strengths and weaknesses of key market players. Data is qualitatively analyzed to categorize vendors as pure play, category-focused, industry-focused, and diversified; it is quantitatively analyzed to categorize vendors as dominant, leading, strong, tentative, and weak.
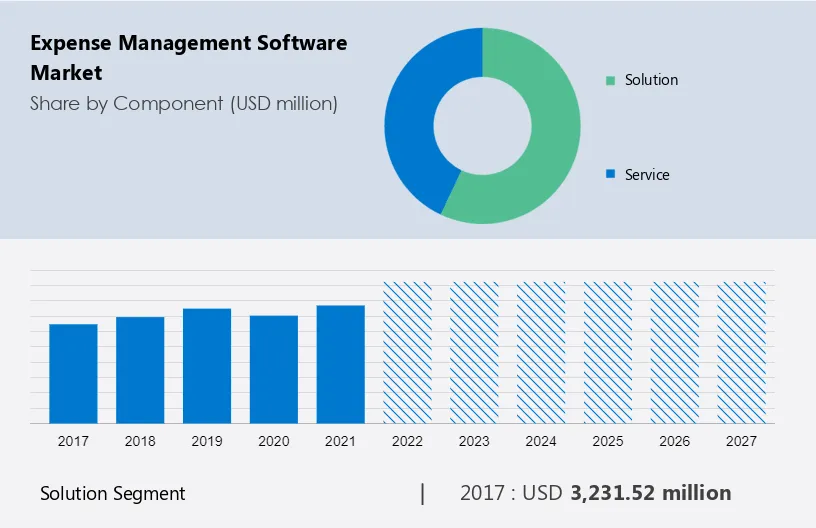
The market share growth by the solution segment will be significant during the forecast period. The market is expanding quickly as it helps organizations manage their expenses. The numerous applications that are offered to organizations to assist them in managing their expenses are referred to as expense management software-as-a solution in the market and comprise two primary categories, namely on-premises and cloud-based software solutions for managing expenses. While cloud-based solutions are hosted on external servers and accessed over the Internet, on-premise solutions are installed on the local servers of the end-user organization.
Get a glance at the market contribution of various segments View the PDF Sample
The solution segment was valued at USD 3,231.52 million in 2017 and continued to grow until 2021. A wide variety of software solutions, including expenditure reporting software, travel and expense management software, invoice management software, and others, are included in the solution segment of the market. These software programs are intended to automate the entire expense-management process, shorten the time and labor involved in the manual management of expenses, and provide end-users with instantaneous access to the expenses incurred by the company. Employees can submit expense reports online using expense reporting software that also automates the approval process. By automating the travel booking process, travel and expense management software help end-user organizations manage travel expenses, among other features that enable end-user organizations to track expenses and enforce travel policies. By automating invoice processing and payment, invoice management software enables businesses to process their invoices. Therefore, the solutions segment is expected to drive the growth of the market during the forecast period.
For more insights on the market share of various regions Download PDF Sample now!
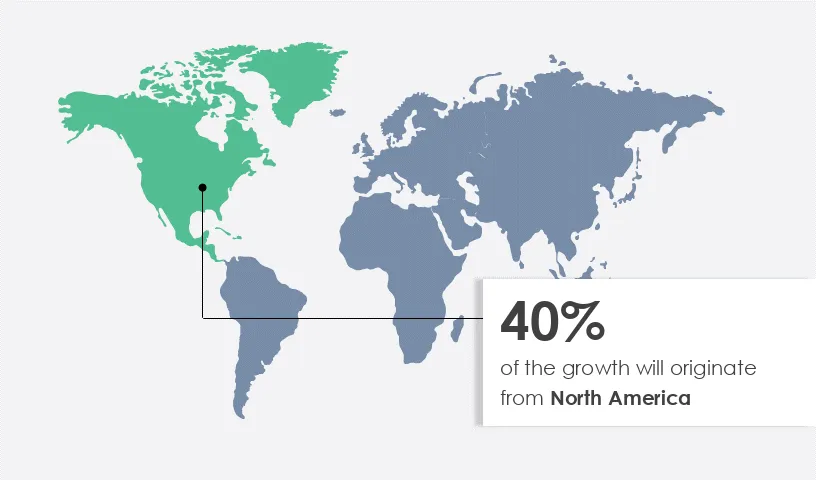
North America is estimated to contribute 40% to the growth of the global expense management software market during the forecast period. Technavio’s analysts have elaborately explained the regional trends and drivers that shape the market during the forecast period.
The market in this region is expected to grow as expense management software is increasingly adopted by companies from various industries such as banking, financial services, and insurance (BFSI). Businesses in North America implement expense management software primarily to simplify the reimbursement process. Banks in the United States and other countries use this software to perfectly validate invoices and reduce additional costs such as printing expense reports. Additionally, while more and more businesses are embracing mobile apps, the region has SAP SE, Zaggle Prepaid Ocean Services Pvt. Ltd., Emburse Inc., Sage Group Plc. SAP SE, Zaggle Prepaid Ocean Services Pvt. Ltd., Emburse Inc., and Sage Group Plc offering highly distinctive solutions that improve the customer experience.
The COVID-19 outbreak adversely affected most businesses in 2020, including those involved in the travel and retail industries. The pandemic resulted in lockdowns in various countries across the world, halting various business activities in 2020, including manufacturing and supply chain activities. The market was adversely affected by the outbreak of the pandemic and slowed down in 2020. Additionally, the pandemic increased the demand for medical services and facilities, helping the market to recover in 2021. Additionally, after the massive COVID-19 vaccination campaign across the world in 2021, lockdown restrictions were lifted and operations of end-user activities across manufacturing, logistics, retail, and wholesale end-user segments resumed. Also, the adoption of cloud-based and on-premise expense management software solutions increased in various activities such as manufacturing and supply chain due to their scalability, flexibility, and cost-effectiveness. Therefore, the market is expected to grow during the forecast period.
The market report forecasts market growth by revenue at global, regional & country levels and provides an analysis of the latest trends and growth opportunities from 2017 to 2027.
Technavio categorizes the global market as a part of the global application software market within the global IT software market. The parent global application software market includes companies involved in the development and manufacture of application and system software. This includes companies that provide database management software. The global application software market includes companies involved in developing and manufacturing software designed for specialized applications for the business or consumer markets. This includes enterprise and technical software as well as cloud-based software.
|
Expense Management Software Market Scope |
|
|
Report Coverage |
Details |
|
Page number |
156 |
|
Base year |
2022 |
|
Historic period |
2017-2021 |
|
Forecast period |
2023-2027 |
|
Growth momentum & CAGR |
Accelerate at a CAGR of 13.75% |
|
Market growth 2023-2027 |
USD 4,776.21 million |
|
Market structure |
Fragmented |
|
YoY growth 2022-2023(%) |
12.25 |
|
Regional analysis |
North America, Europe, APAC, South America, and Middle East and Africa |
|
Performing market contribution |
North America at 40% |
|
Key countries |
US, China, France, Germany, and UK |
|
Competitive landscape |
Leading Vendors, Market Positioning of Vendors, Competitive Strategies, and Industry Risks |
|
Key companies profiled |
Coupa Software Inc., Emburse Inc., Expensify Inc., Fyle Technologies Pvt. Ltd., Insperity Services L.P., International Business Machines Corp., Intuit Inc., ITILITE, Koch Industries Inc., Oracle Corp., Sage Group Plc, SAP SE, Sodexo SA, The Access Group, VA Tech Ventures Pvt. Ltd., Webexpenses Pty Ltd., Workday Inc., Xero Ltd., Zaggle Prepaid Ocean Services Pvt. Ltd., and Zoho Corp. Pvt. Ltd. |
|
Market dynamics |
Parent market analysis, Market growth inducers and obstacles, Fast-growing and slow-growing segment analysis, COVID 19 impact and recovery analysis and future consumer dynamics, Market condition analysis for forecast period |
|
Customization purview |
If our report has not included the data that you are looking for, you can reach out to our analysts and get segments customized. |
We can help! Our analysts can customize this market research report to meet your requirements. Get in touch
1 Executive Summary
2 Market Landscape
3 Market Sizing
4 Historic Market Size
5 Five Forces Analysis
6 Market Segmentation by Component
7 Market Segmentation by Application
8 Customer Landscape
9 Geographic Landscape
10 Drivers, Challenges, and Trends
11 Vendor Landscape
12 Vendor Analysis
13 Appendix
Get lifetime access to our
Technavio Insights


