Enjoy complimentary customisation on priority with our Enterprise License!
The Fish Sauce Market size is projected to increase by USD 915.54 million and the market size is estimated to grow at a CAGR of 6.83% between 2023 and 2028.
This fish sauce market report extensively covers market segmentation by product (industrial fish sauce and traditional fish sauce), distribution channel (offline and online), and geography (APAC, Europe, North America, Middle East and Africa, and South America). Our report examines historical data from 2018 - 2022, besides analyzing the current market scenario.
Increasing preference for convenience in cooking is notably driving the market growth. Nowadays, hectic lifestyles and the need for leisure time have increased the demand for convenience food products. This has led manufacturers to introduce sauces and seasoning products that not only save time in the kitchen but are also easy to use. The number of consumers who prefer home-cooked food over dining out is on the rise and is expected to increase further. In addition to offering convenience food products, manufacturers are also offering convenient product packaging solutions that allow easy use and storage. An increase in the number of single-person households and the rise in social gatherings and parties are some of the other reasons for the rise in the demand for fish sauce during the forecast period. Thus, the increasing need for convenience in cooking will drive the growth of the market during the forecast period.
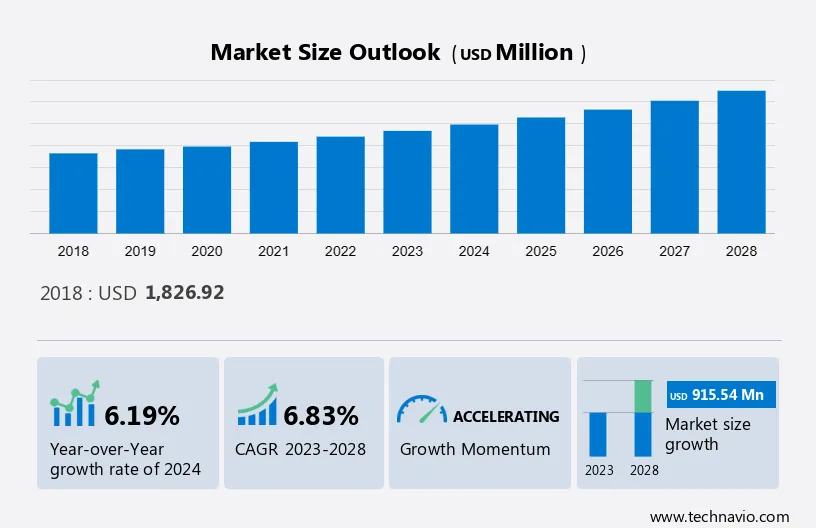
The Fish Sauce Market shows an accelerated CAGR during the forecast period.
To get additional information about the market, Request Free Sample
Production of fish sauce from fish waste is an emerging trend shaping the market growth. The production of fish sauce from fish waste is a key factor that is positively influencing the growth of the global fish sauce market. Fish waste includes a mixture of its head, viscera, scale, skin, caudal fin, and bone. The wastage of fish is increasing globally. It is estimated that about 33% of the total fish caught goes to waste globally because it spoils before it can be consumed. Such fish waste can be effectively reduced by using it for preparing by-products such as fish feed and fish sauce.
Moreover, the use of fish waste to produce fish sauce will help in better utilization of fish. It is estimated that by 2025, nearly 38% of the global fish meal will be produced from fish waste. Thus, the rise in fish waste across the world can increase the production of fish sauce, thus driving the market growth during the forecast period.
Stringent regulations in the food industry are a significant challenge hindering the market growth. Stringent rules and regulations are other challenges for the growth of the global fish sauce market. Rules and regulations vary across countries. In the US, all sauces are subject to the regulations issued by the United States Department of Agriculture (USDA) and the US Food and Drug Administration (FDA). According to the European Union (EU) guidelines, companies need to list all the allergenic ingredients used in the sauce products that are sold by them.
In addition, the EU has listed 14 allergens that need to be mentioned on food product labels when they are used as ingredients in the product. According to the Derbyshire County Council, sauces sold by catering establishments need to be labelled with an indication of any irradiated or genetically modified ingredients, and all names must be accurate. Such factors are expected to drive the market growth during the forecast period.
The offline distribution channel had the largest share of the global fish sauce market in 2022. Offline channel includes hypermarkets, supermarkets, discount stores, and other retail channels. Many consumers still prefer to purchase food products such as fish sauce from physical retail stores as they trust the authenticity and quality of products that they can see and touch. Offline distribution channels are accessible to a wide range of consumers, including those without reliable Internet access or who are less tech-savvy. While e-commerce has witnessed significant traction and growth and is expected to continue doing so, offline distribution channels, including supermarkets, convenience stores, and speciality food retailers, still hold a substantial share of the global fish sauce, which is expected to follow the same trend during the forecast period.
The market share growth by the industrial fish sauce segment will be significant during the forecast period. Industrial fish sauces include fish sauce products made in bulk in factories. Industrial fish sauce is prepared using additives such as flavouring agents, preservatives, food colouring extracted from the fruits, and synthetic sweeteners.
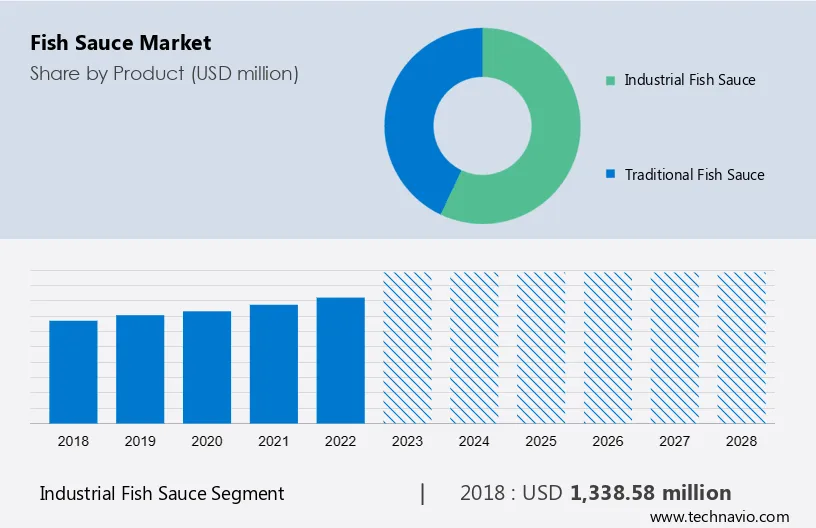
The industrial fish sauce was the largest and was valued at USD 1,338.58 million in 2018
For a detailed summary of the market segments Request for Sample Report
The convenience of using industrial fish sauce compared with traditional sauce will also drive the popularity of industrial fish sauce among consumers. Unlike the traditional fish sauce, the industrial fish sauce does not need to be mixed with vinegar, sugar, and water to make it a dipping sauce. It can be directly poured over food products and can be served. Thus, the increasing production of and demand for industrial fish sauce will drive the segment during the forecast period.
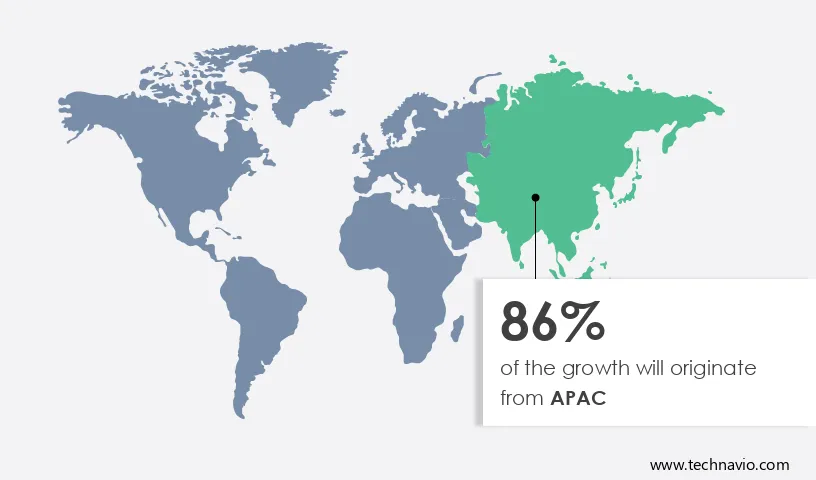
APAC is estimated to contribute 86% to the growth of the global market during the forecast period
Get a glance at the market share of various regions View PDF Sample
Technavio’s analysts have elaborately explained the regional trends and drivers that shape the market during the forecast period. In 2023, the fish sauce market in APAC was highly concentrated due to the presence of a few regional and global companies. China, India, Japan, South Korea, Australia, Taiwan, New Zealand, Singapore, and Indonesia are the major countries in APAC that have a huge market potential for fish sauce in APAC. The increasing disposable income of consumers and the rising number of organized retailing outlets that offer fish sauce products are the major drivers that are estimated to impact the growth of the fish sauce market in APAC.
In addition, some of the leading players in the global fish sauce market are Jinguan Foodstuff (Fujian) Co. Ltd., Pichai Fish Sauce Co. Ltd., and Masan Consumer. The expansion plans and strategic agreements of these companies have been instrumental in accelerating their growth in the global market during the forecast period.
In 2020, the outbreak of COVID-19 affected the growth of the market, owing to stringent lockdown measures and social distancing norms. However, the lockdowns were lifted in the second half of 2020 due to the initiation of large-scale COVID-19 vaccination programs, which led to the resumption of production activities in food processing industries. Furthermore, with consumers avoiding making unnecessary trips to physical stores, many turned to e-commerce as a convenient way to stock up on groceries. Hence, the fish sauce market in the region is expected to grow during the forecast period.
Companies are implementing various strategies, such as strategic alliances, partnerships, mergers and acquisitions, geographical expansion, and product/service launches, to enhance their presence in the market.
The fish sauce market report also includes detailed analyses of the competitive landscape of the market and information about 20 market companies, including:
Qualitative and quantitative analysis of companies has been conducted to help clients understand the wider business environment as well as the strengths and weaknesses of key market players. Data is qualitatively analyzed to categorize companies as pure play, category-focused, industry-focused, and diversified; it is quantitatively analyzed to categorize companies as dominant, leading, strong, tentative, and weak.
The fish sauce market report forecasts market growth by revenue at global, regional & country levels and provides an analysis of the latest trends and growth opportunities from 2018 to 2028.
|
Fish Sauce Market Scope |
|
|
Report Coverage |
Details |
|
Page number |
154 |
|
Base year |
2023 |
|
Historic period |
2018 - 2022 |
|
Forecast period |
2024-2028 |
|
Growth momentum & CAGR |
Accelerate at a CAGR of 6.83% |
|
Market Growth 2024-2028 |
USD 915.54 million |
|
Market structure |
Fragmented |
|
YoY growth 2023-2024(%) |
6.19 |
|
Regional analysis |
APAC, Europe, North America, Middle East and Africa, and South America |
|
Performing market contribution |
APAC at 86% |
|
Key countries |
Vietnam, Thailand, China, Japan, and South Korea |
|
Competitive landscape |
Leading Companies, Market Positioning of Companies, Competitive Strategies, and Industry Risks |
|
Key companies profiled |
Blue Elephant International, California Fish Sauce, Halcyon Proteins Pty. Ltd., Marine Resources Development Co. Ltd., Nestle SA, Pantainorasingh Manufacturer Co. Ltd., Phu Nhi Fish Sauce, Phu Quoc Fish Sauce Manufacturer Hung Thanh, Pichai Fish Sauce Co. Ltd., Rayong Fish Sauce Industry Co. Ltd., Rungroj Fish Sauce Co. Ltd., Tang Sang Hah Co. Ltd., Teo Tak Seng Fish Sauce Factory Co. Ltd., Thai Fishsauce Factory Squid Brand Co. Ltd., Thai Preeda Trading Co. Ltd., Thaitan Foods International Co. Ltd., The Woks of Life LLC, Unilever PLC, Viet Huong Hong Kong, and Viet Phu Inc. |
|
Market dynamics |
Parent market analysis, Market growth inducers and obstacles, Fast-growing and slow-growing segment analysis, COVID-19 impact and recovery analysis and future consumer dynamics, and Market condition analysis for the forecast period. |
|
Customization purview |
If our report has not included the data that you are looking for, you can reach out to our analysts and get segments customized. |
BUY NOW Full Report and Discover more
We can help! Our analysts can customize this market research report to meet your requirements. Get in touch
1 Executive Summary
2 Market Landscape
3 Market Sizing
4 Historic Market Size
5 Five Forces Analysis
6 Market Segmentation by Product
7 Market Segmentation by Distribution Channel
8 Customer Landscape
9 Geographic Landscape
10 Drivers, Challenges, and Trends
11 Vendor Landscape
12 Vendor Analysis
13 Appendix
Get lifetime access to our
Technavio Insights


