Gastric Cancer Drugs Market Size 2025-2029
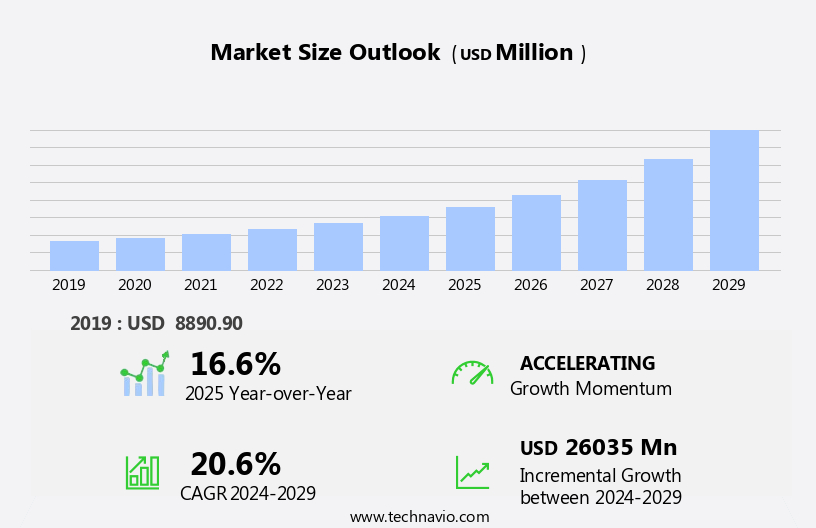
The gastric cancer drugs market size is forecast to increase by USD 26.04 billion, at a CAGR of 20.6% between 2024 and 2029.
- The market is witnessing significant growth, driven by increasing awareness campaigns for this disease and the subsequent surge in diagnoses. The pipeline is robust, with an increasing number of drug approvals and launches, offering new treatment options for patients. However, high treatment costs pose a significant challenge for both patients and healthcare systems, necessitating the need for affordable solutions and potential pricing negotiations between stakeholders. Companies seeking to capitalize on market opportunities must focus on developing cost-effective treatments while ensuring clinical efficacy.
- Collaborations and partnerships with healthcare providers and insurers could also be strategic moves to address the financial burden of treatment for patients. To capitalize on these opportunities, market players must navigate regulatory landscapes effectively, collaborate with healthcare providers to optimize treatment pathways, and invest in research and development to bring new, affordable therapies to market. Moreover, Symptoms like nausea, fatigue, bloating, stomach pain, vomiting, and weight loss often lead to diagnoses.
What will be the Size of the Gastric Cancer Drugs Market during the forecast period?

Explore in-depth regional segment analysis with market size data - historical 2019-2023 and forecasts 2025-2029 - in the full report.
Request Free Sample
The market continues to evolve, driven by ongoing research and development efforts in various sectors. Targeted drug delivery systems, such as antibody-drug conjugates, are gaining traction as they enable precise delivery of therapeutic agents to cancer cells. Clinical trials are underway to explore the efficacy of these approaches, with a focus on patient selection based on molecular markers, including chromosomal abnormalities and microsatellite instability. Next-generation sequencing technologies are revolutionizing the diagnosis and treatment of gastric cancer by enabling the identification of gene mutations and tumor markers. This information is crucial for the development of molecularly targeted agents, including tyrosine kinase inhibitors and monoclonal antibodies, which are being explored in combination therapy to overcome drug resistance and improve treatment response.
Immunotherapies, such as immune checkpoint inhibitors, are also gaining popularity in the treatment of gastric cancer. These agents work by enhancing the body's immune response against cancer cells. However, the complex interplay between tumor suppressor genes, cell cycle regulation, and DNA repair mechanisms necessitates a nuanced understanding of the disease and its progression. Palliative care is another area of focus in the market, with a growing emphasis on improving quality of life for patients. Radiation therapy and chemotherapeutic agents continue to be the mainstay of treatment, with ongoing efforts to optimize treatment regimens and minimize adverse events.
As the market continues to unfold, it is essential to monitor the latest developments in clinical trials, drug development, and precision oncology. The integration of molecular diagnostics, including liquid biopsy and tumor markers, is transforming the way we approach patient care and treatment decisions. The ongoing pursuit of progression-free survival and overall survival remains a top priority, with a growing recognition of the importance of personalized medicine in achieving optimal outcomes.
How is this Gastric Cancer Drugs Industry segmented?
The gastric cancer drugs industry research report provides comprehensive data (region-wise segment analysis), with forecasts and estimates in "USD million" for the period 2025-2029, as well as historical data from 2019-2023 for the following segments.
- Route Of Administration
- Distribution Channel
- Drug Class
- Chemotherapy drugs
- Targeted therapy drugs
- Immunotherapy drugs
- Hormonal therapy
- Line of Therapy
- First-Line
- Second-Line
- Third-Line & Beyond
- Diagnosis Type
- Adenocarcinoma
- Lymphoma
- Gastrointestinal Stromal Tumor (GIST)
- Carcinoid Tumor
- Others
- End-User
- Hospitals
- Specialty Centers
- Cancer Research Institutes
- Homecare
- Geography
- North America
- Europe
- Middle East and Africa
- APAC
- South America
- Rest of World (ROW)
By Route Of Administration Insights
The injectable segment is estimated to witness significant growth during the forecast period.

Request Free Sample
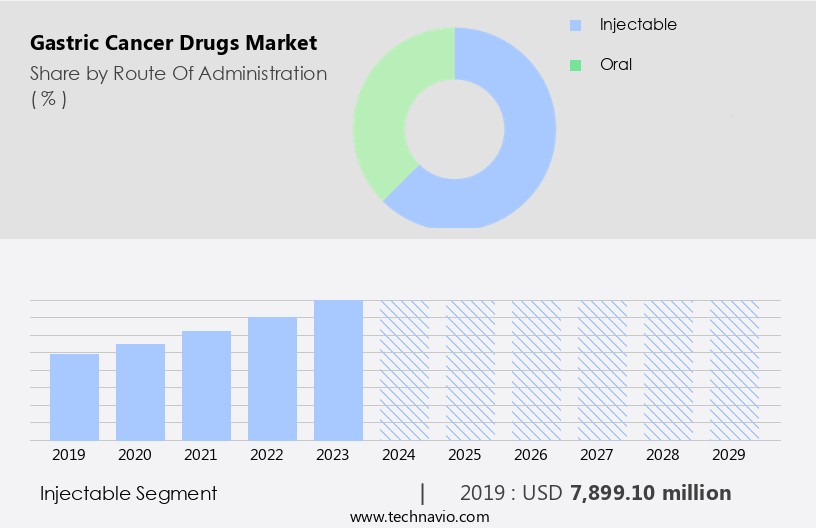
The Injectable segment was valued at USD 7.9 billion in 2019 and showed a gradual increase during the forecast period.
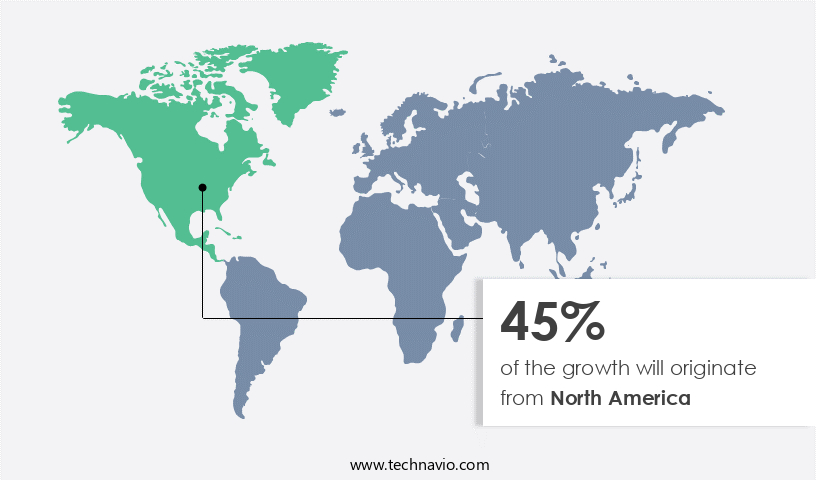
Regional Analysis
North America is estimated to contribute 45% to the growth of the global market during the forecast period.Technavio's analysts have elaborately explained the regional trends and drivers that shape the market during the forecast period.

Request Free Sample
The North American market for gastric cancer drugs is experiencing significant growth due to the high prevalence of this cancer in the region and the availability of advanced therapeutic options. According to the American Cancer Society, an estimated 26,380 new cases and 11,090 deaths from gastric cancer are expected in the US in 2023. The aging population is another contributing factor, as gastric cancer is most common in individuals over 50 years old. Advanced healthcare infrastructure and the presence of leading pharmaceutical companies in North America further fuel market growth. In the realm of drug development, various approaches are being explored, including cell cycle regulation, molecular diagnostics, and targeted therapy.
Phase I trials are underway for several new drugs, such as tyrosine kinase inhibitors and antibody-drug conjugates. Precision oncology, which involves the use of molecular diagnostics and targeted therapy based on specific gene mutations, is also gaining traction. Combination therapy, which involves the use of multiple drugs in combination, is another emerging trend. Drug resistance remains a significant challenge, and research is ongoing to develop strategies to overcome it. Immune checkpoint inhibitors, which work by enhancing the body's immune response against cancer cells, are showing promise in gastric cancer treatment. Adverse events are a concern, and efforts are being made to improve patient safety through personalized medicine and targeted drug delivery.
Microsatellite instability, a common genetic alteration in gastric cancer, is being explored as a potential biomarker for patient selection. Radiation therapy and chemotherapeutic agents continue to be mainstays of gastric cancer treatment, while molecularly targeted agents and antiangiogenic drugs offer new possibilities. DNA repair mechanisms and chromosomal abnormalities are also being investigated as potential targets for new drugs. The ultimate goal is to improve overall survival rates and enhance quality of life for patients. Phase II and III clinical trials are ongoing to evaluate the efficacy and safety of new drugs and treatment regimens. Next-generation sequencing is being used to identify new gene mutations and potential drug targets.
Palliative care is an essential component of gastric cancer treatment, and efforts are being made to improve the quality of life for patients through better symptom management and supportive care. Tumor markers and progression-free survival are key metrics used to evaluate the effectiveness of new treatments. In conclusion, the North American market for gastric cancer drugs is witnessing significant growth due to the high prevalence of the disease and the availability of advanced therapeutic options. Research is ongoing to develop new drugs and treatment strategies, with a focus on personalized medicine, targeted therapy, and combination therapy.
The ultimate goal is to improve overall survival rates and enhance quality of life for patients.
Market Dynamics
The Global Gastric Cancer Drugs Market is undergoing significant transformation, driven by advancements in gastric cancer treatment. Notably, immunotherapy drugs (for gastric cancer) and targeted therapy drugs (for gastric cancer) are revolutionizing care, particularly with the success of HER2 inhibitors and PD-1 inhibitors. While chemotherapy drugs (for gastric cancer) remain a cornerstone, the focus is shifting towards more precise solutions for advanced gastric cancer treatment and metastatic gastric cancer treatment. Precision medicine (gastric cancer), guided by crucial biomarker testing (for gastric cancer), is tailoring approaches for specific patients, including those with HER2-positive gastric cancer. The Asia Pacific Gastric Cancer Drugs Market continues to lead in growth. Pharmaceutical companies (gastric cancer) are heavily invested in gastric cancer drug development, with ongoing clinical trials for gastric cancer exploring effective combination therapies (gastric cancer) and new oral chemotherapy agents, all contributing to evolving gastric cancer market trends.
Our researchers analyzed the data with 2024 as the base year, along with the key drivers, trends, and challenges. A holistic analysis of drivers will help companies refine their marketing strategies to gain a competitive advantage.
What are the key market drivers leading to the rise in the adoption of Gastric Cancer Drugs Industry?
- Gastric cancer awareness campaigns significantly drive market growth by increasing public understanding and early detection of this disease.
- Gastric cancer, a type of cancer affecting the stomach, poses significant challenges due to its often-delayed diagnosis. This leads to increased difficulties in treatment, as the disease's morbidity is high. To address this issue, various organizations are spearheading initiatives on a global scale. The Life Raft Group, a non-profit organization, focuses on enhancing awareness, educating medical professionals, and supporting innovative research for gastric cancer drugs. In the realm of treatment, precision oncology plays a crucial role. Advanced therapies, such as immune checkpoint inhibitors, tyrosine kinase inhibitors, and molecularly targeted agents, are increasingly being used to improve treatment response.
- Radiation therapy and chemotherapeutic agents remain essential components of the treatment regimen. The integration of personalized medicine in gastric cancer treatment is a significant trend. Molecular markers, such as microsatellite instability, are being used to tailor treatments to individual patients. Adverse events associated with these therapies are a concern, and ongoing research aims to mitigate their impact. In summary, the landscape of gastric cancer drugs is dynamic, with a focus on advancing treatment through precision oncology, personalized medicine, and ongoing research to minimize adverse events and improve treatment response. The Life Raft Group's efforts in raising awareness and supporting innovative research contribute significantly to these advancements.
What are the market trends shaping the Gastric Cancer Drugs Industry?
- The number of drug approvals and drug launches is experiencing a significant upward trend in the pharmaceutical market. This trend is driven by advancements in research and development, regulatory approvals, and increasing demand for innovative treatments.
- Gastric cancer drugs have witnessed notable advancements with an increasing number of approvals from regulatory agencies, including the US FDA. This collaboration between regulatory bodies and pharmaceutical companies has expedited the approval process, reducing the time from submission to approval. For instance, Enhertu (trastuzumab deruxtecan), a drug developed by AstraZeneca and Daiichi Sankyo, was approved in the EU in April 2025 as a monotherapy for adult patients with unresectable or metastatic hormone receptor (HR)-positive, HER2-low or HER2-ultralow breast cancer who have received at least one endocrine therapy in the metastatic setting and are not considered suitable for endocrine therapy as the next line of treatment.
- The market dynamics for gastric cancer drugs are influenced by several factors, including the identification of gene mutations and the development of targeted therapies. Drug combinations, treatment regimens, and the understanding of DNA repair mechanisms are also significant factors driving market growth. Furthermore, the use of antiangiogenic drugs and the potential for improved overall survival rates and quality of life have been emphasized in recent research. Phase II trials are ongoing to explore the efficacy of these drugs in treating gastric cancer, with the ultimate goal of improving patient outcomes.
What challenges does the Gastric Cancer Drugs Industry face during its growth?
- The escalating treatment costs for gastric cancer pose a significant challenge to the industry's growth trajectory.
- Gastric cancer drugs, such as Tislelizumab by Novartis, Cyramza injection by Eli Lilly, and Priunta 440 mg Injection by Abbott Laboratories, have shown promise in targeting multiple proteins, making them more effective than traditional chemotherapy drugs. However, their high cost poses a significant challenge for patient access. For instance, Cyramza injection is priced around USD2,995 to USD3,057 per vial. This price barrier, coupled with the anticipated launch of additional biologics, may increase treatment costs during the forecast period. Clinical trials utilizing next-generation sequencing for patient selection and targeted drug delivery have shown potential in improving patient outcomes and reducing side effects.
- These advancements, along with the use of tumor markers and chromosomal abnormalities for diagnosis and treatment, contribute to the progression-free survival of gastric cancer patients. Despite these advancements, palliative care remains an essential aspect of managing gastric cancer. As the disease progresses, patients require supportive care to manage symptoms and maintain a good quality of life. Antibody-drug conjugates, which combine the specificity of monoclonal antibodies with the cytotoxic effects of chemotherapy, are another promising development in the field. These drugs have shown improved efficacy and reduced side effects in clinical trials, particularly in the later stages of gastric cancer.
- Phase III trials are ongoing to further evaluate the safety and efficacy of these drugs in larger patient populations. The successful launch of these drugs, along with continued advancements in targeted drug delivery and patient selection, could potentially increase treatment costs but also improve patient outcomes and overall market growth.
Exclusive Customer Landscape
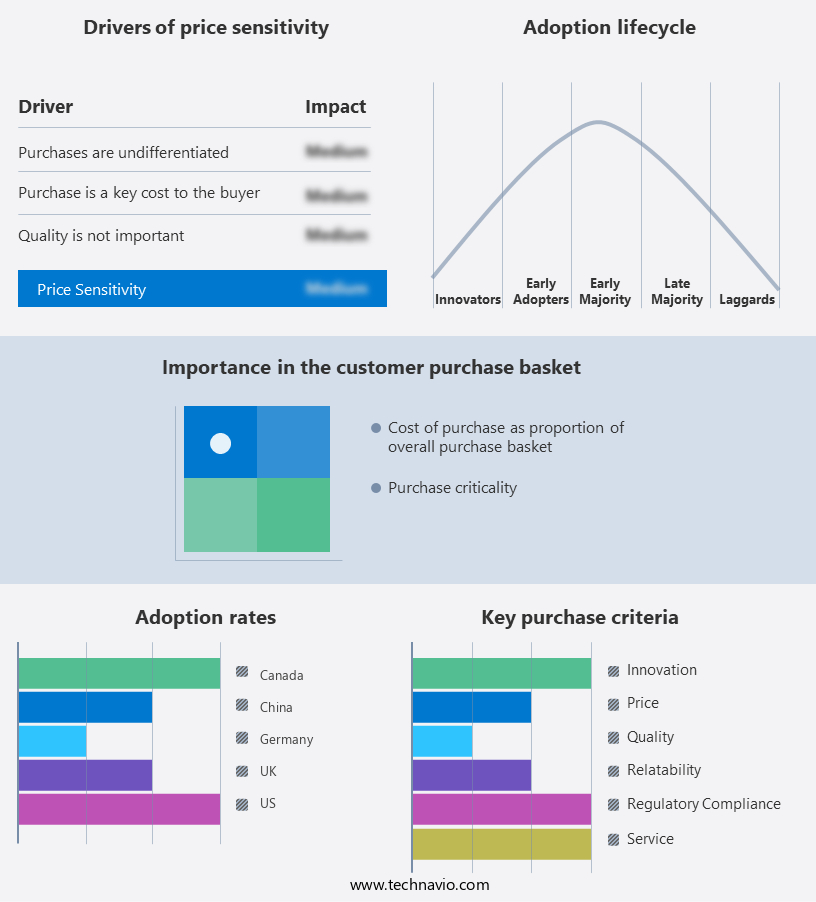
The gastric cancer drugs market forecasting report includes the adoption lifecycle of the market, covering from the innovator's stage to the laggard's stage. It focuses on adoption rates in different regions based on penetration. Furthermore, the gastric cancer drugs market report also includes key purchase criteria and drivers of price sensitivity to help companies evaluate and develop their market growth analysis strategies.

Customer Landscape
Key Companies & Market Insights
Companies are implementing various strategies, such as strategic alliances, gastric cancer drugs market forecast, partnerships, mergers and acquisitions, geographical expansion, and product/service launches, to enhance their presence in the industry.
AbbVie Inc. - The company is developing Bemarituzumab, an investigational drug for gastric cancer treatment. This targeted therapy specifically addresses tumors with overexpressed FGFR2b.
The industry research and growth report includes detailed analyses of the competitive landscape of the market and information about key companies, including:
- AbbVie Inc.
- Amgen Inc.
- AstraZeneca Plc
- Biocon Ltd.
- Blueprint Medicines Corp.
- Boehringer Ingelheim International GmbH
- Bristol Myers Squibb Co.
- Celltrion Co. Ltd.
- Dr Reddys Laboratories Ltd.
- Eisai Co. Ltd.
- Eli Lilly and Co.
- F. Hoffmann La Roche Ltd.
- Merck KGaA
- Novartis AG
- Pfizer Inc.
- Sanofi SA
- Zydus Lifesciences Ltd.
Qualitative and quantitative analysis of companies has been conducted to help clients understand the wider business environment as well as the strengths and weaknesses of key industry players. Data is qualitatively analyzed to categorize companies as pure play, category-focused, industry-focused, and diversified; it is quantitatively analyzed to categorize companies as dominant, leading, strong, tentative, and weak.
Recent Development and News in Gastric Cancer Drugs Market
- In January 2024, Roche Holding AG announced the US Food and Drug Administration (FDA) approval of its new gastric cancer treatment, Zejula (talazoparib), for the treatment of advanced gastric cancer with certain genetic mutations. This approval marked a significant advancement in targeted therapies for this patient population (Roche Press Release, 2024).
- In March 2024, Merck KGaA and Pfizer Inc. Entered into a strategic collaboration to co-develop and commercialize apeptides-based peptide-conjugated antibodies for various cancers, including gastric cancer. This partnership aimed to leverage the expertise of both companies in oncology and antibody-drug conjugates (Merck KGaA Press Release, 2024).
- In May 2024, AstraZeneca Plc completed the acquisition of Alexion Pharmaceuticals Inc. For approximately USD39 billion. The acquisition expanded AstraZeneca's oncology portfolio, including its gastric cancer treatment, Lynparza (olaparib), which was approved for the treatment of advanced gastric cancer in the European Union in January 2024 (AstraZeneca Press Release, 2024).
- In April 2025, the Chinese Food and Drug Administration granted approval for the use of Jiangsu Hengrui Medicine Co. Ltd.'s Farpepide (paclitaxel injection) in combination with platinum-based chemotherapy for the first-line treatment of advanced gastric cancer. This approval marked the first approval of a domestic gastric cancer treatment in China, potentially increasing access to affordable treatment options for patients (Xinhua News Agency, 2025).
Research Analyst Overview
- The gastric cancer market is characterized by ongoing research and advancements in treating both early-stage and metastatic gastric cancer. Drug resistance mechanisms pose a significant challenge, necessitating the exploration of combination therapies and supportive care. Disease monitoring through imaging techniques and clinical practice guidelines plays a crucial role in optimizing patient outcomes. Access to treatment for advanced gastric cancer remains a concern due to healthcare costs and patient compliance. Neoadjuvant therapy and surgical techniques, including robotic surgery, are increasingly utilized. Health economic modeling and healthcare policy are critical in managing drug pricing and ensuring cost-effective care. Cancer research continues to uncover prognostic factors and predictive biomarkers, influencing treatment guidelines.
- Adjuvant therapy and side effects management are essential components of comprehensive care. Drug interactions and supportive care are vital in managing healthcare costs and improving patient outcomes. Surgical techniques, such as minimally invasive surgery, offer benefits in terms of reduced side effects and improved patient recovery.
Dive into Technavio's robust research methodology, blending expert interviews, extensive data synthesis, and validated models for unparalleled Gastric Cancer Drugs Market insights. See full methodology.
Market Scope
|
Report Coverage
|
Details
|
Page number
|
217
|
Base year
|
2024
|
Historic period
|
2019-2023 |
Forecast period
|
2025-2029
|
Growth momentum & CAGR
|
Accelerate at a CAGR of 20.6%
|
Market growth 2025-2029
|
USD 26035 million
|
Market structure
|
Fragmented
|
YoY growth 2024-2025(%)
|
16.6
|
Key countries
|
US, Canada, Germany, China, Mexico, UK, Spain, France, Japan, and India
|
Competitive landscape
|
Leading Companies, Market Positioning of Companies, Competitive Strategies, and Industry Risks
|
Request Free Sample
What are the Key Data Covered in this Gastric Cancer Drugs Market Research and Growth Report?
- CAGR of the Gastric Cancer Drugs industry during the forecast period
- Detailed information on factors that will drive the growth and forecasting between 2025 and 2029
- Precise estimation of the size of the market and its contribution of the industry in focus to the parent market
- Accurate predictions about upcoming growth and trends and changes in consumer behaviour
- Growth of the market across North America, Europe, Asia, and Rest of World (ROW)
- Thorough analysis of the market's competitive landscape and detailed information about companies
- Comprehensive analysis of factors that will challenge the gastric cancer drugs market growth of industry companies
We can help! Our analysts can customize this gastric cancer drugs market research report to meet your requirements.
Get in touch
1 Executive Summary
- 1.1 Market overview
- Executive Summary - Chart on Market Overview
- Executive Summary - Data Table on Market Overview
- Executive Summary - Chart on Global Market Characteristics
- Executive Summary - Chart on Market by Geography
- Executive Summary - Chart on Market Segmentation by Route of Administration
- Executive Summary - Chart on Market Segmentation by Distribution Channel
- Executive Summary - Chart on Market Segmentation by Drug Class
- Executive Summary - Chart on Incremental Growth
- Executive Summary - Data Table on Incremental Growth
- Executive Summary - Chart on Company Market Positioning
2 Technavio Analysis
- 2.1 Analysis of price sensitivity, lifecycle, customer purchase basket, adoption rates, and purchase criteria
- Analysis of price sensitivity, lifecycle, customer purchase basket, adoption rates, and purchase criteria
- 2.2 Criticality of inputs and Factors of differentiation
- Overview on criticality of inputs and factors of differentiation
- 2.3 Factors of disruption
- Overview on factors of disruption
- 2.4 Impact of drivers and challenges
- Impact of drivers and challenges in 2024 and 2029
3 Market Landscape
- 3.1 Market ecosystem
- Parent Market
- Data Table on - Parent Market
- 3.2 Market characteristics
- Market characteristics analysis
4 Market Sizing
- 4.1 Market definition
- Offerings of companies included in the market definition
- 4.2 Market segment analysis
- 4.4 Market outlook: Forecast for 2024-2029
- Chart on Global - Market size and forecast 2024-2029 ($ million)
- Data Table on Global - Market size and forecast 2024-2029 ($ million)
- Chart on Global Market: Year-over-year growth 2024-2029 (%)
- Data Table on Global Market: Year-over-year growth 2024-2029 (%)
5 Historic Market Size
- 5.1 Global Gastric Cancer Drugs Market 2019 - 2023
- Historic Market Size - Data Table on Global Gastric Cancer Drugs Market 2019 - 2023 ($ million)
- 5.2 Route of Administration segment analysis 2019 - 2023
- Historic Market Size - Route of Administration Segment 2019 - 2023 ($ million)
- 5.3 Distribution Channel segment analysis 2019 - 2023
- Historic Market Size - Distribution Channel Segment 2019 - 2023 ($ million)
- 5.4 Drug Class segment analysis 2019 - 2023
- Historic Market Size - Drug Class Segment 2019 - 2023 ($ million)
- 5.5 Geography segment analysis 2019 - 2023
- Historic Market Size - Geography Segment 2019 - 2023 ($ million)
- 5.6 Country segment analysis 2019 - 2023
- Historic Market Size - Country Segment 2019 - 2023 ($ million)
6 Qualitative Analysis
- 6.1 Impact of AI on Global Gastric Cancer Drugs Market
7 Five Forces Analysis
- 7.1 Five forces summary
- Five forces analysis - Comparison between 2024 and 2029
- 7.2 Bargaining power of buyers
- Bargaining power of buyers - Impact of key factors 2024 and 2029
- 7.3 Bargaining power of suppliers
- Bargaining power of suppliers - Impact of key factors in 2024 and 2029
- 7.4 Threat of new entrants
- Threat of new entrants - Impact of key factors in 2024 and 2029
- 7.5 Threat of substitutes
- Threat of substitutes - Impact of key factors in 2024 and 2029
- 7.6 Threat of rivalry
- Threat of rivalry - Impact of key factors in 2024 and 2029
- 7.7 Market condition
- Chart on Market condition - Five forces 2024 and 2029
8 Market Segmentation by Route Of Administration
- 8.1 Market segments
- Chart on Route Of Administration - Market share (2024-2029) (%)
- Data Table on Route Of Administration - Market share (2024-2029) (%)
- 8.2 Comparison by Route Of Administration
- Chart on Comparison by Route Of Administration
- Data Table on Comparison by Route Of Administration
- 8.3 Injectable - Market size and forecast (2024-2029)
- Chart on Injectable - Market size and forecast (2024-2029) ($ million)
- Data Table on Injectable - Market size and forecast (2024-2029) ($ million)
- Chart on Injectable - Year-over-year growth (2024-2029) (%)
- Data Table on Injectable - Year-over-year growth (2024-2029) (%)
- 8.4 Oral - Market size and forecast (2024-2029)
- Chart on Oral - Market size and forecast (2024-2029) ($ million)
- Data Table on Oral - Market size and forecast (2024-2029) ($ million)
- Chart on Oral - Year-over-year growth (2024-2029) (%)
- Data Table on Oral - Year-over-year growth (2024-2029) (%)
- 8.5 Market opportunity by Route Of Administration
- Market opportunity by Route Of Administration ($ million)
- Data Table on Market opportunity by Route Of Administration ($ million)
9 Market Segmentation by Distribution Channel
- 9.1 Market segments
- Chart on Distribution Channel - Market share (2024-2029) (%)
- Data Table on Distribution Channel - Market share (2024-2029) (%)
- 9.2 Comparison by Distribution Channel
- Chart on Comparison by Distribution Channel
- Data Table on Comparison by Distribution Channel
- 9.3 Offline - Market size and forecast (2024-2029)
- Chart on Offline - Market size and forecast (2024-2029) ($ million)
- Data Table on Offline - Market size and forecast (2024-2029) ($ million)
- Chart on Offline - Year-over-year growth (2024-2029) (%)
- Data Table on Offline - Year-over-year growth (2024-2029) (%)
- 9.4 Online - Market size and forecast (2024-2029)
- Chart on Online - Market size and forecast (2024-2029) ($ million)
- Data Table on Online - Market size and forecast (2024-2029) ($ million)
- Chart on Online - Year-over-year growth (2024-2029) (%)
- Data Table on Online - Year-over-year growth (2024-2029) (%)
- 9.5 Market opportunity by Distribution Channel
- Market opportunity by Distribution Channel ($ million)
- Data Table on Market opportunity by Distribution Channel ($ million)
10 Market Segmentation by Drug Class
- 10.1 Market segments
- Chart on Drug Class - Market share (2024-2029) (%)
- Data Table on Drug Class - Market share (2024-2029) (%)
- 10.2 Comparison by Drug Class
- Chart on Comparison by Drug Class
- Data Table on Comparison by Drug Class
- 10.3 Chemotherapy drugs - Market size and forecast (2024-2029)
- Chart on Chemotherapy drugs - Market size and forecast (2024-2029) ($ million)
- Data Table on Chemotherapy drugs - Market size and forecast (2024-2029) ($ million)
- Chart on Chemotherapy drugs - Year-over-year growth (2024-2029) (%)
- Data Table on Chemotherapy drugs - Year-over-year growth (2024-2029) (%)
- 10.4 Targeted therapy drugs - Market size and forecast (2024-2029)
- Chart on Targeted therapy drugs - Market size and forecast (2024-2029) ($ million)
- Data Table on Targeted therapy drugs - Market size and forecast (2024-2029) ($ million)
- Chart on Targeted therapy drugs - Year-over-year growth (2024-2029) (%)
- Data Table on Targeted therapy drugs - Year-over-year growth (2024-2029) (%)
- 10.5 Immunotherapy drugs - Market size and forecast (2024-2029)
- Chart on Immunotherapy drugs - Market size and forecast (2024-2029) ($ million)
- Data Table on Immunotherapy drugs - Market size and forecast (2024-2029) ($ million)
- Chart on Immunotherapy drugs - Year-over-year growth (2024-2029) (%)
- Data Table on Immunotherapy drugs - Year-over-year growth (2024-2029) (%)
- 10.6 Hormonal therapy - Market size and forecast (2024-2029)
- Chart on Hormonal therapy - Market size and forecast (2024-2029) ($ million)
- Data Table on Hormonal therapy - Market size and forecast (2024-2029) ($ million)
- Chart on Hormonal therapy - Year-over-year growth (2024-2029) (%)
- Data Table on Hormonal therapy - Year-over-year growth (2024-2029) (%)
- 10.7 Market opportunity by Drug Class
- Market opportunity by Drug Class ($ million)
- Data Table on Market opportunity by Drug Class ($ million)
11 Market Segmentation by Line of Therapy
- 11.1 Market segments
- Chart on Line of Therapy - Market share (2024-2029) (%)
- Data Table on Line of Therapy - Market share (2024-2029) (%)
- 11.2 Comparison by Line of Therapy
- Chart on Comparison by Line of Therapy
- Data Table on Comparison by Line of Therapy
- 11.3 First-Line - Market size and forecast (2024-2029)
- Chart on First-Line - Market size and forecast (2024-2029) ($ million)
- Data Table on First-Line - Market size and forecast (2024-2029) ($ million)
- Chart on First-Line - Year-over-year growth (2024-2029) (%)
- Data Table on First-Line - Year-over-year growth (2024-2029) (%)
- 11.4 Second-Line - Market size and forecast (2024-2029)
- Chart on Second-Line - Market size and forecast (2024-2029) ($ million)
- Data Table on Second-Line - Market size and forecast (2024-2029) ($ million)
- Chart on Second-Line - Year-over-year growth (2024-2029) (%)
- Data Table on Second-Line - Year-over-year growth (2024-2029) (%)
- 11.5 Third-Line & Beyond - Market size and forecast (2024-2029)
- Chart on Third-Line & Beyond - Market size and forecast (2024-2029) ($ million)
- Data Table on Third-Line & Beyond - Market size and forecast (2024-2029) ($ million)
- Chart on Third-Line & Beyond - Year-over-year growth (2024-2029) (%)
- Data Table on Third-Line & Beyond - Year-over-year growth (2024-2029) (%)
- 11.6 Market opportunity by Line of Therapy
- Market opportunity by Line of Therapy ($ million)
- Data Table on Market opportunity by Line of Therapy ($ million)
12 Market Segmentation by Diagnosis Type
- 12.1 Market segments
- Chart on Diagnosis Type - Market share (2024-2029) (%)
- Data Table on Diagnosis Type - Market share (2024-2029) (%)
- 12.2 Comparison by Diagnosis Type
- Chart on Comparison by Diagnosis Type
- Data Table on Comparison by Diagnosis Type
- 12.3 Adenocarcinoma - Market size and forecast (2024-2029)
- Chart on Adenocarcinoma - Market size and forecast (2024-2029) ($ million)
- Data Table on Adenocarcinoma - Market size and forecast (2024-2029) ($ million)
- Chart on Adenocarcinoma - Year-over-year growth (2024-2029) (%)
- Data Table on Adenocarcinoma - Year-over-year growth (2024-2029) (%)
- 12.4 Lymphoma - Market size and forecast (2024-2029)
- Chart on Lymphoma - Market size and forecast (2024-2029) ($ million)
- Data Table on Lymphoma - Market size and forecast (2024-2029) ($ million)
- Chart on Lymphoma - Year-over-year growth (2024-2029) (%)
- Data Table on Lymphoma - Year-over-year growth (2024-2029) (%)
- 12.5 Gastrointestinal Stromal Tumor (GIST) - Market size and forecast (2024-2029)
- Chart on Gastrointestinal Stromal Tumor (GIST) - Market size and forecast (2024-2029) ($ million)
- Data Table on Gastrointestinal Stromal Tumor (GIST) - Market size and forecast (2024-2029) ($ million)
- Chart on Gastrointestinal Stromal Tumor (GIST) - Year-over-year growth (2024-2029) (%)
- Data Table on Gastrointestinal Stromal Tumor (GIST) - Year-over-year growth (2024-2029) (%)
- 12.6 Carcinoid Tumor - Market size and forecast (2024-2029)
- Chart on Carcinoid Tumor - Market size and forecast (2024-2029) ($ million)
- Data Table on Carcinoid Tumor - Market size and forecast (2024-2029) ($ million)
- Chart on Carcinoid Tumor - Year-over-year growth (2024-2029) (%)
- Data Table on Carcinoid Tumor - Year-over-year growth (2024-2029) (%)
- 12.7 Others - Market size and forecast (2024-2029)
- Chart on Others - Market size and forecast (2024-2029) ($ million)
- Data Table on Others - Market size and forecast (2024-2029) ($ million)
- Chart on Others - Year-over-year growth (2024-2029) (%)
- Data Table on Others - Year-over-year growth (2024-2029) (%)
- 12.8 Market opportunity by Diagnosis Type
- Market opportunity by Diagnosis Type ($ million)
- Data Table on Market opportunity by Diagnosis Type ($ million)
13 Market Segmentation by End-User
- 13.1 Market segments
- Chart on End-User - Market share (2024-2029) (%)
- Data Table on End-User - Market share (2024-2029) (%)
- 13.2 Comparison by End-User
- Chart on Comparison by End-User
- Data Table on Comparison by End-User
- 13.3 Hospitals - Market size and forecast (2024-2029)
- Chart on Hospitals - Market size and forecast (2024-2029) ($ million)
- Data Table on Hospitals - Market size and forecast (2024-2029) ($ million)
- Chart on Hospitals - Year-over-year growth (2024-2029) (%)
- Data Table on Hospitals - Year-over-year growth (2024-2029) (%)
- 13.4 Specialty Centers - Market size and forecast (2024-2029)
- Chart on Specialty Centers - Market size and forecast (2024-2029) ($ million)
- Data Table on Specialty Centers - Market size and forecast (2024-2029) ($ million)
- Chart on Specialty Centers - Year-over-year growth (2024-2029) (%)
- Data Table on Specialty Centers - Year-over-year growth (2024-2029) (%)
- 13.5 Cancer Research Institutes - Market size and forecast (2024-2029)
- Chart on Cancer Research Institutes - Market size and forecast (2024-2029) ($ million)
- Data Table on Cancer Research Institutes - Market size and forecast (2024-2029) ($ million)
- Chart on Cancer Research Institutes - Year-over-year growth (2024-2029) (%)
- Data Table on Cancer Research Institutes - Year-over-year growth (2024-2029) (%)
- 13.6 Homecare - Market size and forecast (2024-2029)
- Chart on Homecare - Market size and forecast (2024-2029) ($ million)
- Data Table on Homecare - Market size and forecast (2024-2029) ($ million)
- Chart on Homecare - Year-over-year growth (2024-2029) (%)
- Data Table on Homecare - Year-over-year growth (2024-2029) (%)
- 13.7 Market opportunity by End-User
- Market opportunity by End-User ($ million)
- Data Table on Market opportunity by End-User ($ million)
14 Customer Landscape
- 14.1 Customer landscape overview
- Analysis of price sensitivity, lifecycle, customer purchase basket, adoption rates, and purchase criteria
15 Geographic Landscape
- 15.1 Geographic segmentation
- Chart on Market share by geography 2024-2029 (%)
- Data Table on Market share by geography 2024-2029 (%)
- 15.2 Geographic comparison
- Chart on Geographic comparison
- Data Table on Geographic comparison
- 15.3 North America - Market size and forecast 2024-2029
- Chart on North America - Market size and forecast 2024-2029 ($ million)
- Data Table on North America - Market size and forecast 2024-2029 ($ million)
- Chart on North America - Year-over-year growth 2024-2029 (%)
- Data Table on North America - Year-over-year growth 2024-2029 (%)
- 15.4 Europe - Market size and forecast 2024-2029
- Chart on Europe - Market size and forecast 2024-2029 ($ million)
- Data Table on Europe - Market size and forecast 2024-2029 ($ million)
- Chart on Europe - Year-over-year growth 2024-2029 (%)
- Data Table on Europe - Year-over-year growth 2024-2029 (%)
- 15.5 Asia - Market size and forecast 2024-2029
- Chart on Asia - Market size and forecast 2024-2029 ($ million)
- Data Table on Asia - Market size and forecast 2024-2029 ($ million)
- Chart on Asia - Year-over-year growth 2024-2029 (%)
- Data Table on Asia - Year-over-year growth 2024-2029 (%)
- 15.6 Rest of World (ROW) - Market size and forecast 2024-2029
- Chart on Rest of World (ROW) - Market size and forecast 2024-2029 ($ million)
- Data Table on Rest of World (ROW) - Market size and forecast 2024-2029 ($ million)
- Chart on Rest of World (ROW) - Year-over-year growth 2024-2029 (%)
- Data Table on Rest of World (ROW) - Year-over-year growth 2024-2029 (%)
- 15.7 US - Market size and forecast 2024-2029
- Chart on US - Market size and forecast 2024-2029 ($ million)
- Data Table on US - Market size and forecast 2024-2029 ($ million)
- Chart on US - Year-over-year growth 2024-2029 (%)
- Data Table on US - Year-over-year growth 2024-2029 (%)
- 15.8 Germany - Market size and forecast 2024-2029
- Chart on Germany - Market size and forecast 2024-2029 ($ million)
- Data Table on Germany - Market size and forecast 2024-2029 ($ million)
- Chart on Germany - Year-over-year growth 2024-2029 (%)
- Data Table on Germany - Year-over-year growth 2024-2029 (%)
- 15.9 Canada - Market size and forecast 2024-2029
- Chart on Canada - Market size and forecast 2024-2029 ($ million)
- Data Table on Canada - Market size and forecast 2024-2029 ($ million)
- Chart on Canada - Year-over-year growth 2024-2029 (%)
- Data Table on Canada - Year-over-year growth 2024-2029 (%)
- 15.10 China - Market size and forecast 2024-2029
- Chart on China - Market size and forecast 2024-2029 ($ million)
- Data Table on China - Market size and forecast 2024-2029 ($ million)
- Chart on China - Year-over-year growth 2024-2029 (%)
- Data Table on China - Year-over-year growth 2024-2029 (%)
- 15.11 Japan - Market size and forecast 2024-2029
- Chart on Japan - Market size and forecast 2024-2029 ($ million)
- Data Table on Japan - Market size and forecast 2024-2029 ($ million)
- Chart on Japan - Year-over-year growth 2024-2029 (%)
- Data Table on Japan - Year-over-year growth 2024-2029 (%)
- 15.12 France - Market size and forecast 2024-2029
- Chart on France - Market size and forecast 2024-2029 ($ million)
- Data Table on France - Market size and forecast 2024-2029 ($ million)
- Chart on France - Year-over-year growth 2024-2029 (%)
- Data Table on France - Year-over-year growth 2024-2029 (%)
- 15.13 UK - Market size and forecast 2024-2029
- Chart on UK - Market size and forecast 2024-2029 ($ million)
- Data Table on UK - Market size and forecast 2024-2029 ($ million)
- Chart on UK - Year-over-year growth 2024-2029 (%)
- Data Table on UK - Year-over-year growth 2024-2029 (%)
- 15.14 Mexico - Market size and forecast 2024-2029
- Chart on Mexico - Market size and forecast 2024-2029 ($ million)
- Data Table on Mexico - Market size and forecast 2024-2029 ($ million)
- Chart on Mexico - Year-over-year growth 2024-2029 (%)
- Data Table on Mexico - Year-over-year growth 2024-2029 (%)
- 15.15 India - Market size and forecast 2024-2029
- Chart on India - Market size and forecast 2024-2029 ($ million)
- Data Table on India - Market size and forecast 2024-2029 ($ million)
- Chart on India - Year-over-year growth 2024-2029 (%)
- Data Table on India - Year-over-year growth 2024-2029 (%)
- 15.16 Spain - Market size and forecast 2024-2029
- Chart on Spain - Market size and forecast 2024-2029 ($ million)
- Data Table on Spain - Market size and forecast 2024-2029 ($ million)
- Chart on Spain - Year-over-year growth 2024-2029 (%)
- Data Table on Spain - Year-over-year growth 2024-2029 (%)
- 15.17 Market opportunity by geography
- Market opportunity by geography ($ million)
- Data Tables on Market opportunity by geography ($ million)
- 15.18 Italy - Market size and forecast (2024-2029)
- Chart on Italy - Market size and forecast (2024-2029) ($ million)
- Data Table on Italy - Market size and forecast (2024-2029) ($ million)
- Chart on Italy - Year-over-year growth (2024-2029) (%)
- Data Table on Italy - Year-over-year growth (2024-2029) (%)
- 15.19 Brazil - Market size and forecast (2024-2029)
- Chart on Brazil - Market size and forecast (2024-2029) ($ million)
- Data Table on Brazil - Market size and forecast (2024-2029) ($ million)
- Chart on Brazil - Year-over-year growth (2024-2029) (%)
- Data Table on Brazil - Year-over-year growth (2024-2029) (%)
- 15.20 Egypt - Market size and forecast (2024-2029)
- Chart on Egypt - Market size and forecast (2024-2029) ($ million)
- Data Table on Egypt - Market size and forecast (2024-2029) ($ million)
- Chart on Egypt - Year-over-year growth (2024-2029) (%)
- Data Table on Egypt - Year-over-year growth (2024-2029) (%)
- 15.21 UAE - Market size and forecast (2024-2029)
- Chart on UAE - Market size and forecast (2024-2029) ($ million)
- Data Table on UAE - Market size and forecast (2024-2029) ($ million)
- Chart on UAE - Year-over-year growth (2024-2029) (%)
- Data Table on UAE - Year-over-year growth (2024-2029) (%)
- 15.22 Oman - Market size and forecast (2024-2029)
- Chart on Oman - Market size and forecast (2024-2029) ($ million)
- Data Table on Oman - Market size and forecast (2024-2029) ($ million)
- Chart on Oman - Year-over-year growth (2024-2029) (%)
- Data Table on Oman - Year-over-year growth (2024-2029) (%)
- 15.23 Argentina - Market size and forecast (2024-2029)
- Chart on Argentina - Market size and forecast (2024-2029) ($ million)
- Data Table on Argentina - Market size and forecast (2024-2029) ($ million)
- Chart on Argentina - Year-over-year growth (2024-2029) (%)
- Data Table on Argentina - Year-over-year growth (2024-2029) (%)
- 15.24 KSA - Market size and forecast (2024-2029)
- Chart on KSA - Market size and forecast (2024-2029) ($ million)
- Data Table on KSA - Market size and forecast (2024-2029) ($ million)
- Chart on KSA - Year-over-year growth (2024-2029) (%)
- Data Table on KSA - Year-over-year growth (2024-2029) (%)
16 Drivers, Challenges, and Opportunity/Restraints
- 16.3 Impact of drivers and challenges
- Impact of drivers and challenges in 2024 and 2029
- 16.4 Market opportunities/restraints
17 Competitive Landscape
- 17.2 Competitive Landscape
- Overview on criticality of inputs and factors of differentiation
- 17.3 Landscape disruption
- Overview on factors of disruption
- 17.4 Industry risks
- Impact of key risks on business
18 Competitive Analysis
- 18.2 Company ranking index
- 18.3 Market positioning of companies
- Matrix on companies position and classification
- 18.4 Amgen Inc.
- Amgen Inc. - Overview
- Amgen Inc. - Product / Service
- Amgen Inc. - Key news
- Amgen Inc. - Key offerings
- SWOT
- 18.5 AstraZeneca Plc
- AstraZeneca Plc - Overview
- AstraZeneca Plc - Product / Service
- AstraZeneca Plc - Key news
- AstraZeneca Plc - Key offerings
- SWOT
- 18.6 Biocon Ltd.
- Biocon Ltd. - Overview
- Biocon Ltd. - Business segments
- Biocon Ltd. - Key offerings
- Biocon Ltd. - Segment focus
- SWOT
- 18.7 Boehringer Ingelheim International GmbH
- Boehringer Ingelheim International GmbH - Overview
- Boehringer Ingelheim International GmbH - Product / Service
- Boehringer Ingelheim International GmbH - Key news
- Boehringer Ingelheim International GmbH - Key offerings
- SWOT
- 18.8 Bristol Myers Squibb Co.
- Bristol Myers Squibb Co. - Overview
- Bristol Myers Squibb Co. - Product / Service
- Bristol Myers Squibb Co. - Key news
- Bristol Myers Squibb Co. - Key offerings
- SWOT
- 18.9 Celltrion Co. Ltd.
- Celltrion Co. Ltd. - Overview
- Celltrion Co. Ltd. - Product / Service
- Celltrion Co. Ltd. - Key offerings
- SWOT
- 18.10 Dr Reddys Laboratories Ltd.
- Dr Reddys Laboratories Ltd. - Overview
- Dr Reddys Laboratories Ltd. - Business segments
- Dr Reddys Laboratories Ltd. - Key news
- Dr Reddys Laboratories Ltd. - Key offerings
- Dr Reddys Laboratories Ltd. - Segment focus
- SWOT
- 18.11 Eisai Co. Ltd.
- Eisai Co. Ltd. - Overview
- Eisai Co. Ltd. - Business segments
- Eisai Co. Ltd. - Key offerings
- Eisai Co. Ltd. - Segment focus
- SWOT
- 18.12 Eli Lilly and Co.
- Eli Lilly and Co. - Overview
- Eli Lilly and Co. - Product / Service
- Eli Lilly and Co. - Key offerings
- SWOT
- 18.13 F. Hoffmann La Roche Ltd.
- F. Hoffmann La Roche Ltd. - Overview
- F. Hoffmann La Roche Ltd. - Business segments
- F. Hoffmann La Roche Ltd. - Key news
- F. Hoffmann La Roche Ltd. - Key offerings
- F. Hoffmann La Roche Ltd. - Segment focus
- SWOT
- 18.14 Merck KGaA
- Merck KGaA - Overview
- Merck KGaA - Business segments
- Merck KGaA - Key news
- Merck KGaA - Key offerings
- Merck KGaA - Segment focus
- SWOT
- 18.15 Novartis AG
- Novartis AG - Overview
- Novartis AG - Business segments
- Novartis AG - Key news
- Novartis AG - Key offerings
- Novartis AG - Segment focus
- SWOT
- 18.16 Pfizer Inc.
- Pfizer Inc. - Overview
- Pfizer Inc. - Product / Service
- Pfizer Inc. - Key news
- Pfizer Inc. - Key offerings
- SWOT
- 18.17 Sanofi SA
- Sanofi SA - Overview
- Sanofi SA - Business segments
- Sanofi SA - Key news
- Sanofi SA - Key offerings
- Sanofi SA - Segment focus
- SWOT
- 18.18 Zydus Lifesciences Ltd.
- Zydus Lifesciences Ltd. - Overview
- Zydus Lifesciences Ltd. - Business segments
- Zydus Lifesciences Ltd. - Key news
- Zydus Lifesciences Ltd. - Key offerings
- Zydus Lifesciences Ltd. - Segment focus
- SWOT
19 Appendix
- 19.2 Inclusions and exclusions checklist
- Inclusions checklist
- Exclusions checklist
- 19.3 Currency conversion rates for US$
- Currency conversion rates for US$
- 19.4 Research methodology
- 19.7 Validation techniques employed for market sizing
- Validation techniques employed for market sizing
- 19.9 360 degree market analysis
- 360 degree market analysis
- 19.10 List of abbreviations