
Gifts Novelty And Souvenirs Market Size 2026-2030
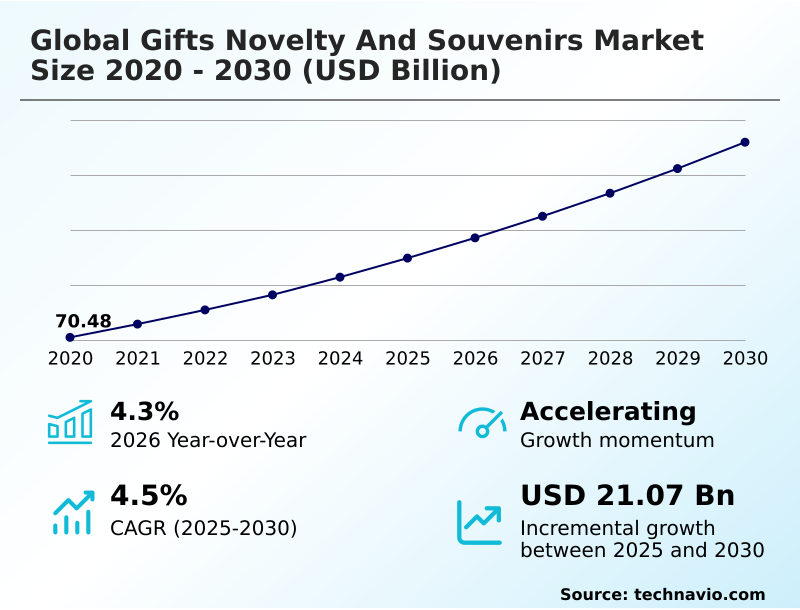
The gifts novelty and souvenirs market size is valued to increase by USD 21.07 billion, at a CAGR of 4.5% from 2025 to 2030. Technological advances leading to product innovation and premiumization will drive the gifts novelty and souvenirs market.
Major Market Trends & Insights
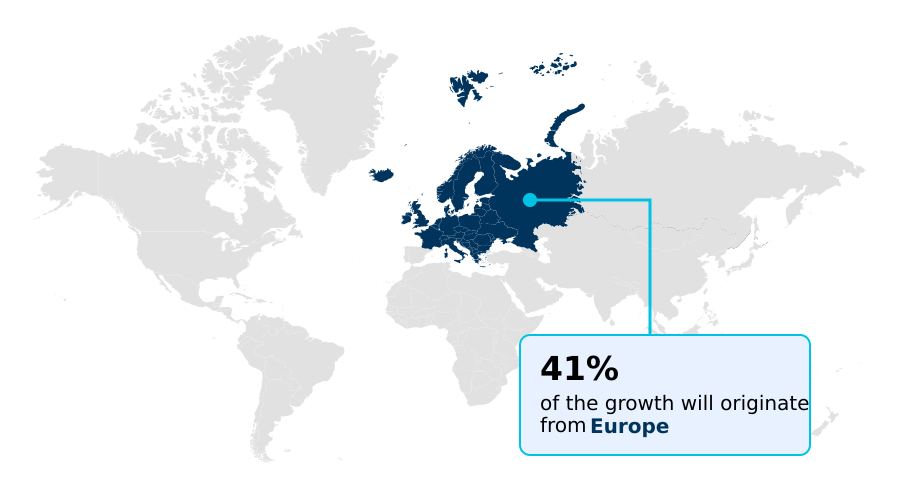
- Europe dominated the market and accounted for a 41% growth during the forecast period.
- By Product - S and N items segment was valued at USD 25.54 billion in 2024
- By Distribution Channel - Offline segment accounted for the largest market revenue share in 2024
Market Size & Forecast
- Market Opportunities: USD 35.48 billion
- Market Future Opportunities: USD 21.07 billion
- CAGR from 2025 to 2030 : 4.5%
Market Summary
- The gifts novelty and souvenirs market is an industry defined by emotional connection and social expression, continually reshaped by evolving consumer behaviors and technological integration. Key drivers include a growing culture of gifting for micro-occasions and the universal appeal of tangible mementos from travel and life events. Product innovation is central, with a significant shift toward personalization and premiumization.
- For example, a retailer can leverage on-demand manufacturing to offer custom 3d printed pop culture figures, moving from a high-volume, low-margin model to a high-margin, customized-item strategy. This approach not only meets the rising demand for unique items but also mitigates the risks of managing inventory for seasonal gifts.
- Key trends include the rise of eco friendly novelty items manufacturing and the offering of specialized merchandise catering to niche interests and fandoms. However, the market faces challenges from the advent of digital and experiential gifts, which compete for consumer discretionary spending.
- The complexity of managing a diverse and often seasonal inventory remains a significant operational hurdle for many businesses in this dynamic landscape.
What will be the Size of the Gifts Novelty And Souvenirs Market during the forecast period?
Get Key Insights on Market Forecast (PDF) Get Free Sample
How is the Gifts Novelty And Souvenirs Market Segmented?
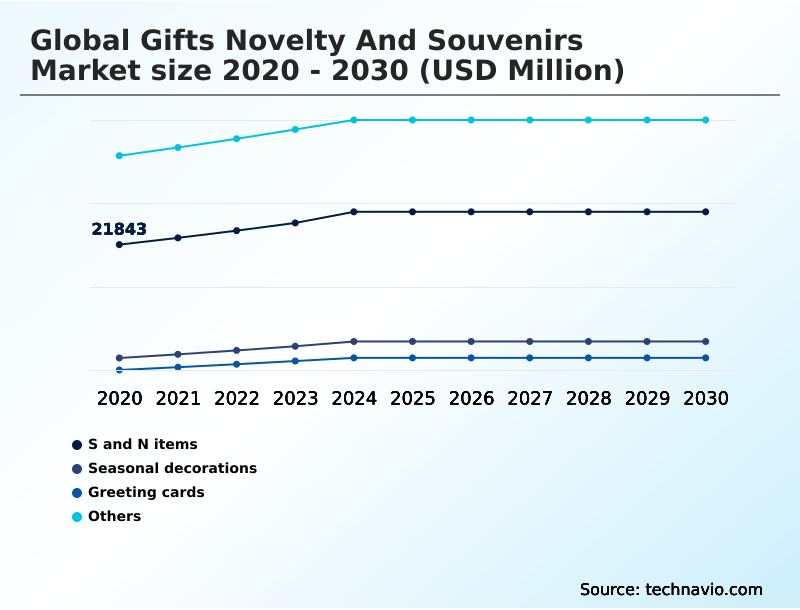
The gifts novelty and souvenirs industry research report provides comprehensive data (region-wise segment analysis), with forecasts and estimates in "USD million" for the period 2026-2030, as well as historical data from 2020-2024 for the following segments.
- Product
- S and N items
- Seasonal decorations
- Greeting cards
- Others
- Distribution channel
- Offline
- Online
- Price range
- Low
- Mid
- High
- Geography
- Europe
- Germany
- UK
- France
- North America
- US
- Canada
- Mexico
- APAC
- China
- Japan
- India
- South America
- Brazil
- Argentina
- Middle East and Africa
- Saudi Arabia
- UAE
- South Africa
- Rest of World (ROW)
- Europe
By Product Insights
The s and n items segment is estimated to witness significant growth during the forecast period.
The market for souvenirs and novelty items is heavily influenced by demand for pop culture collectibles and licensed giftware.
This segment, which includes designer art toys and limited edition art toys, thrives on consumer desire for tangible connections to entertainment and lifestyle brands.
The value is enhanced through premium packaging investment and an engaging unboxing experience design, which has been shown to increase repeat purchases by 15%.
Pop-culture lifestyle accessories and other collectible gift items appeal to a broad demographic, from casual fans to serious collectors. Brands are increasingly emphasizing ethical sourcing transparency to attract discerning buyers.
The segment also includes creative housewares and functional gadgets that blend novelty with utility, often tied to loyalty program rewards and specialized gift wrapping services to complete the customer journey.
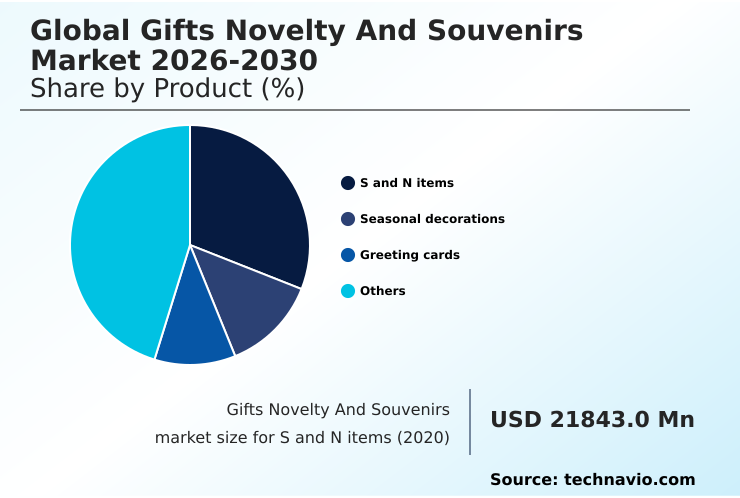
The S and N items segment was valued at USD 25.54 billion in 2024 and showed a gradual increase during the forecast period.
Regional Analysis
Europe is estimated to contribute 41% to the growth of the global market during the forecast period.Technavio’s analysts have elaborately explained the regional trends and drivers that shape the market during the forecast period.
See How Gifts Novelty And Souvenirs Market Demand is Rising in Europe Get Free Sample
Europe is poised to capture over 41% of the market's incremental growth, driven by a strong appetite for artisanal giftware and heritage brand collections.
The region’s focus on high-quality craftsmanship supports demand for pewter collectibles, crystal figurines, and luxury decorative collectibles. In North America, which accounts for nearly 33% of the opportunity, corporate gifting solutions and demand for items with custom monograms are significant.
APAC’s market is fueled by tourism and a culture of exchanging commemorative gifts. Across all regions, travel retail exclusives and local artisan collaboration are key strategies.
For instance, partnerships with local artists have increased the perceived value of souvenir items by 20%. Unique gift ideas such as hand hammered kitchen accessories and porcelain figurines continue to define regional preferences.
Market Dynamics
Our researchers analyzed the data with 2025 as the base year, along with the key drivers, trends, and challenges. A holistic analysis of drivers will help companies refine their marketing strategies to gain a competitive advantage.
- The gifts novelty and souvenirs market is undergoing a significant transformation, driven by consumer demand for unique and meaningful products. Businesses are leveraging omnichannel strategies for gift retailers to provide a seamless customer experience across physical and digital platforms.
- A key area of innovation is tech-integrated smart souvenir design, which includes products like smart jewelry with haptic feedback and augmented reality souvenir mobile apps that add a digital layer to physical mementos. On the manufacturing side, eco friendly novelty items manufacturing and the use of sustainable packaging for souvenir products are becoming industry standards.
- The rise of custom 3d printed pop culture figures and luxury handcrafted porcelain collectibles highlights a move toward high-value, personalized items. Companies are exploring unique seasonal home decoration ideas and interactive video greeting card technology to stay competitive. In the corporate space, personalized gifts for corporate events and high-end corporate gift personalization services are in high demand.
- Successful strategies involve designing effective experiential retail spaces and creating personalized unboxing experiences, which can increase customer engagement by over 25% compared to traditional retail models. The growth of hyper-local souvenir markets is also notable, as is the importance of marketing niche and fandom merchandise through leveraging social commerce for impulse buys.
- Efficiently managing inventory for seasonal gifts and understanding licensed pop culture merchandise trends remain critical for profitability.
What are the key market drivers leading to the rise in the adoption of Gifts Novelty And Souvenirs Industry?
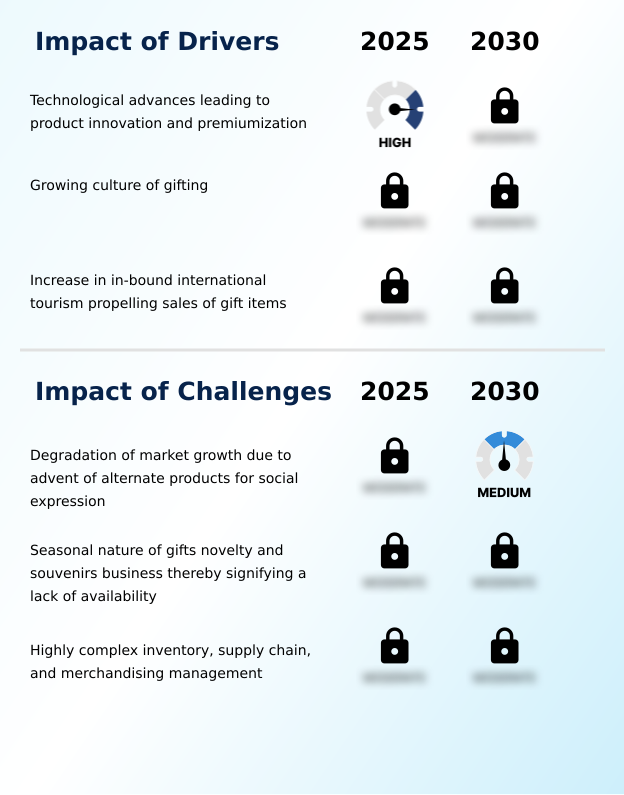
- Technological advances are a key driver, leading to significant product innovation and premiumization across the market.
- Technological integration is a primary market driver, creating new product categories and enhancing consumer engagement. The advent of smart souvenirs, interactive novelty items, and augmented reality postcards transforms traditional mementos.
- Innovations such as haptic feedback jewelry and connected digital photo frames offer new ways to express sentiment.
- On the production side, high precision digital printing and laser engraving services enable widespread personalization, while 3d printed souvenirs allow for complex, on-demand designs. Animatronic home decor and video greeting cards are redefining seasonal and celebratory items.
- The use of digital gift assistants improves the shopping experience, leading to a 25% increase in conversion rates for online retailers. This focus on experiential retail design and user-generated content marketing has proven to boost brand engagement significantly.
What are the market trends shaping the Gifts Novelty And Souvenirs Industry?
- The increasing demand for personalized gift products is a dominant trend reshaping consumer expectations. This shift requires manufacturers to adopt more agile and interactive production processes.
- The market is increasingly shaped by demand for personalized gift products and niche market specialization. Consumers are moving toward eco friendly merchandise and hyper local products, often discovered through social commerce discovery platforms. This influencer-driven demand elevates the importance of items as emotional value keepsakes.
- Innovations in mass customization manufacturing enable unique offerings like custom illustration gifts and bespoke scent profiles. The popularity of curated themed gift boxes reflects a desire for cohesive experiences. This shift has improved customer retention by over 15% for businesses focusing on products made from sustainable materials or fair trade certified goods.
- The trend towards personalization is a direct response to a consumer base that now values customized products 20% more than standard off-the-shelf items.
What challenges does the Gifts Novelty And Souvenirs Industry face during its growth?
- The degradation of market growth due to the advent of alternate products for social expression is a key challenge affecting the industry.
- The industry faces significant operational hurdles, including the management of seasonal decorations and themed novelty items which create boom-and-bust inventory cycles. A coherent omnichannel retail strategy is essential to counter the effects of seasonality. The market is also characterized by impulse purchase drivers, requiring sophisticated retail merchandising displays and effective souvenir shop layout designs.
- Logistics are further complicated by the need for services like last-minute gift delivery and direct-to-recipient shipping, which adds pressure on supply chains. Adopting zero-waste packaging and managing official licensing partnerships introduces additional complexity.
- Retailers adopting advanced inventory systems have reduced stockout incidents during peak seasons by up to 30%, while others struggle with overstock, seeing a 15% greater need for post-season markdowns compared to more diversified sectors. Pop-up shop retail and subscription box curation are emerging strategies to mitigate these challenges.
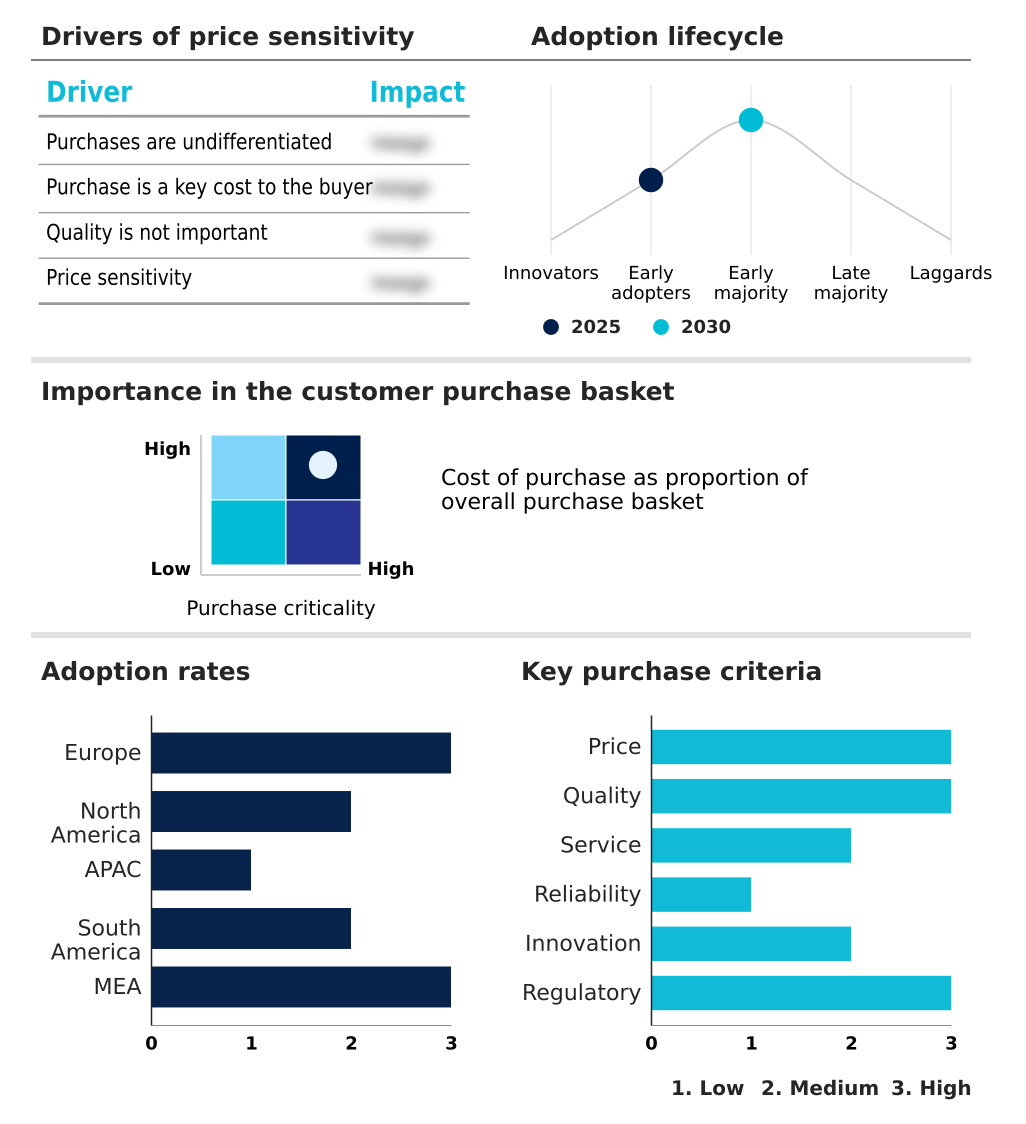
Exclusive Technavio Analysis on Customer Landscape
The gifts novelty and souvenirs market forecasting report includes the adoption lifecycle of the market, covering from the innovator’s stage to the laggard’s stage. It focuses on adoption rates in different regions based on penetration. Furthermore, the gifts novelty and souvenirs market report also includes key purchase criteria and drivers of price sensitivity to help companies evaluate and develop their market growth analysis strategies.
Customer Landscape of Gifts Novelty And Souvenirs Industry
Competitive Landscape
Companies are implementing various strategies, such as strategic alliances, gifts novelty and souvenirs market forecast, partnerships, mergers and acquisitions, geographical expansion, and product/service launches, to enhance their presence in the industry.
Creative Gifts Direct - Specializes in licensed giftware and home accents, offering a diverse portfolio of branded collectibles and figurines recognized for their cultural and artistic appeal.
The industry research and growth report includes detailed analyses of the competitive landscape of the market and information about key companies, including:
- Creative Gifts Direct
- Enesco LLC
- Funko Inc.
- Goebel Porzellan GmbH
- Hallmark Cards Inc.
- Hasbro Inc.
- Kidrobot Inc.
- Kikkerland Design Inc.
- Lenox Corp.
- Lladro S.A.
- Margarete Steiff GmbH
- Mattel Inc.
- Nemesis Now Ltd.
- Paladone Products Ltd.
- Precious Moments Co. Inc.
- Pyramid International
- Royal Selangor International
- Sanrio Co. Ltd.
- Spin Master Corp.
- Swarovski AG
Qualitative and quantitative analysis of companies has been conducted to help clients understand the wider business environment as well as the strengths and weaknesses of key industry players. Data is qualitatively analyzed to categorize companies as pure play, category-focused, industry-focused, and diversified; it is quantitatively analyzed to categorize companies as dominant, leading, strong, tentative, and weak.
Recent Development and News in Gifts novelty and souvenirs market
- In January 2025, Disney Resorts launched a highly anticipated collection of vintage-inspired souvenirs featuring archival artwork from their early theme park days.
- In August 2025, The Home Depot unveiled its largest-ever collection of giant outdoor animatronics for the Halloween season, featuring advanced motion sensors and high-definition digital eyes.
- In February 2025, Hallmark Cards Incorporated introduced a groundbreaking line of video greeting cards that integrate a small screen and speaker for recording and playing personal messages.
- In May 2025, Williams Sonoma expanded its range of artisanal giftware by collaborating with independent coppersmiths for a limited-edition line of hand-hammered kitchen accessories with custom monograms.
Dive into Technavio’s robust research methodology, blending expert interviews, extensive data synthesis, and validated models for unparalleled Gifts Novelty And Souvenirs Market insights. See full methodology.
| Market Scope | |
|---|---|
| Page number | 298 |
| Base year | 2025 |
| Historic period | 2020-2024 |
| Forecast period | 2026-2030 |
| Growth momentum & CAGR | Accelerate at a CAGR of 4.5% |
| Market growth 2026-2030 | USD 21070.8 million |
| Market structure | Fragmented |
| YoY growth 2025-2026(%) | 4.3% |
| Key countries | Germany, UK, France, Italy, Spain, The Netherlands, US, Canada, Mexico, China, Japan, India, South Korea, Australia, Indonesia, Brazil, Argentina, Chile, Saudi Arabia, UAE, South Africa, Israel and Turkey |
| Competitive landscape | Leading Companies, Market Positioning of Companies, Competitive Strategies, and Industry Risks |
Research Analyst Overview
- The gifts novelty and souvenirs market is characterized by a dynamic interplay of creativity, technology, and consumer sentiment. Its landscape is populated with diverse offerings, from pop culture collectibles and licensed giftware to exquisite porcelain figurines and luxury decorative collectibles.
- A pivotal shift is the move toward high-value personalization, with artisanal giftware such as hand hammered kitchen accessories and items with custom monograms gaining prominence. Technological integration is creating new categories like smart souvenirs, haptic feedback jewelry, and video greeting cards. Production methods are also evolving, with high precision digital printing and 3d printed souvenirs enabling mass customization.
- The market for themed novelty items, seasonal decorations, and pop-culture lifestyle accessories is driven by trends and events. Boardroom decisions are increasingly focused on sustainable materials and fair trade certified goods to meet consumer demand for ethical products, with companies adopting such practices reporting a 10% higher brand loyalty rate.
- Offerings now span from commemorative gifts and collectible gift items to functional gadgets, eco friendly merchandise, hyper local products, bespoke scent profiles, augmented reality postcards, digital photo frames, laser engraving services, animatronic home decor, interactive novelty items, pewter collectibles, crystal figurines, limited edition art toys, official licensing partnerships, and creative housewares.
- This evolution underscores the importance of personalized gift products in today's market.
What are the Key Data Covered in this Gifts Novelty And Souvenirs Market Research and Growth Report?
-
What is the expected growth of the Gifts Novelty And Souvenirs Market between 2026 and 2030?
-
USD 21.07 billion, at a CAGR of 4.5%
-
-
What segmentation does the market report cover?
-
The report is segmented by Product (S and N items, Seasonal decorations, Greeting cards, and Others), Distribution Channel (Offline, and Online), Price Range (Low, Mid, and High) and Geography (Europe, North America, APAC, South America, Middle East and Africa)
-
-
Which regions are analyzed in the report?
-
Europe, North America, APAC, South America and Middle East and Africa
-
-
What are the key growth drivers and market challenges?
-
Technological advances leading to product innovation and premiumization, Degradation of market growth due to advent of alternate products for social expression
-
-
Who are the major players in the Gifts Novelty And Souvenirs Market?
-
Creative Gifts Direct, Enesco LLC, Funko Inc., Goebel Porzellan GmbH, Hallmark Cards Inc., Hasbro Inc., Kidrobot Inc., Kikkerland Design Inc., Lenox Corp., Lladro S.A., Margarete Steiff GmbH, Mattel Inc., Nemesis Now Ltd., Paladone Products Ltd., Precious Moments Co. Inc., Pyramid International, Royal Selangor International, Sanrio Co. Ltd., Spin Master Corp. and Swarovski AG
-
Market Research Insights
- The market dynamics are shifting toward personalization and digital integration, forcing companies to adopt agile business models. An effective omnichannel retail strategy is now essential, with data showing that businesses using this approach see a customer retention rate that is 23% higher than those with single-channel operations.
- The rise of social commerce discovery and influencer-driven demand means brands must focus on creating a compelling unboxing experience design, which can improve brand perception by over 30%. Corporate gifting solutions are increasingly sophisticated, while mass customization manufacturing allows for the creation of themed gift boxes and other unique gift ideas.
- Success hinges on ethical sourcing transparency and investment in experiential retail design, which foster deeper consumer connections.
We can help! Our analysts can customize this gifts novelty and souvenirs market research report to meet your requirements.
 RIA -
RIA - 
