Agrochemicals Market Size 2025-2029
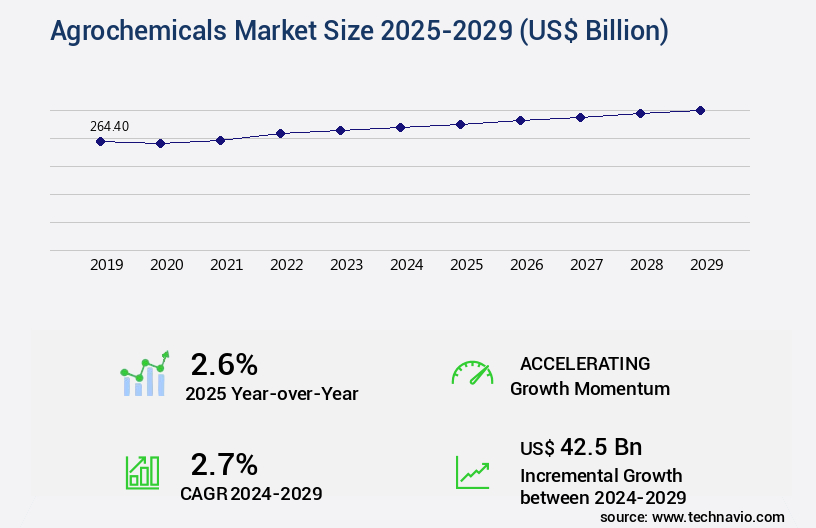
The agrochemicals market size is valued to increase USD 42.5 billion, at a CAGR of 2.7% from 2024 to 2029. Increasing use of herbicides will drive the agrochemicals market.
Major Market Trends & Insights
- APAC dominated the market and accounted for a 44% growth during the forecast period.
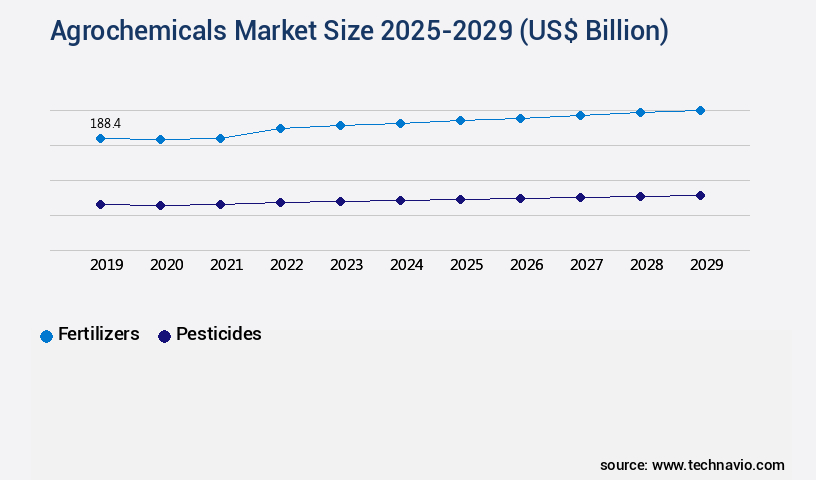
- By Product - Fertilizers segment was valued at USD 188.40 billion in 2023
- By Application - Cereals and grains segment accounted for the largest market revenue share in 2023
Market Size & Forecast
- Market Opportunities: USD 28.97 billion
- Market Future Opportunities: USD 42.50 billion
- CAGR : 2.7%
- APAC: Largest market in 2023
Market Summary
- The market encompasses a dynamic and continually evolving landscape, driven by advancements in core technologies and applications. Herbicides hold a significant market share, with over 60% of the total agrochemicals consumption, owing to their effectiveness in controlling weeds and enhancing crop yield. The market encompasses a wide range of products, including fertilizers, soil amendments, and crop protection chemicals, that cater to the diverse needs of modern agriculture. However, the implementation of Integrated Pest Management (IPM) as a new method of crop protection poses a challenge, as it encourages the reduction of agrochemical usage. The market also faces competition from alternative methods, such as organic farming and genetically modified organisms (GMOs).
- Despite these challenges, opportunities abound, including the increasing demand for sustainable agriculture and the development of eco-friendly agrochemicals. The regulatory landscape is another critical factor, with stringent regulations governing the production, distribution, and usage of agrochemicals to ensure safety and environmental sustainability.
What will be the Size of the Agrochemicals Market during the forecast period?
Get Key Insights on Market Forecast (PDF) Request Free Sample
How is the Agrochemicals Market Segmented and what are the key trends of market segmentation?
The agrochemicals industry research report provides comprehensive data (region-wise segment analysis), with forecasts and estimates in "USD billion" for the period 2025-2029, as well as historical data from 2019-2023 for the following segments.
- Product
- Fertilizers
- Pesticides
- Application
- Cereals and grains
- Oilseeds and pulses
- Fruits and vegetables
- Distribution Channel
- Distributors and retailers
- Direct sales
- Online sales
- Geography
- North America
- US
- Canada
- Europe
- Germany
- Middle East and Africa
- South Africa
- APAC
- Australia
- China
- India
- Japan
- South Korea
- South America
- Brazil
- Rest of World (ROW)
- North America
By Product Insights
The fertilizers segment is estimated to witness significant growth during the forecast period.
In the dynamic and evolving the market, nutrient uptake efficiency plays a pivotal role in optimizing crop productivity. Fungicide application timing and precision are crucial for effective weed management. Phosphorus availability and disease resistance mechanisms are essential for enhancing crop resilience. Microbial inoculants and sustainable agriculture practices contribute significantly to improving soil health indicators, such as organic matter content and humic acid fertilizers. The market for agrochemicals is experiencing notable growth, with fertilizer application methods, such as precision agriculture tools and nitrogen fixation rates, gaining traction. The adoption of integrated pest management strategies, including crop stress tolerance and pest control efficacy, is on the rise.
Biomass production and grain filling duration are key yield improvement metrics, while potassium uptake and root development enhancers are essential for maintaining optimal crop health. Moreover, the market for agrochemicals is expected to expand further, with biopesticide formulations and crop growth regulators poised to revolutionize farming practices. The market's focus on minimizing environmental impact assessment and improving crop quality attributes, such as leaf area index and plant hormone modulation, is a significant trend. According to recent studies, the use of nitrogenous fertilizers, such as urea, ammonia, and ammonium nitrate, in cereals and grains production has increased by 15%.
Furthermore, the adoption of precision agriculture tools for fertilizer application is projected to grow by 20% in the next five years. Phosphatic and potassic fertilizers are also expected to witness substantial growth due to their role in enhancing crop productivity. The market for agrochemicals is a vital sector, with various applications across cereals and grains, fruits, vegetables, and oilseeds. The ongoing unfolding of market activities and evolving patterns underscore the importance of staying informed about the latest trends and advancements.
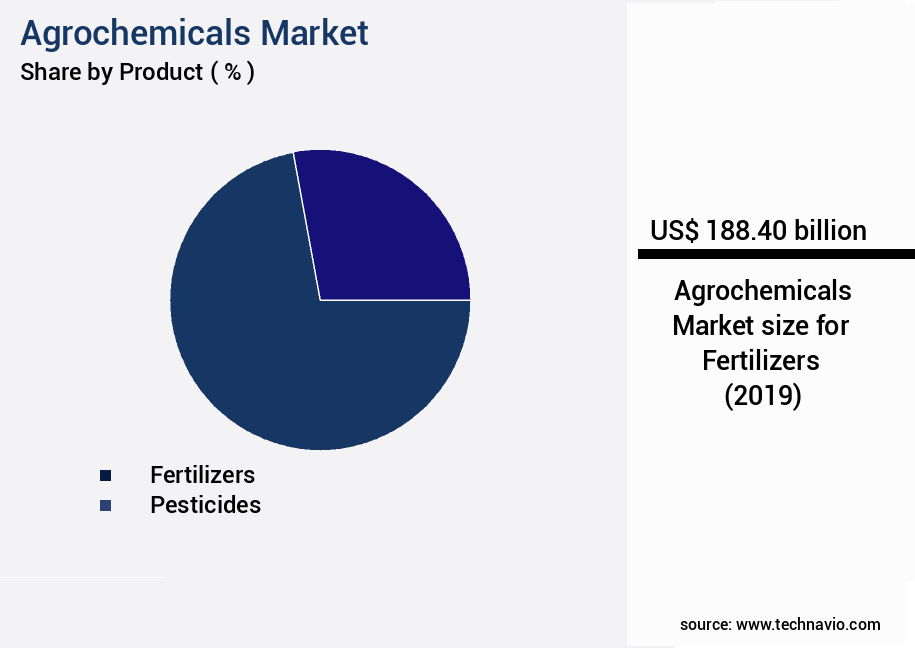
The Fertilizers segment was valued at USD 188.40 billion in 2019 and showed a gradual increase during the forecast period.
Regional Analysis
APAC is estimated to contribute 44% to the growth of the global market during the forecast period.Technavio's analysts have elaborately explained the regional trends and drivers that shape the market during the forecast period.

See How Agrochemicals Market Demand is Rising in APAC Request Free Sample
The market in APAC is a significant player in the global agricultural industry, given the vast expanses of arable land and large population. APAC represents approximately 60% of the world's population and 30% of the global land area. The region's agriculture sector has seen a surge in demand for food grains due to population growth, leading to the market's emergence as the largest and fastest-growing market for pesticide consumption worldwide.
Modern farming practices and the increasing adoption of integrated farming processes are primary drivers of this growth. Despite the need for greater awareness and acceptance of change among farmers, the future demand for agrochemicals is expected to remain strong as the region continues to modernize its agricultural sector.
Market Dynamics
Our researchers analyzed the data with 2024 as the base year, along with the key drivers, trends, and challenges. A holistic analysis of drivers will help companies refine their marketing strategies to gain a competitive advantage.
The market is a dynamic and evolving industry that plays a crucial role in ensuring sustainable agricultural production. This market encompasses a range of solutions, from soil microbial community analysis for optimizing plant growth to pest and disease forecasting models that help farmers mitigate risks. The market's focus on crop yield optimization strategies extends to water resource management techniques and sustainable pesticide application methods, which are essential for precision agriculture data analysis and environmental risk assessment protocols. Regulatory compliance for pesticides and organic certification standards for crops are increasingly important considerations, driving the development and registration of biopesticides.
Improved nutrient use efficiency in crops and enhanced crop stress tolerance mechanisms are key areas of investment, as are advanced pest and disease management strategies. Optimal fertilizer application timing and efficient water management strategies are critical components of sustainable agricultural production practices. Crop quality improvement methodologies are another significant aspect of the market, with a growing emphasis on advanced monitoring and control systems and data-driven decision support systems. These technologies enable farmers to make informed decisions based on real-time data, improving overall productivity and profitability. Compared to traditional farming methods, the adoption of advanced agrochemical solutions is significantly higher in developed regions, accounting for over 70% of the total investments.
This disparity highlights the need for more equitable access to these technologies to ensure food security and promote sustainable agricultural practices worldwide. In conclusion, The market is a vital sector that offers numerous opportunities for innovation and growth. By focusing on sustainable agricultural production practices, regulatory compliance, and advanced monitoring and control systems, market participants can contribute to improved crop yields, reduced environmental impact, and enhanced food security.
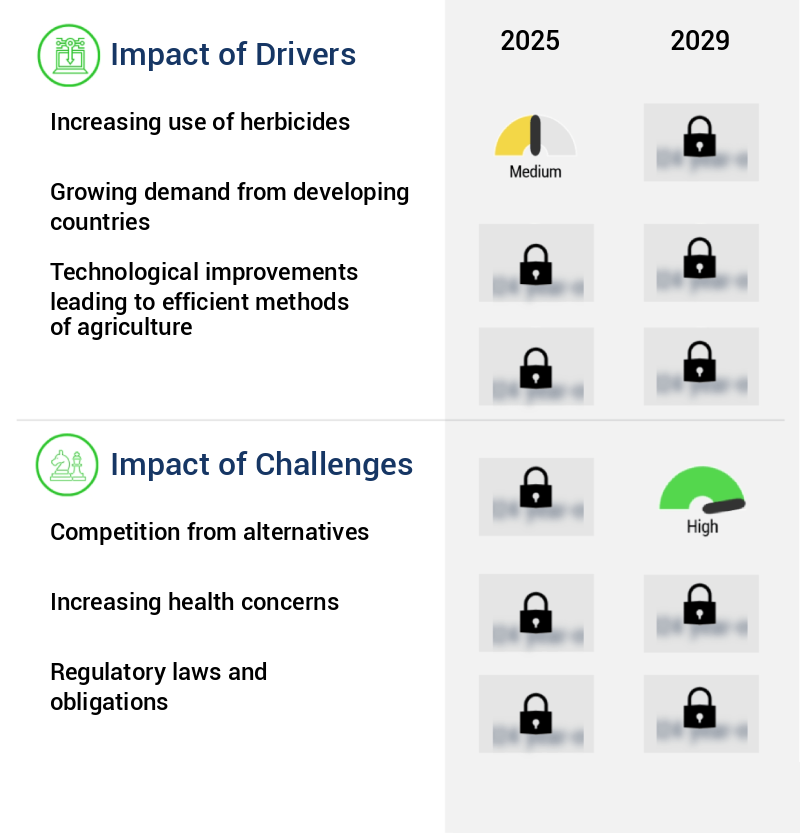
What are the key market drivers leading to the rise in the adoption of Agrochemicals Industry?
- The significant expansion in the application of herbicides serves as the primary catalyst for market growth.
- Herbicides, a crucial component of modern agriculture, continue to evolve with significant investments in research and development. New herbicide varieties are engineered to be more effective and eco-friendly, ensuring rapid decomposition post-application. The agricultural sector's extensive use of herbicides spans various crops, such as cereals, grains, fruits, vegetables, oilseeds, and pulses. Consumer preferences for fruits and green vegetables, driven by health and fitness consciousness, fuel the demand for herbicides in this sector.
- Despite ongoing debates regarding harmful herbicides, their presence persists due to cost advantages over substitute products. This dynamic market landscape underscores the importance of continuous innovation to meet evolving consumer needs and regulatory requirements.
What are the market trends shaping the Agrochemicals Industry?
- Integrated Pest Management (IPM) is becoming the preferred method in crop protection, as mandated by market trends. This approach to managing pests offers a sustainable and effective solution for agricultural production.
- Pest control comprises approximately 35% of a farmer's crop production expenses, and pests account for losses ranging from 11% to 32%. Traditional pesticides, while effective in controlling pests, face challenges such as resistance and environmental and health concerns. Integrated Pest Management (IPM) offers a proactive approach to pest prevention in agricultural settings. This strategy combines various control methods, including inspection, monitoring, and reporting, to create an inhospitable environment for pests.
- IPM's success relies on systemic resistance and proper operational design. Pesticides are applied judiciously, only when deemed most effective during a pest's life cycle. This data-driven approach minimizes the reliance on chemicals while maintaining optimal crop health.
What challenges does the Agrochemicals Industry face during its growth?
- The growth of the industry is significantly influenced by the intense competition posed by alternative options.
- Organic farming, a method of cultivating crops without the use of synthetic pesticides, fertilizers, antibiotics, and genetically modified organisms, has gained significant attention due to its focus on sustainability and environmental friendliness. This farming approach emphasizes practices like crop rotation, cover crops, and natural pest management, fostering a balanced ecosystem. Organic farming's benefits extend beyond the environment, with organic crops exhibiting 19% to 68% higher levels of antioxidants, such as polyphenolics, compared to conventionally grown crops.
- The Permitted Substances List outlines the approved substances for organic farming pesticides, ensuring minimal impact on the environment. This method's adoption continues to grow, underlining its relevance and importance in modern agriculture.
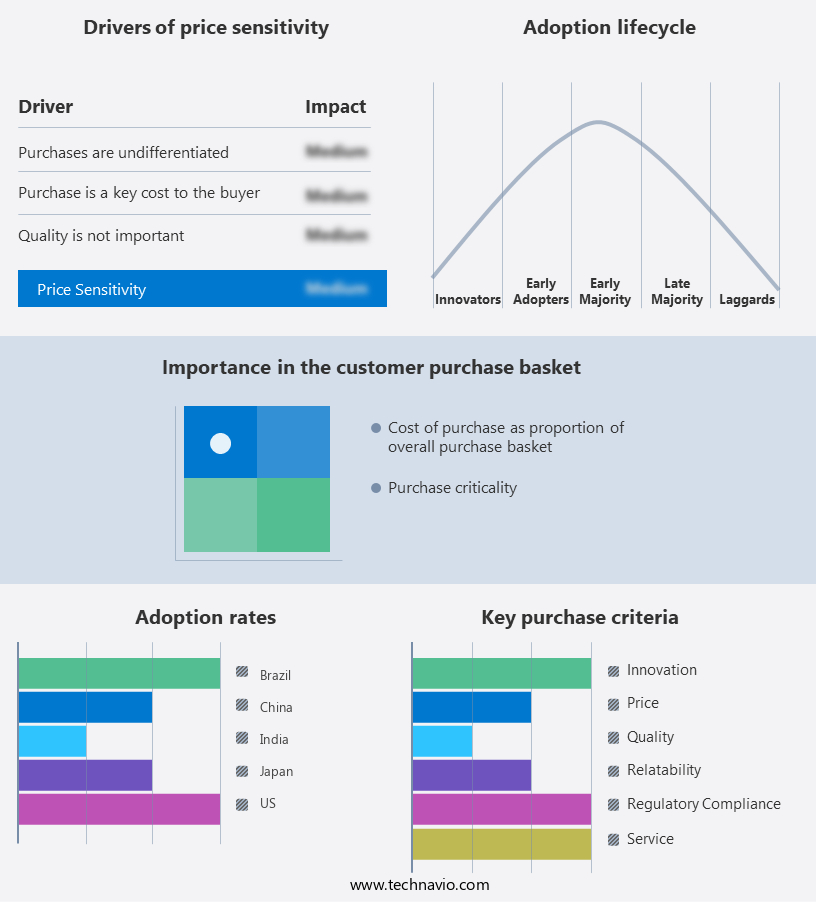
Exclusive Technavio Analysis on Customer Landscape
The agrochemicals market forecasting report includes the adoption lifecycle of the market, covering from the innovator's stage to the laggard's stage. It focuses on adoption rates in different regions based on penetration. Furthermore, the agrochemicals market report also includes key purchase criteria and drivers of price sensitivity to help companies evaluate and develop their market growth analysis strategies.
Customer Landscape of Agrochemicals Industry
Competitive Landscape
Companies are implementing various strategies, such as strategic alliances, agrochemicals market forecast, partnerships, mergers and acquisitions, geographical expansion, and product/service launches, to enhance their presence in the industry.
AMVAC Chemical Corp. - This company specializes in the provision of agrochemical solutions, incorporating eco-friendly alternatives and precision agriculture technologies. Their offerings aim to enhance agricultural productivity and sustainability.
The industry research and growth report includes detailed analyses of the competitive landscape of the market and information about key companies, including:
- AMVAC Chemical Corp.
- Archer Daniels Midland Co.
- BASF SE
- Bayer AG
- Cargill Inc.
- CF Industries Holdings Inc.
- Corteva Inc.
- Drexel Chemical Co.
- Evonik Industries AG
- FMC Corp.
- Gharda Chemicals Ltd.
- Haifa Negev technologies Ltd.
- Koch Industries Inc.
- Nissan Chemical Corp.
- Nufarm Ltd.
- Nutrien Ltd.
- Rotam CropSciences Ltd.
- Syngenta Crop Protection AG
- UPL Ltd.
- Yara International ASA
Qualitative and quantitative analysis of companies has been conducted to help clients understand the wider business environment as well as the strengths and weaknesses of key industry players. Data is qualitatively analyzed to categorize companies as pure play, category-focused, industry-focused, and diversified; it is quantitatively analyzed to categorize companies as dominant, leading, strong, tentative, and weak.
Recent Development and News in Agrochemicals Market
- In January 2024, BASF SE, a leading global producer of agrochemicals, announced the launch of Xarvio™ Field Manager, a digital farming solution designed to optimize crop management and increase agricultural productivity (BASF press release, 2024).
- In March 2024, Syngenta and Corteva Agriscience, two major agrochemical companies, entered into a strategic collaboration to co-develop and commercialize new crop protection solutions, aiming to strengthen their market position and expand their product portfolios (Syngenta press release, 2024).
- In April 2024, FMC Corporation, an agrochemicals and specialty chemicals company, completed the acquisition of Arysta LifeScience, a leading global provider of crop protection and non-agricultural solutions, for approximately USD4.2 billion. This acquisition was expected to enhance FMC's product offerings, expand its geographic reach, and boost its market presence (FMC Corporation press release, 2024).
- In May 2025, Bayer AG received regulatory approval from the European Commission to acquire Monsanto Company, creating a leading integrated agrochemicals and seeds business with an estimated combined market share of over 25% (European Commission press release, 2025).
Dive into Technavio's robust research methodology, blending expert interviews, extensive data synthesis, and validated models for unparalleled Agrochemicals Market insights. See full methodology.
|
Market Scope |
|
|
Report Coverage |
Details |
|
Page number |
217 |
|
Base year |
2024 |
|
Historic period |
2019-2023 |
|
Forecast period |
2025-2029 |
|
Growth momentum & CAGR |
Accelerate at a CAGR of 2.7% |
|
Market growth 2025-2029 |
USD 42.5 billion |
|
Market structure |
Fragmented |
|
YoY growth 2024-2025(%) |
2.6 |
|
Key countries |
China, US, India, Brazil, Japan, South Korea, Germany, South Africa, Canada, and Australia |
|
Competitive landscape |
Leading Companies, Market Positioning of Companies, Competitive Strategies, and Industry Risks |
Research Analyst Overview
- In the dynamic and evolving market, various trends and strategies continue to shape farming practices. Nutrient uptake efficiency is a critical focus, with farmers exploring fungicide application timing to optimize nutrient absorption. Weed management strategies have gained significance, as phosphorus availability remains a challenge in many agricultural regions. Disease resistance mechanisms are another essential aspect, with researchers investigating the potential of microbial inoculants to enhance crop health. Precision agriculture tools, such as pesticide residue analysis, biomass production, and grain filling duration monitoring, are increasingly adopted to ensure optimal crop growth. Soil health indicators, including organic matter content and humic acid fertilizers, are essential for long-term agricultural sustainability.
- Micronutrient deficiencies are addressed through various fertilizer application methods and soil nutrient cycling techniques. Integrated pest management strategies, including insecticide toxicity levels and crop stress tolerance, are crucial for effective pest control. Environmental impact assessment is a growing concern, with farmers exploring sustainable agriculture practices like water use efficiency, nitrogen fixation rates, and crop growth regulators. Biopesticide formulations, potassium uptake, root development enhancers, and leaf area index are among the tools employed to minimize environmental impact. Plant hormone modulation and harvest index are essential yield improvement metrics, while crop quality attributes, such as herbicide resistance genes and pesticide residue analysis, are crucial for maintaining market competitiveness.
- Crop growth regulators and biopesticide formulations contribute to disease resistance and pest control efficacy. In summary, the market is characterized by continuous innovation and adaptation to meet the evolving needs of farmers and consumers. From nutrient uptake efficiency to environmental impact assessment, various strategies and tools are employed to optimize crop production and ensure long-term sustainability.
What are the Key Data Covered in this Agrochemicals Market Research and Growth Report?
-
What is the expected growth of the Agrochemicals Market between 2025 and 2029?
-
USD 42.5 billion, at a CAGR of 2.7%
-
-
What segmentation does the market report cover?
-
The report is segmented by Product (Fertilizers and Pesticides), Application (Cereals and grains, Oilseeds and pulses, and Fruits and vegetables), Distribution Channel (Distributors and retailers, Direct sales, and Online sales), and Geography (APAC, North America, Europe, South America, and Middle East and Africa)
-
-
Which regions are analyzed in the report?
-
APAC, North America, Europe, South America, and Middle East and Africa
-
-
What are the key growth drivers and market challenges?
-
Increasing use of herbicides, Competition from alternatives
-
-
Who are the major players in the Agrochemicals Market?
-
AMVAC Chemical Corp., Archer Daniels Midland Co., BASF SE, Bayer AG, Cargill Inc., CF Industries Holdings Inc., Corteva Inc., Drexel Chemical Co., Evonik Industries AG, FMC Corp., Gharda Chemicals Ltd., Haifa Negev technologies Ltd., Koch Industries Inc., Nissan Chemical Corp., Nufarm Ltd., Nutrien Ltd., Rotam CropSciences Ltd., Syngenta Crop Protection AG, UPL Ltd., and Yara International ASA
-
Market Research Insights
- The market encompasses a diverse range of products and technologies employed in modern agriculture to enhance crop productivity and mitigate various environmental stressors. According to industry estimates, The market size was valued at USD220 billion in 2020, with a projected compound annual growth rate (CAGR) of 5% from 2021 to 2026. In contrast, the organic farming market, which excludes the use of synthetic agrochemicals, was valued at USD95.7 billion in 2020, growing at a CAGR of 12% during the same period. The integration of advanced technologies, such as crop modeling software, precision spraying technology, sensor-based monitoring, and data-driven decision making, has significantly transformed the market.
- For instance, the adoption of sensor-based monitoring systems has enabled farmers to optimize the application of agrochemicals, reducing wastage and environmental impact. Additionally, the development of agrochemicals with salinity tolerance traits, cold stress resilience, and pest resistance has expanded the market's scope, catering to the evolving needs of agriculture.
We can help! Our analysts can customize this agrochemicals market research report to meet your requirements.
 RIA -
RIA - 
