Enjoy complimentary customisation on priority with our Enterprise License!
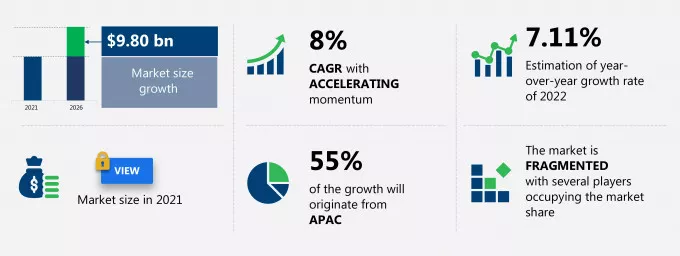
The synthetic diamonds market share is expected to increase by USD 9.80 billion from 2021 to 2026, and the market's growth momentum will accelerate at a CAGR of 8%.
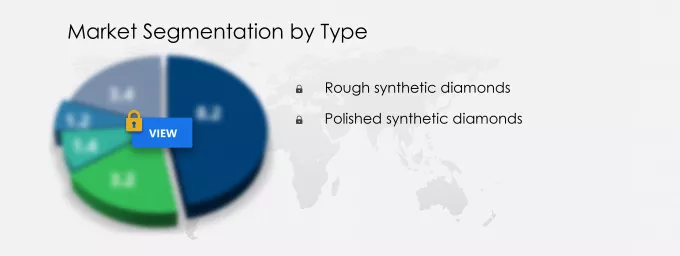
This synthetic diamonds market research report provides valuable insights on the post COVID-19 impact on the market, which will help companies evaluate their business approaches. Furthermore, this report extensively covers synthetic diamonds market segmentation by type (rough synthetic diamonds and polished synthetic diamonds) and geography (APAC, North America, Europe, MEA, and South America). The synthetic diamonds market report also offers information on several market vendors, including Applied Diamond Inc., Crystallume, Element Six UK Ltd., Henan Huanghe Whirlwind Co. Ltd., ILJIN Diamond Co. Ltd., NEW DIAMOND TECHNOLOGY LLC, Sandvik AB, Scio Diamond Technology Corp., Tomei Diamond Co. Ltd., and WD Lab Grown Diamonds among others.
Download the Free Report Sample to Unlock the Synthetic Diamonds Market Size for the Forecast Period and Other Important Statistics
Based on our research output, there has been a neutral impact on the market growth during and post COVID-19 era. The cost advantage of synthetic diamonds is notably driving the synthetic diamonds market growth, although factors such as complicated manufacturing process may impede the market growth. Our research analysts have studied the historical data and deduced the key market drivers and the COVID-19 pandemic impact on the synthetic diamonds industry. The holistic analysis of the drivers will help in deducing end goals and refining marketing strategies to gain a competitive edge.
Key Synthetic Diamonds Market Driver
One of the key factors driving growth in the synthetic diamonds market is the cost advantage of synthetic diamonds. The physical and chemical properties of synthetic diamonds and mined diamonds are almost the same, and one cannot differentiate by touch, sight, or other physical means. Although the price of diamonds mainly depends on their shape, cut, clarity, color, and carat, synthetic diamonds are cheaper than mined diamonds. Natural diamonds are produced over a long period of time, from millions to billions of years, however, synthetic diamonds are produced in one to three weeks. The price gap between these two types of diamonds (the lower prices of synthetic diamonds compared with natural diamonds) largely attracts customers in both industrial and jewelry applications. Thus, the low cost of synthetic diamonds is likely to encourage customers to prefer laboratory-grown diamonds in comparison with natural diamonds.
Key Synthetic Diamonds Market Trend
The rising demand from emerging applications such as electronics and semiconductors is another factor supporting the synthetic diamonds market share growth. It is widely used in several electronic devices such as high-power optical-electronic devices, high-voltage power electronics, light-emitting diodes, laser diodes, and high-frequency high-power devices. Synthetic diamond is largely preferred in semiconductor applications due to its unique thermal management properties. The decent thermal conductivity of synthetic diamond helps in enhancing power densities and operational life by lowering the junction temperature. The combination of electrical and thermal properties of synthetic diamonds is increasing its applications in the electronic industry. The increasing consumption of synthetic diamond in electronic materials and devices are likely to support the market growth for synthetic diamonds during the forecast period.
Key Synthetic Diamonds Market Challenge
The complicated manufacturing process will be a major challenge for the synthetic diamonds market during the forecast period. Synthetic diamonds are mainly produced by two manufacturing processes, such as the HPHT method and the CVD method. The production of synthetic diamonds is complex and time-consuming. These processes include multiple steps and have production limitations regarding the size of diamonds. The complexity of synthetic diamond manufacturing processes and their multistage processing are likely to hinder the market growth for synthetic diamonds. The size constraint in synthetic diamond manufacturing is also one of the key challenges for the synthetic diamond market.
This synthetic diamonds market analysis report also provides detailed information on other upcoming trends and challenges that will have a far-reaching effect on the market growth. The actionable insights on the trends and challenges will help companies evaluate and develop growth strategies for 2022-2026.
Technavio categorizes the global synthetic diamonds market as a part of the global diversified metals and mining market. Our research report has extensively covered external factors influencing the parent market growth potential in the coming years, which will determine the levels of growth of the synthetic diamonds market during the forecast period.
The report analyzes the market's competitive landscape and offers information on several market vendors, including:
This statistical study of the synthetic diamonds market encompasses successful business strategies deployed by the key vendors. The synthetic diamonds market is fragmented and the vendors are deploying organic and inorganic growth strategies to compete in the market.
Applied Diamond Inc - The company offers synthetic diamonds that are used for wide range of applications such as CVD systems.
To make the most of the opportunities and recover from post COVID-19 impact, market vendors should focus more on the growth prospects in the fast-growing segments, while maintaining their positions in the slow-growing segments.
The synthetic diamonds market forecast report offers in-depth insights into key vendor profiles. The profiles include information on the production, sustainability, and prospects of the leading companies.
Our report provides extensive information on the value chain analysis for the synthetic diamonds market, which vendors can leverage to gain a competitive advantage during the forecast period. The end-to-end understanding of the value chains is essential in profit margin optimization and evaluation of business strategies. The data available in our value chain analysis segment can help vendors drive costs and enhance customer services during the forecast period.
The value chain of the diversified metals and mining market includes the following core components:
The report has further elucidated on other innovative approaches being followed by manufacturers to ensure a sustainable market presence.
For more insights on the market share of various regions Request for a FREE sample now!
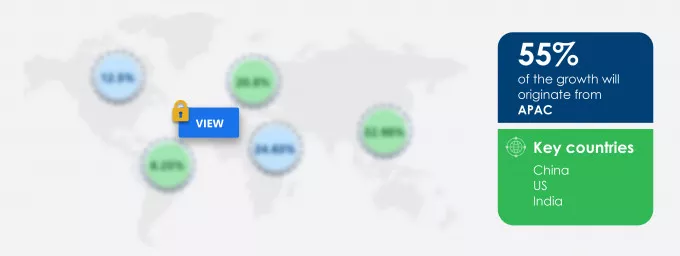
55% of the market's growth will originate from APAC during the forecast period. China and India are the key markets for synthetic diamonds in APAC. Market growth in this region will be faster than the growth of the market in other regions.
The growing industrialization and manufacturing activities will facilitate the synthetic diamonds market growth in APAC over the forecast period. This market research report entails detailed information on the competitive intelligence, marketing gaps, and regional opportunities in store for vendors, which will assist in creating efficient business plans.
COVID Impact and Recovery Analysis
The synthetic diamonds market in APAC witnessed a decline in growth due to the outbreak of the COVID-19 pandemic in 2020. India, China, Bangladesh, and Indonesia were some of the most affected countries by the outbreak in the region. In the second half of 2021, industries in this sector resumed their work with stringent social distancing norms due to mass vaccination drives across the region. These factors are anticipated to fuel the demand in the synthetic diamond market over the forecast period.
To gain further insights on the market contribution of various segments Request for a FREE sample
The synthetic diamonds market share growth by the rough synthetic diamonds segment will be significant during the forecast period. Some of the fast-growing applications of rough synthetic diamonds are oil and gas, mining, precision machining, construction, and water treatment. The growing application scope for rough synthetic diamonds will propel the growth of the market during the forecast period.
This report provides an accurate prediction of the contribution of all the segments to the growth of the synthetic diamonds market size and actionable market insights on post COVID-19 impact on each segment.
|
Synthetic Diamonds Market Scope |
|
|
Report Coverage |
Details |
|
Page number |
120 |
|
Base year |
2019 |
|
Forecast period |
2022-2026 |
|
Growth momentum & CAGR |
Accelerate at a CAGR of 8% |
|
Market growth 2022-2026 |
$ 9.80 billion |
|
Market structure |
Fragmented |
|
YoY growth (%) |
7.11 |
|
Regional analysis |
APAC, North America, Europe, MEA, and South America |
|
Performing market contribution |
APAC at 55% |
|
Key consumer countries |
China, US, India, Germany, and UAE |
|
Competitive landscape |
Leading companies, Competitive strategies, Consumer engagement scope |
|
Key companies profiled |
Applied Diamond Inc., Crystallume, Element Six UK Ltd., Henan Huanghe Whirlwind Co. Ltd., ILJIN Diamond Co. Ltd., NEW DIAMOND TECHNOLOGY LLC, Sandvik AB, Scio Diamond Technology Corp., Tomei Diamond Co. Ltd., and WD Lab Grown Diamonds |
|
Market dynamics |
Parent market analysis, Market growth inducers and obstacles, Fast-growing and slow-growing segment analysis, COVID 19 impact and recovery analysis and future consumer dynamics, Market condition analysis for the forecast period |
|
Customization purview |
If our report has not included the data that you are looking for, you can reach out to our analysts and get segments customized. |
We can help! Our analysts can customize this report to meet your requirements. Get in touch
1. Executive Summary
2. Market Landscape
2.1 Market ecosystem
Exhibit 01: Parent market
2.2: Market Characteristics
3. Market Sizing
3.1 Market definition
Exhibit 02: Offerings of vendors included in the market definition
3.2 Market segment analysis
Exhibit 03: Market segments
3.3 Market size 2020
3.4 Market outlook: Forecast for 2020 - 2025
Exhibit 04: Global - Market size and forecast 2021-2026 ($ million)
Exhibit 05: Global - Market size and forecast 2021-2026 ($ million)
Exhibit 06: Global Market: Year-over-year growth 2021-2026 (%)
Exhibit 07: Global Market: Year-over-year growth 2021-2026 (%)
4. Five Forces Analysis
4.1 Five Forces Summary
Exhibit 08: Five forces analysis 2020 & 2025
4.2 Bargaining power of buyers
4.3 Bargaining power of suppliers
4.4 Threat of new entrants
4.5 Threat of substitutes
4.6 Threat of rivalry
4.7 Market condition
Exhibit 09: Market condition - Five forces 2021 and 2026
5 Market Segmentation by Type
5.1 Market segments
Exhibit 10: Type - Market share 2021-2026 (%)
Exhibit 11: Type - Market share 2021-2026 (%)
5.2 Comparison by Type
Exhibit 12: Comparison by Type
Exhibit 13: Comparison by Type
5.3 Rough synthetic diamonds - Market size and forecast 2021-2026
Exhibit 14: Rough synthetic diamonds - Market size and forecast 2021-2026 ($ million)
Exhibit 15: Rough synthetic diamonds - Market size and forecast 2021-2026 ($ million)
Exhibit 16: Rough synthetic diamonds - Year-over-year growth 2021-2026 (%)
Exhibit 17: Rough synthetic diamonds - Year-over-year growth 2021-2026 (%)
5.4 Polished synthetic diamonds - Market size and forecast 2021-2026
Exhibit 18: Polished synthetic diamonds - Market size and forecast 2021-2026 ($ million)
Exhibit 19: Polished synthetic diamonds - Market size and forecast 2021-2026 ($ million)
Exhibit 20: Polished synthetic diamonds - Year-over-year growth 2021-2026 (%)
Exhibit 21: Polished synthetic diamonds - Year-over-year growth 2021-2026 (%)
5.5 Market opportunity by Type
Exhibit 22: Market opportunity by Type ($ million)
6 Customer Landscape
Exhibit 23: Customer landscape
7 Geographic Landscape
7.1 Geographic segmentation
Exhibit 24: Market share by geography 2021-2026 (%)
7.2 Geographic comparison
Exhibit 25: Geographic comparison
Exhibit 26: Geographic comparison
7.3 APAC - Market size and forecast 2021-2026
Exhibit 27: APAC - Market size and forecast 2021-2026 ($ million)
Exhibit 28: APAC - Market size and forecast 2021-2026 ($ million)
Exhibit 29: APAC - Year-over-year growth 2021-2026 (%)
Exhibit 30: APAC - Year-over-year growth 2021-2026 (%)
7.4 North America - Market size and forecast 2021-2026
Exhibit 31: North America - Market size and forecast 2021-2026 ($ million)
Exhibit 32: North America - Market size and forecast 2021-2026 ($ million
Exhibit 33: North America - Year-over-year growth 2021-2026 (%)
Exhibit 34: North America - Year-over-year growth 2021-2026 (%)
7.5 Europe - Market size and forecast 2021-2026
Exhibit 35: Europe - Market size and forecast 2021-2026 ($ million)
Exhibit 36: Europe - Market size and forecast 2021-2026 ($ million)
Exhibit 37: Europe - Year-over-year growth 2021-2026 (%)
Exhibit 38: Europe - Year-over-year growth 2021-2026 (%)
7.6 Middle East and Africa - Market size and forecast 2021-2026
Exhibit 39: Middle East and Africa - Market size and forecast 2021-2026 ($ million)
Exhibit 40: Middle East and Africa - Market size and forecast 2021-2026 ($ million)
Exhibit 41: Middle East and Africa - Year-over-year growth 2021-2026 (%)
Exhibit 42: Middle East and Africa - Year-over-year growth 2021-2026 (%)
7.7 South America - Market size and forecast 2021-2026
Exhibit 43: South America - Market size and forecast 2021-2026 ($ million)
Exhibit 44: South America - Market size and forecast 2021-2026 ($ million)
Exhibit 45: South America - Year-over-year growth 2021-2026 (%)
Exhibit 46: South America - Year-over-year growth 2021-2026 (%)
7.8 China - Market size and forecast 2021-2026
Exhibit 47: China - Market size and forecast 2021-2026 ($ million)
Exhibit 48: China - Market size and forecast 2021-2026 ($ million)
Exhibit 49: China - Year-over-year growth 2021-2026 (%)
Exhibit 50: China - Year-over-year growth 2021-2026 (%)
7.9 US - Market size and forecast 2021-2026
Exhibit 51: US - Market size and forecast 2021-2026 ($ million)
Exhibit 52: US - Market size and forecast 2021-2026 ($ million)
Exhibit 53: US - Year-over-year growth 2021-2026 (%)
Exhibit 54: US - Year-over-year growth 2021-2026 (%)
7.10 India - Market size and forecast 2021-2026
Exhibit 55: India - Market size and forecast 2021-2026 ($ million)
Exhibit 56: India - Market size and forecast 2021-2026 ($ million)
Exhibit 57: India - Year-over-year growth 2021-2026 (%)
Exhibit 58: India - Year-over-year growth 2021-2026 (%)
7.11 Germany - Market size and forecast 2021-2026
Exhibit 59: Germany - Market size and forecast 2021-2026 ($ million)
Exhibit 60: Germany - Market size and forecast 2021-2026 ($ million)
Exhibit 61: Germany - Year-over-year growth 2021-2026 (%)
Exhibit 62: Germany - Year-over-year growth 2021-2026 (%)
7.12 United Arab Emirates - Market size and forecast 2021-2026
Exhibit 63: United Arab Emirates - Market size and forecast 2021-2026 ($ million)
Exhibit 64: United Arab Emirates - Market size and forecast 2021-2026 ($ million)
Exhibit 65: United Arab Emirates - Year-over-year growth 2021-2026 (%)
Exhibit 66: United Arab Emirates - Year-over-year growth 2021-2026 (%)
7.13 Market opportunity by geography
Exhibit 67: Market opportunity by geography ($ million)
8 Drivers, Challenges, and Trends
8.1 Market drivers
8.1.1 Cost advantage of synthetic diamonds
8.1.2 Growing demand for synthetic diamonds from APAC
8.1.3 Restrictions on mining activities
8.2 Market challenges
8.2.1 Complicated manufacturing process
8.2.2 Protests by natural diamond traders
8.2.3 Advances in natural diamond mining process
8.3 Impact of drivers and challenges
Exhibit 68: Impact of drivers and challenges
8.4 Market trends
8.4.1 Rising demand from emerging applications such as electronics and semiconductors
8.4.2 Growing consumption of polished diamonds in the jewelry industry
8.4.3 Robust R initiatives to enhance synthetic diamonds use
9. Vendor Landscape
9.1 Competitive scenario
9.2 Vendor landscape
Exhibit 69: Vendor Landscape
9.3 Landscape disruption
Exhibit 70: Landscape disruption
9.4 Industry risks
Exhibit 71: Industry risks
10. Vendor Analysis
10.1 Vendors covered
Exhibit 72: Vendors covered
10.2 Market positioning of vendors
Exhibit 73: Market positioning of vendors
10.3 Applied Diamond Inc.
Exhibit 74: Applied Diamond Inc. - Overview
Exhibit 75: Applied Diamond Inc. - Product / Service
Exhibit 76: Applied Diamond Inc. - Key offerings
10.4 Crystallume
Exhibit 77: Crystallume - Overview
Exhibit 78: Crystallume - Product / Service
Exhibit 79: Crystallume - Key offerings
10.5 Electronic Commodities Exchange LP
Exhibit 80: Electronic Commodities Exchange LP - Overview
Exhibit 81: Electronic Commodities Exchange LP - Product / Service
Exhibit 82: Electronic Commodities Exchange LP - Key offerings
10.6 Element Six UK Ltd.
Exhibit 83: Element Six UK Ltd. - Overview
Exhibit 84: Element Six UK Ltd. - Product / Service
Exhibit 85: Element Six UK Ltd. - Key offerings
Exhibit 86: Element Six UK Ltd. - Key offerings
Exhibit 87: Henan Huanghe Whirlwind Co. Ltd. - Overview
Exhibit 88: Henan Huanghe Whirlwind Co. Ltd. - Product / Service
Exhibit 89: Henan Huanghe Whirlwind Co. Ltd. - Key offerings
10.7 ILJIN Diamond Co. Ltd.
Exhibit 90: ILJIN Diamond Co. Ltd. - Overview
Exhibit 91: ILJIN Diamond Co. Ltd. - Product / Service
Exhibit 92: ILJIN Diamond Co. Ltd. - Key offerings
10.8 NEW DIAMOND TECHNOLOGY LLC
Exhibit 93: NEW DIAMOND TECHNOLOGY LLC - Overview
Exhibit 94: NEW DIAMOND TECHNOLOGY LLC - Product / Service
Exhibit 95: NEW DIAMOND TECHNOLOGY LLC - Key offerings
10.9 Sandvik AB
Exhibit 96: Sandvik AB - Overview
Exhibit 97: Sandvik AB - Business segments
Exhibit 98: Sandvik AB - Key news
Exhibit 99: Sandvik AB - Key offerings
Exhibit 100: Sandvik AB - Segment focus
10.10 Tomei Diamond Co. Ltd.
Exhibit 101: Tomei Diamond Co. Ltd. - Overview
Exhibit 102: Tomei Diamond Co. Ltd. - Product / Service
Exhibit 103: Tomei Diamond Co. Ltd. - Key offerings
10.11 WD Lab Grown Diamonds
Exhibit 104: WD Lab Grown Diamonds - Overview
Exhibit 105: WD Lab Grown Diamonds - Product / Service
Exhibit 106: WD Lab Grown Diamonds - Key offerings
11. Appendix
11.1 Scope of the report
11.1.1 ????Market definition
11.1.2 ????Objectives
11.1.3 ????Notes and caveats
11.2 Currency conversion rates for US$
Exhibit 107:?Currency conversion rates for US$?
11.3 Research Methodology
Exhibit 108: ?Research Methodology
Exhibit 109: ??Validation techniques employed for market sizing?
Exhibit 110: ??Information sources
Get lifetime access to our
Technavio Insights


