
Morocco Hospitality Market Size 2025-2029
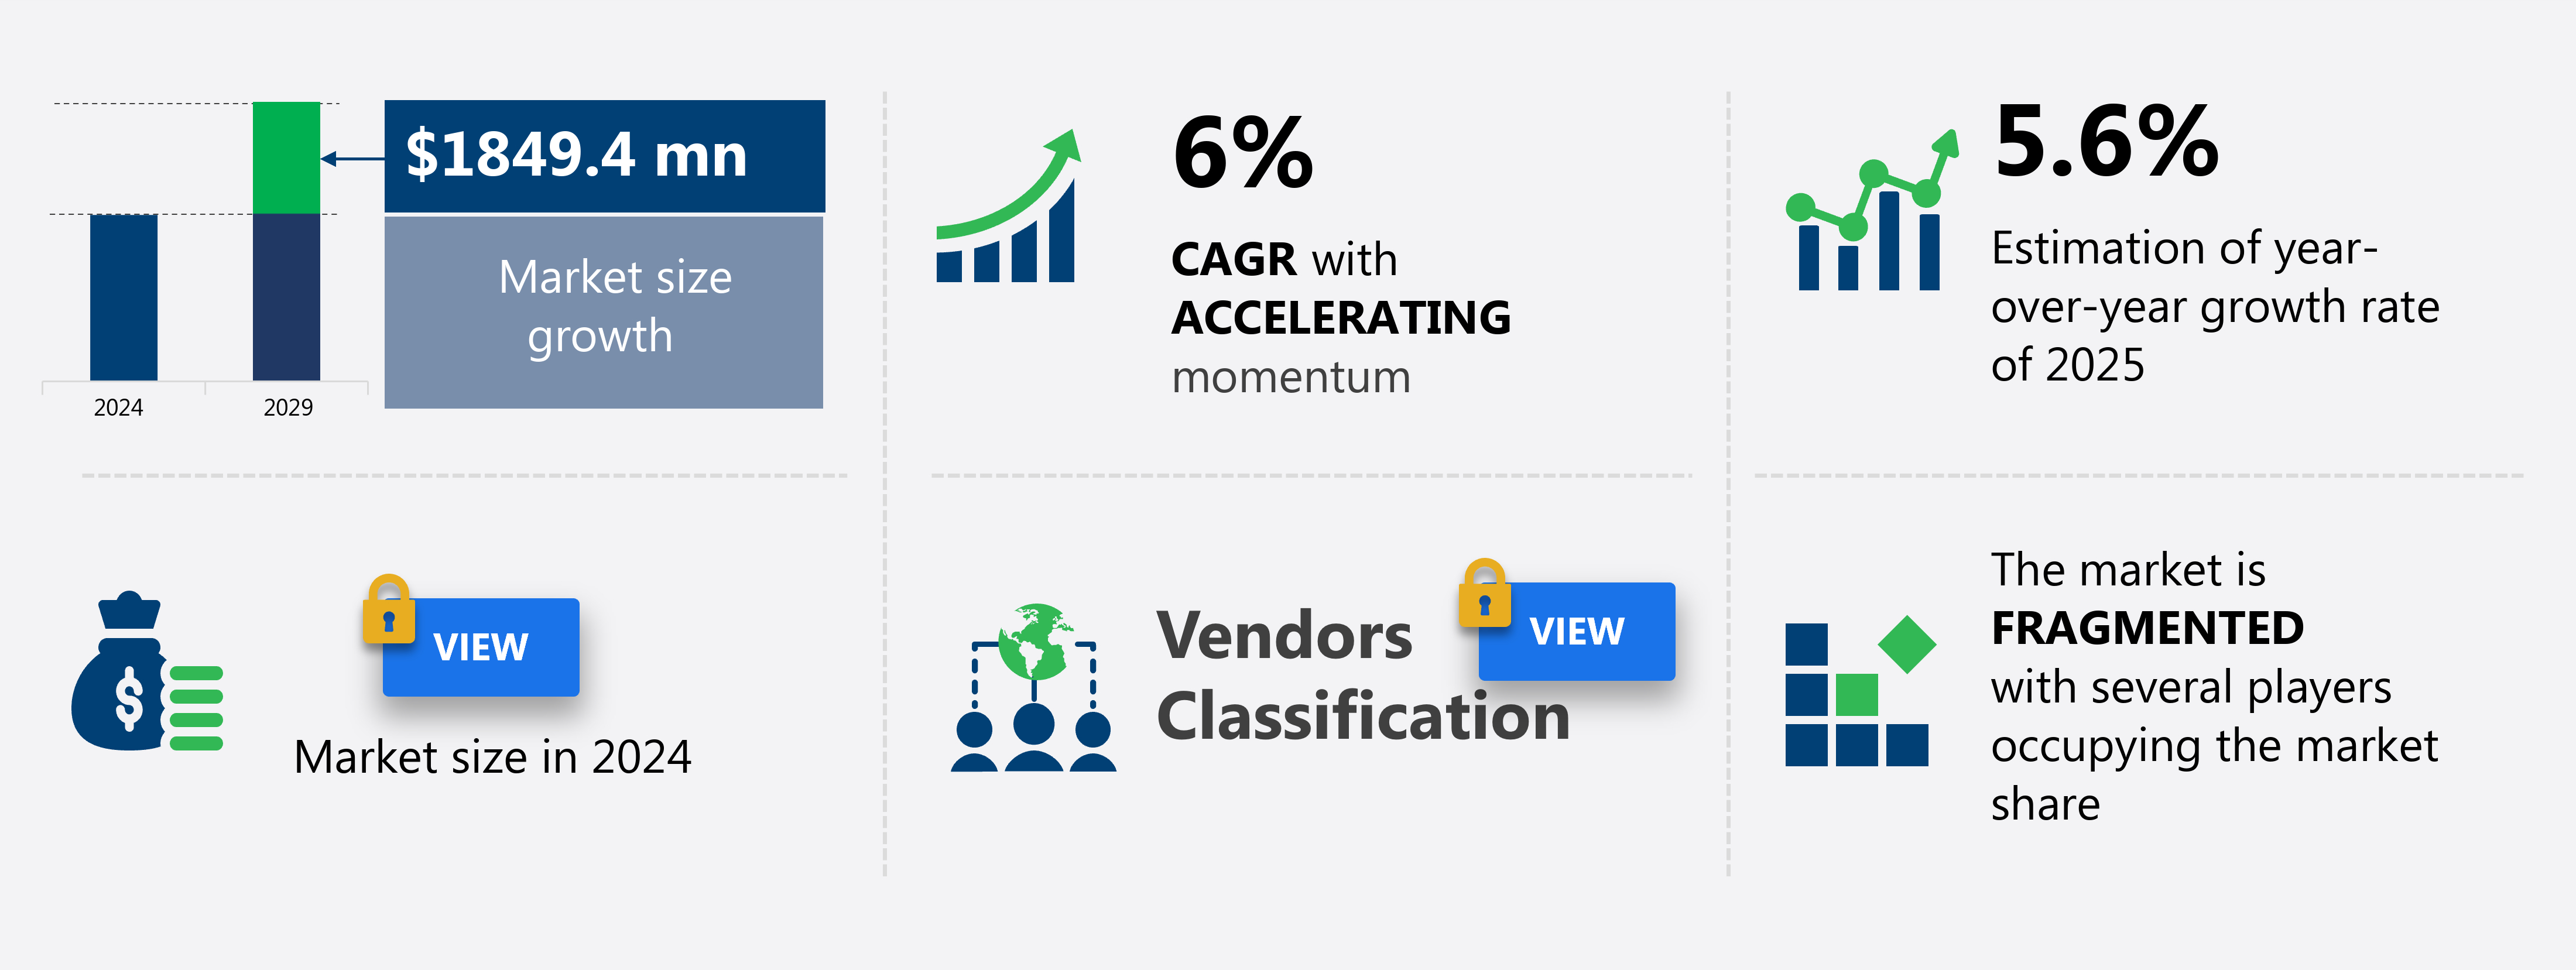
The hospitality market in Morocco size is forecast to increase by USD 1.85 billion at a CAGR of 6% between 2024 and 2029.
-
The hospitality market is experiencing significant shifts driven by evolving consumer preferences and technological advancements. One key trend is the growing demand for local and authentic experiences, as travelers seek to connect with the cultures and communities they visit (Shifting preference for local and authentic experiences). Catering services and conference management cater to corporate travelers, with digital transformation streamlining operations.
-
However, implementing effective tourism policies remains a challenge for industry players, as they navigate complex regulatory environments and strive to balance economic development with environmental sustainability and social responsibility. These trends and challenges are shaping the future of the hospitality industry, offering both opportunities and challenges for businesses that are able to adapt and innovate. In the dynamic hospitality market, solo travelers and event planners seek personalized experiences, driving the demand for advanced technology integrations such as voice assistants and mobile payments.
What will be the Size of the market During the Forecast Period?
-
Supply chain management and quality management are crucial for ensuring food safety and energy efficiency, while net promoter scores and guest reviews shape brand reputation. Service recovery strategies are essential for addressing any issues promptly, boosting customer lifetime value. Another factor fueling market growth is the increasing use of the internet for researching and booking accommodations, as well as the influence of online testimonials and reviews (Increase in Internet access and online testimonials).
Family travel and wellness travel segments prioritize employee engagement and waste reduction. Destination management and smart home integration offer unique experiences, enhancing the overall guest experience. Biometric authentication and average daily rates are key performance indicators for occupancy rate optimization. Adventure travel and group travel segments continue to grow, requiring robust employee empowerment and continuous improvement in service offerings.
How is this market segmented and which is the largest segment?
The market research report provides comprehensive data (region-wise segment analysis), with forecasts and estimates in "USD million" for the period 2025-2029, as well as historical data from 2019-2023 for the following segments.
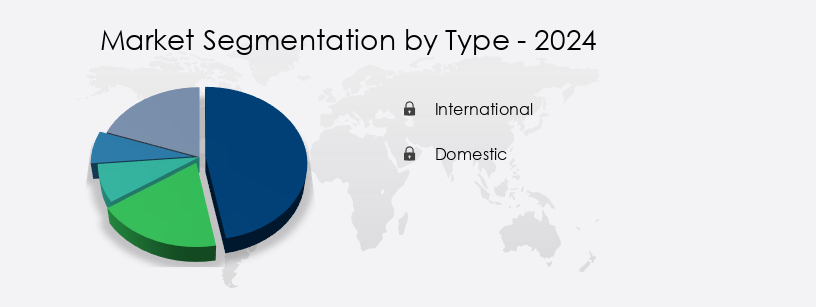
- Type
- International
- Domestic
- Service
- Food service
- Accommodation
- Business Segment
- Chain hotels
- Independent hotels
- Franchise models
- Management contracts
- Price Range
- Budget
- Mid-range
- Upscale
- Luxury
- Geography
By Type Insights
- The international segment is estimated to witness significant growth during the forecast period. The global hospitality market is experiencing significant evolution, with various entities shaping its dynamics. Loyalty programs are becoming increasingly important for retaining customers, offering personalized rewards and experiences. Eco-friendly practices are gaining prominence, as sustainability initiatives align with travelers' values and regulatory requirements. Tourism technology, including channel management systems and digital marketing, streamlines operations and enhances customer experiences. Meeting rooms equipped with advanced technology cater to business travelers, while revenue management systems optimize pricing strategies. Cloud computing and mobile services, such as mobile check-in and mobile ordering, offer convenience and flexibility. Fitness centers, guest engagement, and automated services cater to diverse consumer preferences.
- Sustainable initiatives, like green initiatives and energy efficiency, are a priority for hotels. Luxury and boutique hotels invest in hospitality design and concierge services to provide unique experiences. Event spaces and business intelligence tools cater to corporate clients. Cost optimization, through revenue optimization and operational efficiency, is crucial for budget hotels. Property management systems and staff training ensure high-quality customer service. Online booking engines and social media marketing expand reach and accessibility. In the realm of hospitality technology, artificial intelligence and guest relationship management systems improve operational efficiency and personalize services.
Get a glance at the market report of share of various segments Request Free Sample
Market Dynamics
Our Morocco Hospitality Market researchers analyzed the data with 2024 as the base year, along with the key drivers, trends, and challenges. A holistic analysis of drivers will help companies refine their marketing strategies to gain a competitive advantage.
What are the key market drivers leading to the rise in adoption of Morocco Hospitality Market?
Shifting preference for local and authentic experiences is the key driver of the market.
-
In the dynamic hospitality industry, personalized services and authentic experiences continue to drive consumer preferences. Moroccan riads, traditional guesthouses, offer unique lodging experiences with a focus on local engagement and cultural immersion. Family-run restaurants serve traditional dishes made from locally sourced ingredients, enhancing the culinary journey for tourists. The demand for interactive activities, such as cooking classes, historic tours, and artisan workshops, has increased, fostering deeper connections with Moroccan traditions and craftsmanship. To cater to these evolving preferences, the Moroccan hospitality sector is prioritizing digital marketing strategies, automated reservation systems, and guest engagement tools.
-
Fitness centers and hospitality design elements catering to wellness trends add value to the guest experience. Moreover, the sector is embracing sustainable tourism practices, with a focus on eco-friendly accommodations and responsible initiatives. The Internet of Things (IoT) is being integrated into hospitality services to enhance guest convenience and streamline operations. These trends reflect the growing importance of meaningful travel experiences that go beyond conventional tourism offerings.
What are the market trends shaping the Morocco Hospitality Market?
Increase in Internet access and online testimonials is the upcoming trend in the market.
-
The Moroccan hospitality market is experiencing significant growth in 2024, fueled by the increasing integration of travel technology and the impact of online reviews. With platforms like Booking.Com and TripAdvisor becoming essential tools for travelers, hotels and service providers are prioritizing operational efficiency and revenue optimization. This includes investing in advanced hotel management systems, hotel distribution channels, mobile apps, social media marketing, and virtual reality technology. Additionally, data analytics is being leveraged to gain insights into guest preferences and optimize pricing and promotions. To enhance the guest experience, hotels are focusing on smart rooms, guest safety, and staff training.
-
Property management systems are being used to streamline operations and improve guest satisfaction. The competitive landscape is intensifying, as businesses strive to offer personalized experiences and modern amenities to attract and retain guests. Furthermore, Morocco's diverse tourism offerings, from luxury resorts to cultural experiences, continue to attract international visitors, making it a thriving market for hospitality businesses.
What challenges doesMorocco Hospitality Market face during the growth?
-
Difficulties in implementing tourism policies is a key challenge affecting the market growth. The hospitality industry in Morocco experienced significant growth in 2024, with a record-breaking 17.4 million international visitors, making it the most-visited country in Africa. However, challenges persist, including balancing rapid development with sustainability. Bureaucratic hurdles and regulatory inconsistencies continue to slow project approvals, discouraging foreign investment. Additionally, regional security concerns pose a risk to long-term tourism growth. In response, the government launched investment guidelines to attract international stakeholders and streamline business operations. Interior design, digital signage, business intelligence, concierge services, mobile ordering, cost optimization, room service, customer service, guest wifi, guest feedback, artificial intelligence, luxury hotels, event spaces, and boutique hotels have become essential components of Morocco's hospitality sector.
These technologies and services enhance the guest experience, improve operational efficiency, and provide valuable data for business intelligence. Despite challenges, the future of Morocco's hospitality industry remains promising, with continued investment in infrastructure and a focus on sustainability and customer satisfaction.
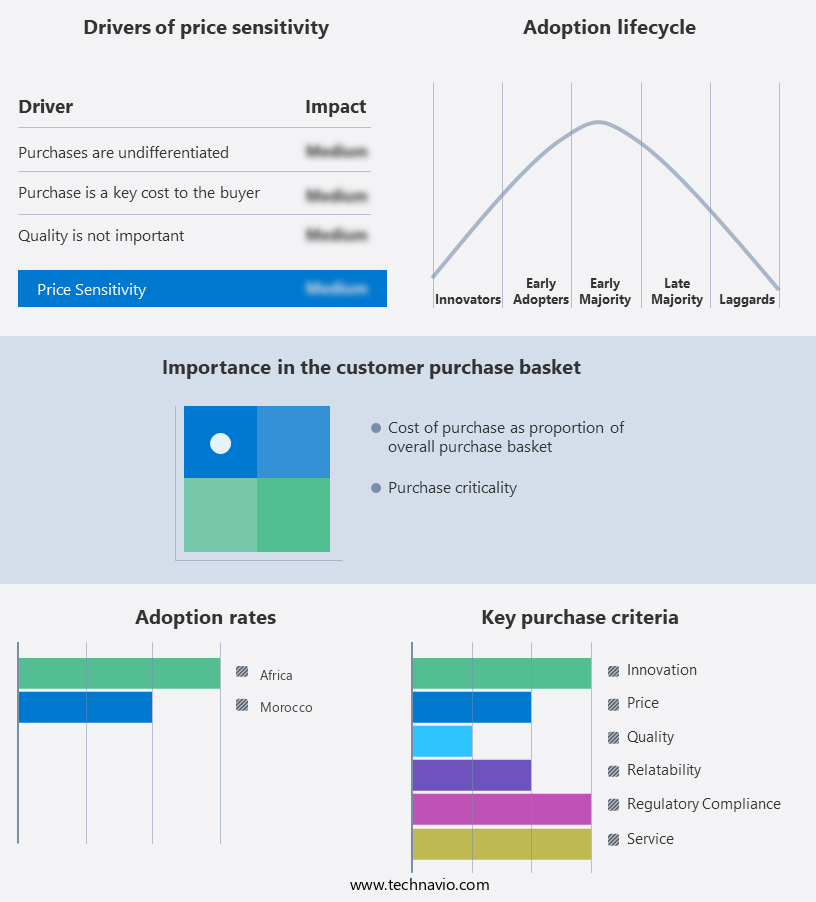
Exclusive Customer Landscape
The market forecasting report includes the adoption lifecycle of the market, covering from the innovator's stage to the laggard's stage. It focuses on adoption rates in different regions based on penetration. Furthermore, the market report also includes key purchase criteria and drivers of price sensitivity to help companies evaluate and develop their market growth analysis strategies.
Customer Landscape
Key Companies & Market Insights
Companies are implementing various strategies, such as strategic alliances, market forecast , partnerships, mergers and acquisitions, geographical expansion, and product/service launches, to enhance their presence in the market.
Accor S.A. - The company's innovative hospitality ecosystem encompasses restaurants, coworking spaces, entertainment, and loyalty programs, delivering a comprehensive guest experience.
The market research and growth report includes detailed analyses of the competitive landscape of the market and information about key companies, including:
- Accor S.A.
- Aman Group S.a.r.l.
- Dar Ayniwen
- Four Seasons Hotels Ltd.
- Hyatt Hotels Corp.
- Jin Jiang International Holdings Co. Ltd.
- Kenzi Hotel Group
- Kerzner International Ltd.
- La Mamounia Marrakech
- Louvre Hotels Group
- Mandarin Oriental International Ltd.
- Marriott International Inc.
- ONOMO International SARL
- Palais Faraj Suites and Spa
- PALAIS SHEHERAZADE and SpA
- Rotana Hotel Management Corp.
- Royal Mansour Marrakech
- SELMAN MARRAKECH
- Wyndham Hotels and Resorts Inc.
Qualitative and quantitative analysis of companies has been conducted to help clients understand the wider business environment as well as the strengths and weaknesses of key market players. Data is qualitatively analyzed to categorize companies as pure play, category-focused, industry-focused, and diversified; it is quantitatively analyzed to categorize companies as dominant, leading, strong, tentative, and weak.
Recent Development and News in Hospitality Market In Morocco
- In March 2023, Marriott International announced the launch of its newest luxury brand, EDITION Mansion, marking a significant expansion in the upscale segment of the hospitality market (Marriott International Press Release, 2023). This new brand focuses on acquiring historic mansions and transforming them into luxury hotels, offering unique experiences to guests.
- In July 2024, Accor and Microsoft Corporation entered into a strategic partnership to develop a global hospitality ecosystem powered by Microsoft's Azure cloud platform (Accor Press Release, 2024). This collaboration aims to enhance guest experiences through data-driven personalization and improved operational efficiency.
- In October 2024, Hilton Worldwide Holdings Inc. Completed the acquisition of Playa Hotels & Resorts, expanding its all-inclusive resort portfolio by over 5,000 rooms across Mexico, Jamaica, and the Dominican Republic (Hilton Worldwide Holdings Inc. SEC Filing, 2024). This acquisition strengthened Hilton's presence in the Caribbean and Mexico markets.
- In January 2025, the European Union passed the Digital Services Act, which includes new rules for online platforms, including those in the hospitality sector (European Parliament Press Release, 2025). The act aims to ensure a level playing field for businesses, protect consumers, and enhance transparency. This regulatory change could lead to significant shifts in the digital strategies of hospitality companies operating in Europe.
Research Analyst Overview
In the ever-evolving hospitality industry, market dynamics continue to unfold, shaping the landscape across various sectors. Digital marketing strategies are increasingly essential, with personalized services and reservation systems becoming the norm. Eco-friendly practices and tourism technology are at the forefront of innovation, driving sustainability and enhancing the guest experience. Channel management systems streamline operations, ensuring seamless guest relations and efficient hospitality marketing. Cloud computing and revenue management systems optimize costs, while green initiatives and automated services cater to the evolving demands of modern travelers. Augmented reality and virtual reality technologies offering different experiences, from guest engagement to vacation rentals and hospitality design.
Food and beverage offerings are personalized, with predictive analytics and data analytics driving menu optimization and guest satisfaction. The Internet of Things and guest relationship management systems enable real-time communication and customized services, from mobile check-in and ordering to concierge services and guest wifi. Business intelligence and artificial intelligence power operational efficiency and cost optimization, enhancing the overall guest experience. Luxury and budget hotels alike embrace technology, with meeting rooms, event spaces, and smart rooms catering to diverse clientele. Staff training and online booking engines ensure exceptional customer service, while safety features and property management systems prioritize guest well-being. The hospitality industry's continuous evolution is marked by the integration of digital signage, mobile apps, social media marketing, and cost optimization tools.
The future of hospitality lies in the seamless fusion of technology and personalized services, redefining the guest experience at every touchpoint. The Hospitality Market in Morocco is experiencing growth, driven by diverse travel preferences and sustainability initiatives. Hotels focus on optimizing average daily rate to balance revenue and affordability for guests. Measuring net promoter score helps businesses assess customer satisfaction and refine services. Staff empowerment plays a key role in enhancing guest experiences, ensuring professionalism and personalized care. AI-driven personalized recommendations improve customer engagement, tailoring travel plans to individual preferences. Sustainable tourism efforts include water conservation measures, reducing environmental impact. The market caters to corporate travel, leisure travel, and solo travel, offering varied accommodations and services. Efficient event planning ensures seamless execution of conferences, weddings, and cultural gatherings, solidifying Morocco's reputation as a top hospitality destination.
|
Market Scope |
|
|
Report Coverage |
Details |
|
Page number |
174 |
|
Base year |
2024 |
|
Historic period |
2019-2023 |
|
Forecast period |
2025-2029 |
|
Growth momentum & CAGR |
Accelerate at a CAGR of 6% |
|
Market growth 2025-2029 |
USD 1.85 billion |
|
Market structure |
Fragmented |
|
YoY growth 2024-2025(%) |
5.6 |
|
Key countries |
Morocco |
|
Competitive landscape |
Leading Companies, Market Positioning of Companies, Competitive Strategies, and Industry Risks |
What are the Key Data Covered in this Market Research and Growth Report?
- CAGR of the market during the forecast period
- Detailed information on factors that will drive the market growth and forecasting between 2025 and 2029
- Precise estimation of the size of the market and its contribution of the market in focus to the parent market
- Accurate predictions about upcoming market growth and trends and changes in consumer behaviour
- Growth of the market across Morocco
- Thorough analysis of the market's competitive landscape and detailed information about companies
- Comprehensive analysis of factors that will challenge the growth of market companies
We can help! Our analysts can customize this market research report to meet your requirements. Get in touch
 RIA -
RIA - 
