
Hydrotreated Vegetable Oil Market Size 2025-2029
The hydrotreated vegetable oil market size is forecast to increase by USD 20.11 billion, at a CAGR of 13.3% between 2024 and 2029.
- The Hydrotreated Vegetable Oil (HVO) market is driven by several key factors. Firstly, supportive government measures aimed at reducing greenhouse gas emissions and promoting the use of renewable fuels are propelling market growth. The adoption of eco-friendly fuel alternatives, particularly in the transportation sector, is a significant trend shaping the market. However, the market faces challenges as well. Fluctuations in the prices of raw materials, such as vegetable oils and natural gas, can significantly impact the production costs of HVO. Additionally, the market's growth may be hindered by the high capital investment required for the production of HVO.
- Companies seeking to capitalize on market opportunities must stay abreast of raw material price trends and explore cost-effective production methods. Meanwhile, those looking to navigate challenges effectively should consider strategic partnerships and collaborations to share risks and resources. Overall, the HVO market presents both opportunities and challenges, with the potential for significant growth in the renewable fuels sector.
What will be the Size of the Hydrotreated Vegetable Oil Market during the forecast period?

Explore in-depth regional segment analysis with market size data - historical 2019-2023 and forecasts 2025-2029 - in the full report.
Request Free Sample
The hydrotreated vegetable oil (HVO) market continues to evolve, driven by the ongoing quest for sustainable fuels and the increasing focus on reducing carbon emissions across various sectors. HVO, derived from renewable feedstocks such as palm oil, soybean oil, sunflower oil, and waste oils, undergoes a hydrotreating process to produce drop-in diesel fuel that is compatible with existing infrastructure. The aviation industry is a significant market for HVO, with sustainable aviation fuels (SAFs) gaining traction as a viable alternative to conventional jet fuel. HVO-derived SAFs offer similar performance characteristics to fossil fuel-based jet fuel, making them an attractive option for airlines seeking to reduce their carbon footprint.
Hydrotreating plays a crucial role in the production of HVO, as it removes impurities and converts the vegetable oil into a consistent, high-quality product. The process also reduces the aromatic hydrocarbons content, making HVO a cleaner-burning fuel that emits fewer greenhouse gases than conventional diesel fuel. Emission regulations continue to drive demand for HVO in the transportation sector, with governments and organizations setting ambitious targets for reducing carbon emissions. HVO's ability to offer significant emissions reductions, up to 90% compared to conventional diesel fuel, makes it an attractive option for fleet operators and other industrial applications.
Cost optimization is a critical factor in the HVO market, with refineries seeking to maximize efficiency and minimize costs. Renewable resources, such as waste oils, offer a cost-effective feedstock option, making them an attractive choice for HVO production. The HVO market's continuous dynamism is reflected in the evolving patterns of market activities. The market's growth is underpinned by the ongoing demand for sustainable fuels, the increasing focus on reducing carbon emissions, and the development of new technologies and production methods. The market's future direction will be shaped by regulatory developments, technological advancements, and the availability of renewable feedstocks.
How is this Hydrotreated Vegetable Oil Industry segmented?
The hydrotreated vegetable oil industry research report provides comprehensive data (region-wise segment analysis), with forecasts and estimates in "USD billion" for the period 2025-2029, as well as historical data from 2019-2023 for the following segments.
- Source
- Food and feed crops
- Animal fats
- Application
- Sustainable aviation fuel
- Automotive fuel
- Others
- Distribution Channel
- B2B
- Direct Sales
- Online Retail
- End-User
- Energy Sector
- Food Manufacturers
- Industrial Users
- Geography
- North America
- US
- Canada
- Europe
- France
- Germany
- UK
- APAC
- China
- India
- Japan
- South Korea
- South America
- Brazil
- Rest of World (ROW)
- North America
By Source Insights
The food and feed crops segment is estimated to witness significant growth during the forecast period.
The hydrotreated vegetable oil (HVO) market is driven by the growing demand for renewable fuels, particularly in the transportation sector. HVO, a drop-in diesel fuel derived from various feedstocks such as vegetable oils (rapeseed, soybean, sunflower), animal fats, and waste oils, offers several advantages over conventional diesel fuel. Its production involves hydrotreating, a process that converts the feedstock into a diesel-like fuel with low emissions and improved performance. Alfa Laval, a leading industry player, specializes in producing renewable diesel and sustainable aviation fuels using advanced pretreatment systems. These systems ensure feedstocks, including edible and non-edible oils, are free from impurities to maintain the efficiency and longevity of the hydrotreating catalyst.
This focus on feedstock optimization is crucial in the context of increasing environmental regulations and the need for sustainable fuels. HVO's compatibility with diesel engines and its low carbon emissions make it an attractive alternative for the industrial sector, aviation industry, and even residential heating applications. As the world transitions towards emissions-free vehicles and a sustainable environment, the demand for HVO and other renewable fuels is expected to surge. Additionally, the production of HVO from renewable resources contributes to cost optimization and the reduction of greenhouse gas emissions.
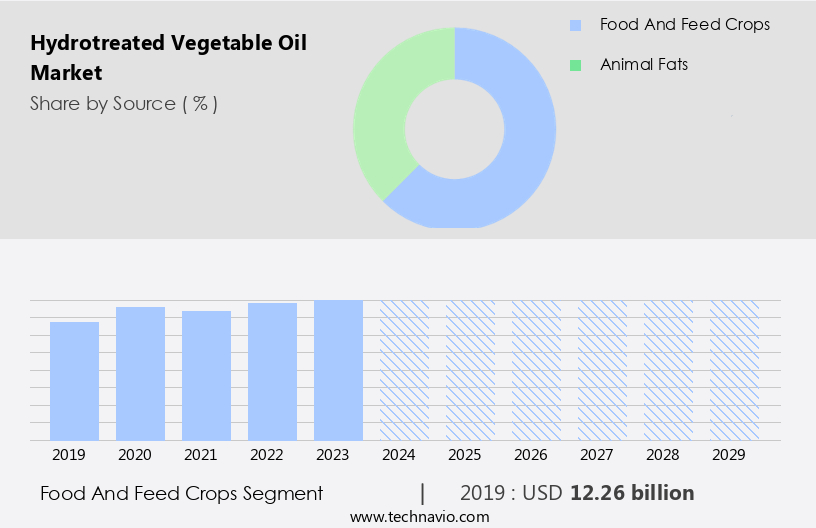
The Food and feed crops segment was valued at USD 12.26 billion in 2019 and showed a gradual increase during the forecast period.
Regional Analysis
North America is estimated to contribute 40% to the growth of the global market during the forecast period.Technavio's analysts have elaborately explained the regional trends and drivers that shape the market during the forecast period.

The North American hydrotreated vegetable oil (HVO) market is experiencing notable growth, fueled by expanding production and adoption across various sectors. The US plays a pivotal role in the regional HVO market, with production surpassing traditional biodiesel as of June 2024. According to the US Energy Information Administration (EIA), approximately 19.9 million tonnes of biodiesel, including HVO, were produced in the US in 2023. This substantial volume underscores the country's commitment to renewable fuels and reducing greenhouse gas emissions. In the industrial sector, companies like Digital Realty, a leading colocation firm, have adopted HVO for backup generators in the US.
HVO's low maintenance and drop-in compatibility with diesel engines make it an attractive alternative to conventional diesel fuel. Furthermore, HVO's production from renewable resources, such as rapeseed oil, soybean oil, sunflower oil, and waste oils, aligns with environmental goals and sustainability initiatives. The aviation industry also seeks to integrate HVO into its fuel mix, with sustainable aviation fuels derived from HVO being a promising solution for reducing carbon emissions. HVO's compatibility with jet fuel, which contains aromatic hydrocarbons, enables seamless integration into the existing fuel infrastructure. Additionally, HVO production from feedstocks like palm oil can contribute to cost optimization and adherence to emission regulations.
In summary, the North American HVO market is experiencing growth driven by increasing production, adoption across various sectors, and the commitment to renewable fuels and reducing greenhouse gas emissions. Companies in the industrial sector, such as Digital Realty, are embracing HVO for its low maintenance and compatibility with diesel engines. The aviation industry also sees potential in HVO as a sustainable aviation fuel, contributing to emissions reduction and sustainable environmental goals.
Market Dynamics
Our researchers analyzed the data with 2024 as the base year, along with the key drivers, trends, and challenges. A holistic analysis of drivers will help companies refine their marketing strategies to gain a competitive advantage.
B2B renewable energy solutions harness cutting-edge HVO refining processes to deliver eco-friendly fuels. HVO market expansion 2025 targets biofuel for aviation sector and low-carbon diesel alternatives, addressing sustainability goals. HVO distribution optimization tools enhance logistics, while HVO sector competitive insights feature leaders like Neste. Green HVO production methods align with renewable energy innovations. HVO regulatory frameworks 2025-2029 guide HVO adoption in Europe 2025. Advanced HVO formulations and HVO market forecasts drive demand. HVO for shipping industry and specialized HVO blends serve niche markets. HVO industry barriers and strategies tackle supply chain constraints, with HVO procurement innovations and HVO cost management solutions improving margins. HVO market intelligence and sustainable fuel advancements foster growth.
What are the key market drivers leading to the rise in the adoption of Hydrotreated Vegetable Oil Industry?
- The supportive measures implemented by the government serve as the primary catalyst for market growth.
- The global hydrotreated vegetable oil (HVO) market is experiencing substantial growth due to government initiatives encouraging the use of renewable fuels. In July 2024, the French government approved the sale of 100% HVO, known as HVO100, for all user segments, marking a significant shift in the market. Previously, logistics companies with dedicated fuel supply networks were the only ones permitted to purchase and use HVO100. This regulatory change, announced by Finnish biofuel producer Neste, is a crucial step towards increasing the adoption of HVO and other sustainable energy sources. HVO is a renewable fuel produced through hydroprocessing, which converts vegetable oils or animal fats into diesel-like fuel.
- This process results in a product with excellent performance characteristics, including low maintenance requirements, high energy density, and compatibility with diesel engines. HVO can be produced from various feedstocks, such as ethanol or pyrolysis oil derived from rapeseed oil. The market dynamics are driven by the environmental benefits of using renewable fuels, increasing demand for low-carbon transportation solutions, and the potential for product differentiation in the fuel industry.
What are the market trends shaping the Hydrotreated Vegetable Oil Industry?
- Eco-friendly fuel adoption is becoming a mandatory market trend. Professionals and organizations are increasingly prioritizing the use of sustainable fuel options to reduce their carbon footprint.
- The global hydrotreated vegetable oil (HVO) market is experiencing a notable transition towards sustainable fuel alternatives, fueled by escalating emission regulations and the automotive industry's commitment to reducing carbon emissions. HVO, a biofuel derived from renewable resources like used vegetable oils, animal fats, and waste cooking oils, is gaining traction as a viable replacement for conventional diesel. In November 2024, Stellantis announced that its entire fleet of cars and light-duty commercial vehicles is now compatible with HVO diesel fuel, signaling the automotive sector's growing preference for eco-friendly options. The hydrogenation process employed in HVO production generates a cleaner fuel, free of sulfur and featuring significantly lower levels of aromatic hydrocarbons and pollutants.
- This shift towards HVO is expected to significantly impact the aviation industry as well, with sustainable aviation fuels derived from HVO gaining momentum. The adoption of HVO as a drop-in diesel fuel and jet fuel alternative is poised to contribute to a more sustainable energy landscape while reducing carbon emissions.
What challenges does the Hydrotreated Vegetable Oil Industry face during its growth?
- The volatility in the prices of raw materials poses a significant challenge to the industry's growth trajectory.
- The market experiences volatility due to the price fluctuations of its primary raw materials, particularly soybean oil and sunflower oil. Global factors contribute to these price variations, affecting market stability and predictability. For instance, between June 2023 and June 2024, cottonseed oil prices rose from USD 10 to USD12 per 10 kg, soybean oil prices surged from USD10 to USD15 per 10 kg, and rice bran oil saw an increase from USD 8 to USD14 per 10 kg. These price hikes result from disruptions in the global supply chain. Hydrotreated vegetable oil, also known as HVO, is a crucial component in various industries, including residential heating and renewable fuels.
- Its use in emissions-free vehicles is increasing due to the focus on reducing greenhouse gas emissions. Hydrotreated vegetable oil receives renewable identification numbers (RINs), making it eligible for tax incentives under the Renewable Fuel Standard (RFS) program in the United States. Despite these advantages, the market's growth remains subject to the price trends of its raw materials.
Exclusive Customer Landscape
The hydrotreated vegetable oil market forecasting report includes the adoption lifecycle of the market, covering from the innovator's stage to the laggard's stage. It focuses on adoption rates in different regions based on penetration. Furthermore, the hydrotreated vegetable oil market report also includes key purchase criteria and drivers of price sensitivity to help companies evaluate and develop their market growth analysis strategies.

Customer Landscape
Key Companies & Market Insights
Companies are implementing various strategies, such as strategic alliances, hydrotreated vegetable oil market forecast, partnerships, mergers and acquisitions, geographical expansion, and product/service launches, to enhance their presence in the industry.
Archer Daniels Midland Co. - This company specializes in hydrotreated vegetable oils, providing a diverse range of modified and customized solutions within its extensive portfolio. These oils undergo hydroprocessing to enhance their stability and performance characteristics, making them suitable for various industries and applications.
The industry research and growth report includes detailed analyses of the competitive landscape of the market and information about key companies, including:
- Archer Daniels Midland Co.
- Axens group
- Bhushan Oils and Fats Pvt. Ltd.
- Bunge Ltd.
- Cargill Inc.
- Chemcopia Ingredients Pvt. Ltd.
- Clariant International Ltd
- Eni SpA
- Evonik Industries AG
- Gokul Agri International Ltd.
- Hefei Home Sunshine Pharmaceutical Technology Co. Ltd
- Neste Corp.
- SDM Fuel Solutions
- Topsoes AS
- Wilmar International Ltd.
Qualitative and quantitative analysis of companies has been conducted to help clients understand the wider business environment as well as the strengths and weaknesses of key industry players. Data is qualitatively analyzed to categorize companies as pure play, category-focused, industry-focused, and diversified; it is quantitatively analyzed to categorize companies as dominant, leading, strong, tentative, and weak.
Recent Development and News in Hydrotreated Vegetable Oil Market
- In January 2024, Archer Daniels Midland Company (ADM) announced the expansion of its hydrotreated vegetable oil (HVO) production capacity at its Decatur, Illinois, facility. The USD250 million investment aimed to increase HVO production by 100 million gallons per year, making it one of the largest producers in North America (ADM press release, 2024).
- In March 2024, Royal Dutch Shell and LanzaTech signed a strategic partnership to produce HVO from waste gas using LanzaTech's Gas Fermentation Technology. The collaboration aimed to reduce carbon emissions by producing HVO from industrial emissions, marking a significant step towards sustainable biofuels (Shell press release, 2024).
- In May 2024, Renewable Energy Group (REG) announced the acquisition of Biodiesel Productions, LLC, a leading producer of HVO in the United States. The acquisition expanded REG's production capacity by 100 million gallons per year and strengthened its position in the HVO market (REG press release, 2024).
- In April 2025, the European Union approved the Renewable Energy Directive II, increasing the mandatory biofuel share in the EU's transport sector to 14% by 2030. This policy change is expected to boost the demand for HVO as a sustainable alternative to fossil fuels (European Commission press release, 2025).
Research Analyst Overview
- The market is experiencing significant growth as businesses and governments prioritize energy efficiency and carbon footprint reduction. Green fuel innovation is at the forefront of this trend, with renewable fuel standards driving the demand for bio-derived fuels as sustainable transportation alternatives. Green technology and green materials are integral to this shift, as low carbon fuels like hydrotreated vegetable oil contribute to climate change mitigation. Sustainable manufacturing and agriculture are also key players in the bio-refinery process, which converts renewable feedstocks into bio-based fuels and materials. Green chemistry is a crucial component of this process, optimizing production methods to minimize waste and emissions.
- Biodiesel blending is a common approach to incorporating hydrotreated vegetable oil into the transportation fuel mix, reducing the carbon emissions of diesel fuel alternatives. Biofuel policy and infrastructure development are essential to the growth of this market, as governments and industries invest in renewable fuel production and distribution. The sustainable mobility sector is embracing green diesel production as a viable solution for low emissions transportation. Alternative fuels like hydrotreated vegetable oil are increasingly seen as eco-friendly solutions for industries seeking to reduce their carbon footprint and contribute to environmental sustainability.
Dive into Technavio's robust research methodology, blending expert interviews, extensive data synthesis, and validated models for unparalleled Hydrotreated Vegetable Oil Market insights. See full methodology.
|
Market Scope |
|
|
Report Coverage |
Details |
|
Page number |
205 |
|
Base year |
2024 |
|
Historic period |
2019-2023 |
|
Forecast period |
2025-2029 |
|
Growth momentum & CAGR |
Accelerate at a CAGR of 13.3% |
|
Market growth 2025-2029 |
USD 20.11 billion |
|
Market structure |
Fragmented |
|
YoY growth 2024-2025(%) |
12.0 |
|
Key countries |
US, Canada, UK, China, Japan, Germany, India, Brazil, France, and South Korea |
|
Competitive landscape |
Leading Companies, Market Positioning of Companies, Competitive Strategies, and Industry Risks |
What are the Key Data Covered in this Hydrotreated Vegetable Oil Market Research and Growth Report?
- CAGR of the Hydrotreated Vegetable Oil industry during the forecast period
- Detailed information on factors that will drive the growth and forecasting between 2025 and 2029
- Precise estimation of the size of the market and its contribution of the industry in focus to the parent market
- Accurate predictions about upcoming growth and trends and changes in consumer behaviour
- Growth of the market across North America, Europe, APAC, South America, and Middle East and Africa
- Thorough analysis of the market's competitive landscape and detailed information about companies
- Comprehensive analysis of factors that will challenge the hydrotreated vegetable oil market growth of industry companies
We can help! Our analysts can customize this hydrotreated vegetable oil market research report to meet your requirements.
 RIA -
RIA - 
