
Indoor Plants Market Size 2025-2029
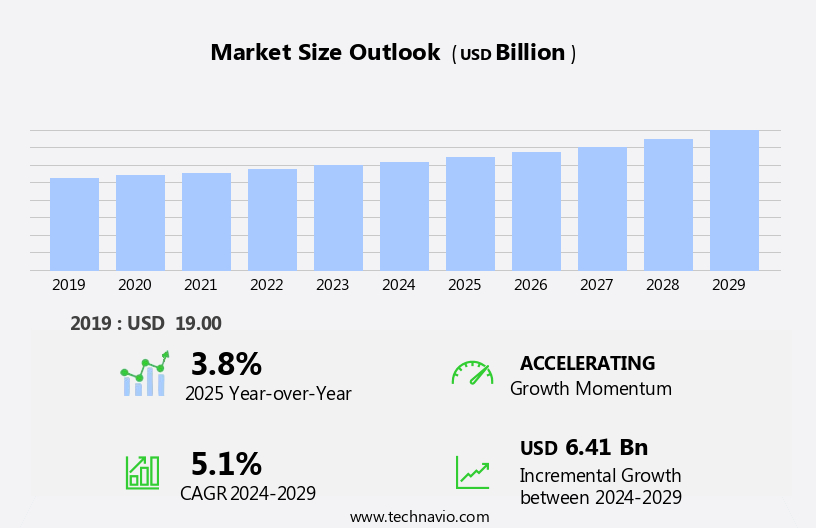
The indoor plants market size is forecast to increase by USD 6.41 billion at a CAGR of 5.1% between 2024 and 2029.
- The market is experiencing significant growth, driven primarily by the increasing trend towards indoor gardening and the integration of smart technology. The rise in urbanization and the growing awareness of the health benefits of having plants at home have fueled the demand for indoor plants. The market is further propelled by the development and adoption of advanced technologies, such as smart indoor gardener and smart home which enable automated watering, temperature control, and light regulation. However, the market also faces challenges, including the need for effective pest and disease management. The use of chemical pesticides is a concern for consumers, leading to a growing demand for organic and natural solutions.
- Companies in the market must respond to these trends and challenges by offering innovative, technology-driven solutions that cater to the evolving needs of consumers while ensuring sustainable and eco-friendly practices. By focusing on these areas, companies can capitalize on the growing demand for indoor plants and differentiate themselves in a competitive market.
What will be the Size of the Indoor Plants Market during the forecast period?
- Indoor plants continue to gain popularity in various sectors as consumers seek to enhance their living and working spaces with vibrant foliage and botanical wonders. Aesthetic enhancers, such as unique plant varieties and desk-friendly options, are increasingly integrated into home office spaces, fostering productivity and focus. Customer education plays a crucial role in this market, as individuals navigate the intricacies of watering, plant care tips, and maintenance. Anxiety and mental health conditions are driving demand for indoor plants, with their stress-reducing properties and air quality benefits becoming more widely recognized. The remote work culture has further fueled this trend, as people create personal spaces filled with greenery and eco-friendly items to improve their well-being.
- Foliage plants, DIY projects, and versatile plant collections cater to diverse consumer preferences, while temperature and humidity considerations influence the choice of plant species. Humidity-loving plants, such as peace lilies and fiddle leaf figs, require specific conditions, while succulents and cacti thrive in warmer, drier environments. Sustainability and cost-effectiveness are essential factors in the market, with consumers turning to organic soil, smart planters, and automated watering systems. Air purification, allergy relief, and mold prevention are additional benefits, making indoor plants an attractive choice for health and wellness-conscious individuals. The market's continuous dynamism is reflected in the emergence of plant brands, social media influencers, and specialty stores, as well as the integration of technology, such as LED grow lights and aquaponics, into indoor gardening.
How is this Indoor Plants Industry segmented?
The indoor plants industry research report provides comprehensive data (region-wise segment analysis), with forecasts and estimates in "USD billion" for the period 2025-2029, as well as historical data from 2019-2023 for the following segments.
- Type
- Foliage plants
- Flowering plants
- Succulents
- Others
- End-user
- Residential
- Commercial
- Application
- Home Decoration
- Air Purification
- Shade Type
- Loving Plants
- Low Light Plants
- High Light Plants
- Distribution Channel
- Offline Retail
- Online Retail
- Geography
- North America
- US
- Canada
- Europe
- France
- Germany
- UK
- Middle East and Africa
- UAE
- APAC
- Australia
- China
- India
- Japan
- South America
- Brazil
- Rest of World (ROW)
- North America
By Type Insights
The foliage plants segment is estimated to witness significant growth during the forecast period.
Indoor plants, particularly foliage varieties, have gained significant attention in the US market due to their ability to enhance aesthetic appeal, provide versatility, and contribute to mental and physical well-being. Foliage plants offer a diverse range of textures, shapes, and colors, making them an ideal choice for home office spaces and personal spaces. Their unique appearance, coupled with minimal watering and care requirements, aligns perfectly with the remote work culture and increasing consumer interest in indoor gardening. Mental health conditions, such as anxiety and depression, have also fueled the demand for these plants, as they offer stress reduction and relaxation benefits.
Botanical wonders, like peace lilies and fiddle leaf figs, add a touch of exoticism and uniqueness to indoor spaces. DIY plant projects and eco-friendly items, such as smart planters and environmentally friendly containers, have further boosted the market's growth. Consumer education and plant care tips, readily available online and through social media influencers, have played a crucial role in increasing customer awareness and loyalty. Air quality concerns, including mold and air pollution, have also driven the market's expansion, as indoor plants help purify the air and improve overall indoor air quality. Sustainability and cost-effectiveness have further solidified the popularity of indoor plants.
Technologies like aquaponics and LED grow lights have made it easier for consumers to cultivate plants indoors, while automated watering systems ensure minimal maintenance. The versatility of foliage plants, along with their ability to thrive in various temperatures and humidity levels, makes them a desirable addition to any home decor. Flowering plants, succulents, and exotic varieties continue to be popular choices, as they add vibrant blooms and a sense of exoticism to indoor spaces. Horticultural therapy and the use of plants for mental health conditions have also gained traction, highlighting the importance of indoor greenery in promoting overall well-being.
In summary, the market in the US has witnessed substantial growth due to the combination of their aesthetic appeal, versatility, and health benefits. Foliage plants, in particular, have emerged as a preferred choice for enhancing interior spaces, contributing to mental and physical wellness, and creating a harmonious living environment.
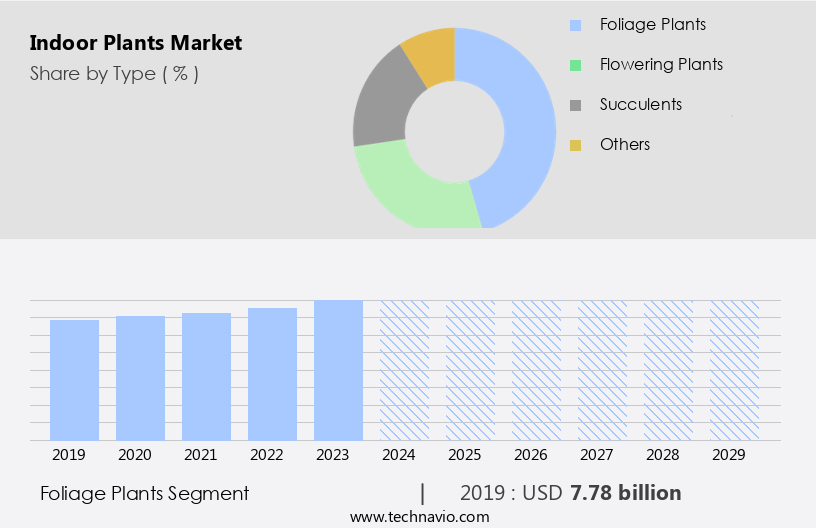
The Foliage plants segment was valued at USD 7.78 billion in 2019 and showed a gradual increase during the forecast period.
Regional Analysis
North America is estimated to contribute 50% to the growth of the global market during the forecast period.Technavio's analysts have elaborately explained the regional trends and drivers that shape the market during the forecast period.
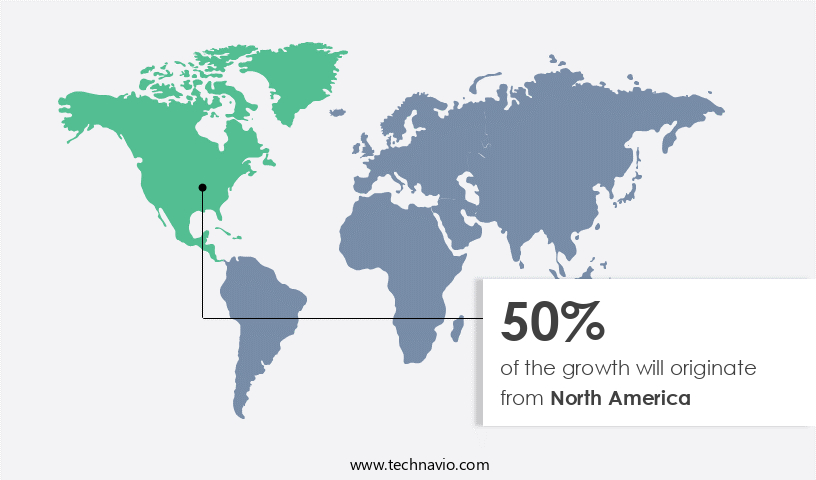
The North American the market, comprising the United States and Canada, is experiencing a notable expansion as these plants increasingly become essential components of home decor. This trend is fueled by the dual advantages of space enhancement and personalization. Indoor plants contribute to the creation of a cozy and distinctive ambiance, be it through a prominent, eye-catching specimen or an assortment of smaller plants on shelves. This personalization resonates with contemporary interior design tendencies that prioritize minimalism and natural elements, fostering peaceful surroundings. Indoor plants' aesthetic appeal is a significant reason for their widespread appeal. They introduce a touch of nature into indoor settings, making them more inviting and visually engaging.
Foliage plants, succulents, and flowering varieties, among others, offer a unique appearance and versatility, catering to various preferences and spaces. DIY plant projects and customer education further fuel the market, allowing individuals to engage with their plants on a deeper level. Plants contribute to improved mental health by reducing anxiety and mental health conditions, making them an essential addition to home office spaces and remote work cultures. They also help purify the air, removing toxins and improving indoor air quality. Sustainability is another factor driving the market, with consumers increasingly opting for eco-friendly items, such as organic soil, smart planters, and environmentally friendly containers.
Indoor gardening has gained traction as a lifestyle choice, with consumers seeking to create aesthetically pleasing plant setups, including exotic and botanical wonders. Social media influencers have played a role in popularizing indoor plants, showcasing their unique appearance and the benefits they bring to daily life. Maintaining indoor plants requires attention to watering, humidity, temperature, and sunlight. Proper care, including water vapor, trimming, and plant care tips, is essential for their survival and vibrant blooms. With the increasing popularity of automated watering systems, maintaining indoor plants has become more convenient and accessible. Indoor plants offer numerous benefits, including stress reduction, allergy relief, and relaxation.
They can also help combat mold and improve overall well-being. The market includes a diverse range of plant varieties, from fiddle leaf figs and palm plants to peace lilies and cacti, catering to various preferences and spaces. Garden centers, specialty stores, and online retailers offer a wide selection of indoor plants, making them easily accessible to consumers. The cost-effectiveness of indoor plants, combined with their long-term benefits, makes them an attractive investment for consumers seeking to create a personalized, eco-friendly, and aesthetically pleasing living environment.
Market Dynamics
Our researchers analyzed the data with 2024 as the base year, along with the key drivers, trends, and challenges. A holistic analysis of drivers will help companies refine their marketing strategies to gain a competitive advantage.
What are the key market drivers leading to the rise in the adoption of Indoor Plants Industry?
- The significant surge in consumer interest towards indoor gardening is the primary factor fueling market growth in this sector.
- The market is experiencing notable growth due to the rising popularity of indoor gardening among various demographics, particularly the millennial generation. This trend is driven by the desire for aesthetic enhancers and the connection with nature, even in urban settings. Indoor plant ownership has gained significant traction, with an increasing number of individuals embracing the hobby as an alternative to traditional gardening. This shift is evident in the rise of desk-friendly plants and the integration of greenery into home office spaces. Individuals are increasingly seeking plant varieties that require minimal maintenance and can thrive indoors, such as snake plants, pothos, and succulents.
- Customer education and DIY plant projects are also on the rise, with many individuals turning to online resources for plant care tips and unique appearance enhancements. Indoor plants offer numerous benefits, including stress reduction, improved mental health conditions, and air quality improvement. They can help reduce anxiety and mold, making them an excellent addition to personal spaces. Moreover, they add a unique appearance to any room and provide versatility in terms of placement and care requirements. Indoor plants also offer the added benefits of humidity regulation and water vapor production, making them an excellent investment for both personal and professional spaces. With the increasing trend of remote work culture, indoor plants have become an essential component of creating a productive and healthy work environment.
What are the market trends shaping the Indoor Plants Industry?
- Smart sensor integration is an emerging market trend, mandated by the increasing demand for advanced technology in various industries. This innovation enhances system functionality and efficiency through real-time data collection and analysis.
- The market is experiencing significant growth due to the increasing focus on sustainability and temperature control in modern living spaces. With urbanization on the rise, there is a heightened demand for vibrant blooms that can thrive indoors, leading to an increase in consumer interest in gardening. This trend is further fueled by the air purification benefits of indoor plants, which help reduce toxins and improve mental health. Smart technology is revolutionizing indoor gardening, with the integration of sensors and automation systems becoming increasingly popular. For instance, the introduction of the Smart Soil Moisture Sensor by THIRDREALITY enables accurate monitoring of soil moisture levels, promoting cost-effectiveness and water conservation.
- This IP67 waterproof and dustproof device is suitable for both indoor and outdoor applications and can be easily integrated into Zigbee-enabled smart home systems. Moreover, the use of sustainable gardening methods, such as aquaponics and LED grow lights, is gaining traction as consumers become more conscious of their environmental impact. Succulent plants, in particular, have gained popularity due to their low maintenance requirements and aesthetic appeal. Overall, the market is poised for continued growth as more people seek to bring the benefits of greenery into their homes and workplaces.
What challenges does the Indoor Plants Industry face during its growth?
- Pest and disease management pose significant challenges to the growth of the industry, requiring continuous efforts from professionals to mitigate their impact and ensure sustainable development.
- Indoor plants have gained significant popularity in recent years for their aesthetic appeal and contribution to health and wellness. From flowering plants and foliage varieties to exotic species, plant collections continue to be a significant trend in interior decoration and lifestyle branding. However, maintaining indoor plants presents unique challenges, particularly in managing pests and diseases. These issues can lead to substantial plant losses and customer dissatisfaction. Pests, such as spider mites, aphids, and mealybugs, as well as fungal and bacterial diseases, can rapidly spread through plant collections. The use of pesticides and chemical treatments to control these infestations is a concern for many consumers, who prefer organic or eco-friendly items.
- Horticultural therapy and the mental health benefits of caring for plants have also contributed to the market's growth. Social media influencers continue to promote the aesthetic appeal of indoor plants, further driving demand. Despite these opportunities, managing pests and diseases remains a significant challenge for plant sellers. Ensuring that plants are healthy and pest-free before shipping is crucial to maintaining customer satisfaction and trust in plant brands.
Exclusive Customer Landscape
The indoor plants market forecasting report includes the adoption lifecycle of the market, covering from the innovator's stage to the laggard's stage. It focuses on adoption rates in different regions based on penetration. Furthermore, the indoor plants market report also includes key purchase criteria and drivers of price sensitivity to help companies evaluate and develop their market growth analysis strategies.
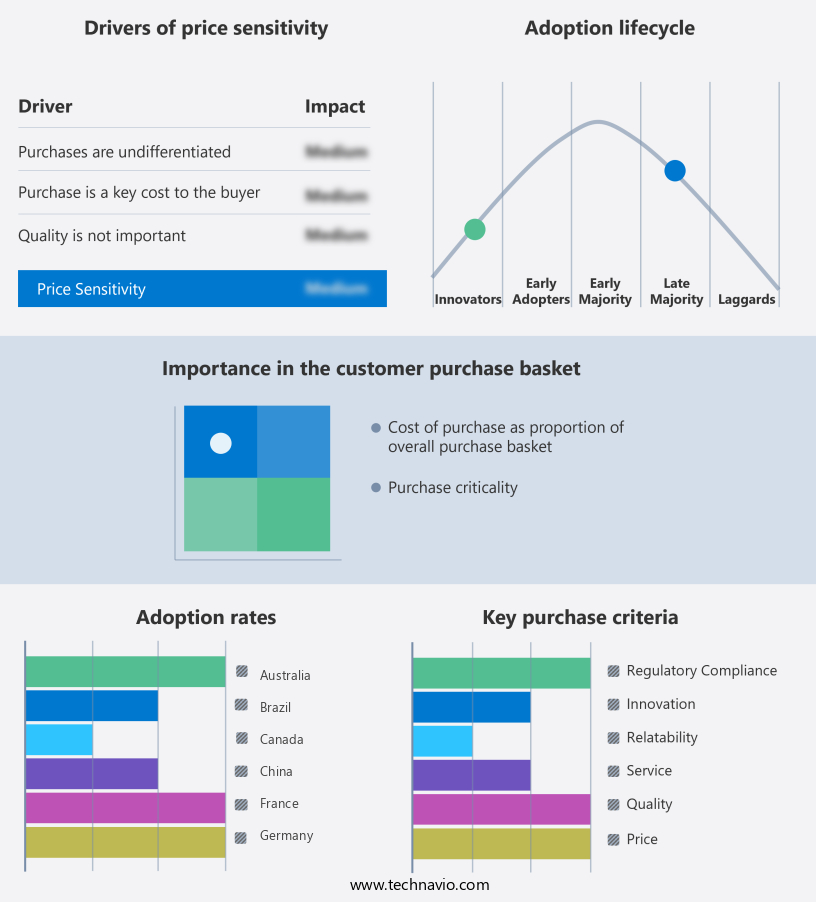
Customer Landscape
Key Companies & Market Insights
Companies are implementing various strategies, such as strategic alliances, indoor plants market forecast, partnerships, mergers and acquisitions, geographical expansion, and product/service launches, to enhance their presence in the industry.
Beekenkamp Verpakkingen B.V - This company specializes in an array of indoor plant offerings, featuring distinctive varieties such as begonia, campanula, celosia, dahlia, lavandula, osteospermum, and poinsettia. Our selection caters to diverse tastes and decor styles, ensuring a vibrant and unique touch to any living space. Each plant is carefully sourced and nurtured to guarantee optimal growth and longevity. By providing a diverse range of options, we aim to enhance the overall aesthetic appeal and air quality within homes and offices.
The industry research and growth report includes detailed analyses of the competitive landscape of the market and information about key companies, including:
- Beekenkamp Verpakkingen B.V
- Costa Farms LLC
- Double H Nurseries Ltd.
- Dummen Orange
- Dutch Flower Group
- Ferns N Petals Pvt. Ltd.
- Gardeners Supply Co.
- Home Depot Inc.
- Lowes Co. Inc.
- Marginpar BV
- Premier Planters
- Rentokil Initial Plc
- Rocket Farms Inc.
- Rolling Nature
- Rootly Plant Decor Pvt. Ltd.
- Santhi Online Plants
- Selecta Klemm GmbH and Co. KG
- The Sill Inc
- Urban Plant
- Walter Blom Plants BV
Qualitative and quantitative analysis of companies has been conducted to help clients understand the wider business environment as well as the strengths and weaknesses of key industry players. Data is qualitatively analyzed to categorize companies as pure play, category-focused, industry-focused, and diversified; it is quantitatively analyzed to categorize companies as dominant, leading, strong, tentative, and weak.
Recent Development and News in Indoor Plants Market
- In February 2023, Ikea, the renowned furniture retailer, announced the launch of its new plant subscription service, "Plant Deli," in collaboration with the Dutch company Planta. This service offers customers regular deliveries of handpicked plants and care instructions, aiming to make indoor gardening more accessible and convenient (Ikea Press Release, 2023).
- In April 2024, The Sill, a leading online houseplant retailer, secured a strategic partnership with Amazon to sell its plants and plant-related products directly on Amazon's platform. This collaboration significantly expanded The Sill's reach and customer base, making it easier for Amazon customers to purchase indoor plants and accessories (The Sill Press Release, 2024).
- In October 2024, HortiTech, a leading technology provider for the horticulture industry, raised USD15 million in a Series B funding round. This investment will be used to develop advanced technologies for indoor farming and plant monitoring, aiming to improve crop yields and optimize resource usage (Crunchbase News, 2024).
- In January 2025, the European Union introduced new regulations on the import and sale of certain indoor plants due to concerns over invasive species. This policy change will require importers to obtain permits and undergo regular inspections, aiming to prevent the spread of harmful plant species (EU Commission Press Release, 2025).
Research Analyst Overview
Indoor plants have emerged as a significant market trend, with an increasing number of plant enthusiasts transforming their living spaces into lush, green havens. Tropical plants, in particular, have gained popularity due to their ability to purify the air through toxin absorption. The plant-friendly home decor movement encourages urban gardening, leading to a demand for a plant selection guide and various plant-related accessories. Indoor plant styling is a key focus for businesses catering to this market, with biophilic design and plant-inspired art gaining traction. Temperature regulation and sunlight are crucial factors in maintaining plant health, leading to the development of plant care tips and plant lighting solutions.
The versatility of indoor plants extends to their application in interior decoration, horticultural therapy, vertical gardening and lifestyle branding. Indoor plants not only add aesthetic appeal to personal spaces but also contribute to improved air quality, mental health, and overall well-being. As urbanization continues, the demand for indoor plants as air pollution solutions and stress reducers is expected to grow.
Urban gardening enthusiasts are also concerned with plant pests and mold growth, necessitating the need for plant identification and a plant watering guide. The market analysis reveals a growing interest in plant-based living, with a green thumb becoming a desirable trait. Plant therapy, eco-friendly plants, and plant propagation are other areas of growth. Succulent care and low-maintenance plants cater to those with busy schedules, while plant-themed events and plant-based lifestyle offerings provide unique plant varieties and focus enhancement opportunities. The indoor jungle and urban jungle trends continue to inspire innovation in the indoor plant market.
Dive into Technavio's robust research methodology, blending expert interviews, extensive data synthesis, and validated models for unparalleled Indoor Plants Market insights. See full methodology.
|
Market Scope |
|
|
Report Coverage |
Details |
|
Page number |
202 |
|
Base year |
2024 |
|
Historic period |
2019-2023 |
|
Forecast period |
2025-2029 |
|
Growth momentum & CAGR |
Accelerate at a CAGR of 5.1% |
|
Market growth 2025-2029 |
USD 6.41 billion |
|
Market structure |
Fragmented |
|
YoY growth 2024-2025(%) |
3.8 |
|
Key countries |
US, China, Germany, Japan, UK, Australia, India, France, Brazil, Canada, Brazil, UAE, Australia, Rest of World (ROW), and Saudi Arabia |
|
Competitive landscape |
Leading Companies, Market Positioning of Companies, Competitive Strategies, and Industry Risks |
What are the Key Data Covered in this Indoor Plants Market Research and Growth Report?
- CAGR of the Indoor Plants industry during the forecast period
- Detailed information on factors that will drive the growth and forecasting between 2025 and 2029
- Precise estimation of the size of the market and its contribution of the industry in focus to the parent market
- Accurate predictions about upcoming growth and trends and changes in consumer behaviour
- Growth of the market across North America, Europe, APAC, South America, and Middle East and Africa
- Thorough analysis of the market's competitive landscape and detailed information about companies
- Comprehensive analysis of factors that will challenge the indoor plants market growth of industry companies
We can help! Our analysts can customize this indoor plants market research report to meet your requirements.
 RIA -
RIA - 
