Inhalation Anesthesia Market Size 2025-2029
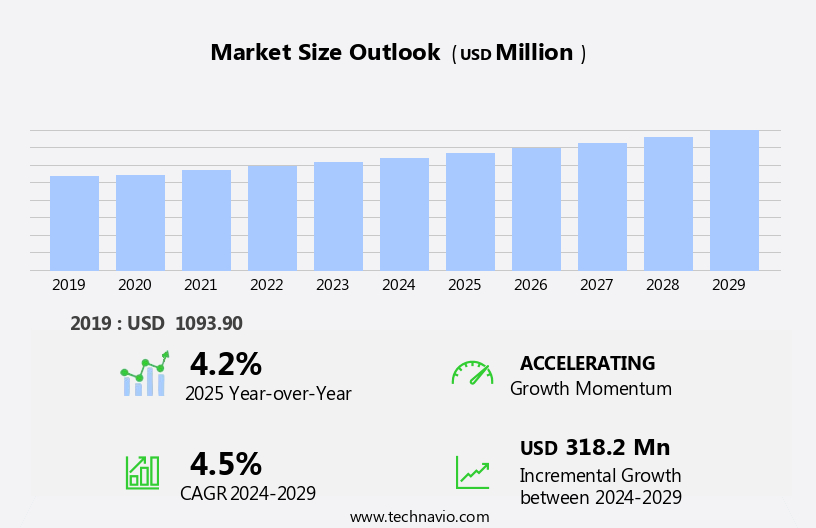
The inhalation anesthesia market size is forecast to increase by USD 318.2 million at a CAGR of 4.5% between 2024 and 2029.
- The market is experiencing significant growth, driven by the rising prevalence of cancer and the increasing number of surgeries. According to the American Cancer Society, an estimated 1.9 million new cancer cases are projected to be diagnosed in the United States in 2021. Many of these patients will require surgery, leading to increased demand for inhalation anesthesia. Additionally, the number of surgeries performed globally is anticipated to reach over 310 million by 2026, further fueling market growth. Inhalation anesthesia is a crucial aspect of the healthcare industry, with anesthesia drugs such as nitrous oxide playing a significant role in pain management during surgeries. The market for inhalation anesthesia is witnessing notable trends, including the integration of telemedicine and digital health in anesthesia delivery. Ambulatory surgical centers and greenhouse gas reduction initiatives are also driving market growth. However, the market faces challenges due to stringent regulations regarding the usage of inhalation anesthesia.
- These regulations aim to ensure patient safety and effective anesthesia delivery, but they can increase the cost of production and distribution. Companies operating in this market must navigate these regulations to successfully capitalize on the growing demand for inhalation anesthesia. Effective regulatory compliance strategies and continuous innovation in anesthesia delivery technologies will be crucial for market success.
What will be the Size of the Inhalation Anesthesia Market during the forecast period?
- The market continues to evolve, shaped by ongoing advancements and applications across various sectors. Critical care settings utilize advanced anesthesia machines and monitoring devices to ensure patient safety during complex procedures. Anesthesia services in ambulatory surgery centers prioritize patient satisfaction through automated delivery systems and outpatient-friendly breathing circuits. Surgical procedures, including endoscopic and robotic, necessitate precise anesthesia delivery and closed-loop systems for optimal patient outcomes. Pharmacodynamic and pharmacokinetic studies fuel the development of new anesthetic agents and anesthesia protocols. General anesthesia, regional anesthesia, and nitrous oxide applications undergo continuous refinement, with a focus on patient safety, best practices, and minimizing adverse events.
- Halogenated anesthetics and non-halogenated inhaled anesthetics each offer unique benefits for specific procedures. Anesthesia provider teams, including anesthesia technicians, adhere to clinical practice guidelines and anesthesia care standards. Drug interactions and concentration monitoring remain critical considerations for anesthesia delivery systems, which integrate with electronic medical records for efficient anesthesia record keeping. Inhalational anesthetics, anesthesia circuits, and anesthesia workstations undergo constant innovation to meet the evolving needs of clinical practice. Quality improvement initiatives and safety studies drive the integration of advanced technologies, such as precision delivery and pain management systems, into anesthesia care. Dental anesthesia, geriatric anesthesia, obstetric anesthesia, and emergency medicine all benefit from these advancements, ensuring optimal patient care and outcomes.
- The market remains a dynamic and ever-changing landscape, with ongoing research and development shaping its future applications.
How is this Inhalation Anesthesia Industry segmented?
The inhalation anesthesia industry research report provides comprehensive data (region-wise segment analysis), with forecasts and estimates in "USD million" for the period 2025-2029, as well as historical data from 2019-2023 for the following segments.
- Product
- Sevoflurane
- Desflurane
- ISoflurane
- Nitrous Oxide
- Halothane
- Others
- Application
- Maintenance
- Induction
- Sedation/Emergency Use
- End-user
- Hospitals
- Ambulatory Surgical Centers
- Specialty C
- Academic and Research Institutionslinics
- Veterinary Clinics
- Route of Administration
- Anesthesia Machines
- Vaporizers
- Portable Inhalers
- Procedure Type
- General Surgery
- Orthopedic Surgery
- Cardiac Surgery
- Pediatric Surgery
- Others
- Distribution Channel
- Direct Sales
- Distributors
- Online Channels
- Geography
- North America
- US
- Canada
- Europe
- France
- Germany
- Italy
- UK
- APAC
- China
- India
- Japan
- South Korea
- Rest of World (ROW)
- North America
By Product Insights
The sevoflurane segment is estimated to witness significant growth during the forecast period.
The market encompasses various entities, including pediatric anesthesia, aerosol delivery, pharmacodynamic studies, anesthetic agents, clinical practice guidelines, endoscopic surgery, regional anesthesia, drug concentration monitoring, nitrous oxide, inhaled anesthetics, monitoring devices, reusable circuits, anesthesia services, ambulatory surgery, pharmacokinetic studies, clinical trials, geriatric anesthesia, anesthesia provider, anesthesia technician, anesthesia care, volatile anesthetics, obstetric anesthesia, anesthesia record keeping, drug interactions, anesthesia delivery systems, electronic medical records, disposable circuits, robotic surgery, anesthesia protocols, dental anesthesia, critical care, anesthesia machines, patient satisfaction, automated delivery, surgical procedures, adverse events, general anesthesia, patient safety, best practices, halogenated anesthetics, postoperative recovery, efficacy studies, drug delivery, outpatient surgery, breathing circuits, closed-loop systems, anesthesia guidelines, anesthesia circuits, anesthesia workstations, inhalational anesthetics, quality improvement, minimally invasive surgery, safety studies, precision delivery, pain management, and non-halogenated anesthetics.
Sevoflurane, an inhaled anesthetic agent, is gaining popularity due to its effectiveness in geriatric anesthesia. Its use is increasing in dental, surgical, and gynecological procedures due to its affordability and ease of handling compared to other gases. In 2023, the preference for minimally invasive procedures led to a surge in demand for sevoflurane, contributing significantly to the growth of the market. Endoscopic surgery, a minimally invasive procedure, is increasingly being adopted for various surgical interventions, further fueling the demand for inhalation anesthetics like sevoflurane. Moreover, the advancements in anesthesia delivery systems, such as closed-loop systems and automated delivery, enable precise drug delivery and improved patient safety.
These systems are increasingly being integrated into clinical practice, enhancing the quality of anesthesia care. Additionally, the growing emphasis on patient satisfaction and postoperative recovery has led to the development of anesthesia protocols and guidelines to optimize patient outcomes. In conclusion, the market is witnessing significant growth due to the increasing demand for minimally invasive procedures, the adoption of advanced anesthesia delivery systems, and the development of anesthesia protocols and guidelines to ensure optimal patient outcomes. Sevoflurane, an inhaled anesthetic agent, is gaining popularity due to its effectiveness in geriatric anesthesia and ease of handling, contributing significantly to the growth of the market.
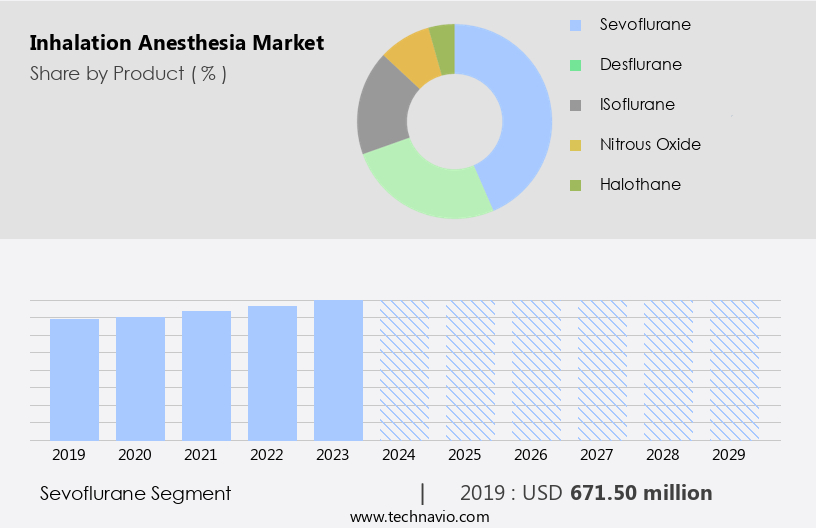
The Sevoflurane segment was valued at USD 671.50 million in 2019 and showed a gradual increase during the forecast period.
Regional Analysis
North America is estimated to contribute 40% to the growth of the global market during the forecast period.Technavio's analysts have elaborately explained the regional trends and drivers that shape the market during the forecast period.
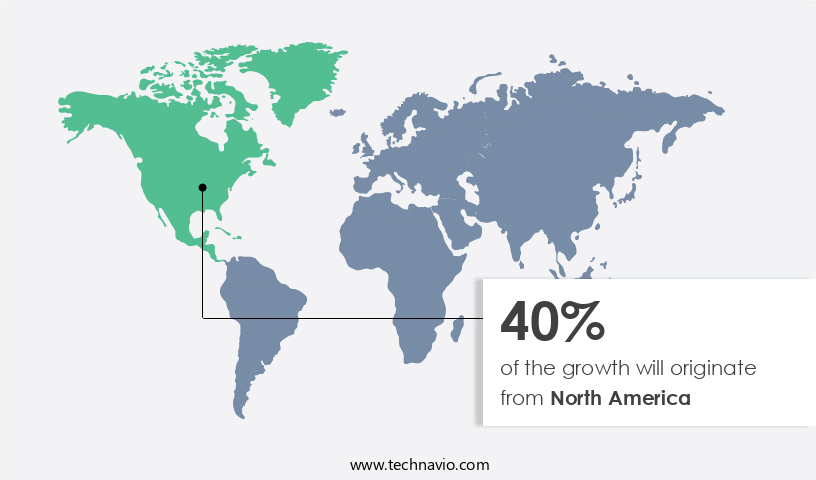
The market in North America is experiencing significant growth due to several factors. The increasing prevalence of chronic diseases necessitates an elevated demand for surgical procedures, leading to increased usage of anesthesia. In 2023, approximately 120 million Americans were living with at least one major chronic disease, such as heart disease, cancer, diabetes, obesity, or hypertension. Furthermore, around 1.9 million new cancer cases and 600,000 cancer-related deaths were reported in the US that year. Advanced technologies, like aerosol delivery systems, automated anesthesia delivery, and closed-loop systems, are gaining popularity due to their precision and efficacy in administering anesthetics.
The adoption of these technologies is also driven by the rising incidence of endoscopic surgeries, robotic procedures, and minimally invasive surgeries. Additionally, the increasing geriatric population and the presence of prominent anesthesia providers, anesthesia technicians, and healthcare institutions are further fueling market growth. Inhalational anesthetics, such as volatile and non-volatile agents, are widely used for general, pediatric, obstetric, dental, and critical care anesthesia. Anesthesia services, including anesthesia care, drug monitoring, and record keeping, are crucial components of the market. Patient safety, best practices, and quality improvement initiatives are essential considerations for anesthesia providers. Drug interactions, adverse events, and postoperative recovery are critical factors influencing patient satisfaction and clinical outcomes.
Pharmacodynamic and pharmacokinetic studies, clinical trials, and safety studies are ongoing to enhance the efficacy and safety of anesthetic agents. Inhalation anesthetics are also used in emergency medicine and veterinary medicine. The market is expected to continue its growth trajectory due to these trends and the increasing demand for advanced anesthesia delivery systems and pain management solutions.
Market Dynamics
Our researchers analyzed the data with 2024 as the base year, along with the key drivers, trends, and challenges. A holistic analysis of drivers will help companies refine their marketing strategies to gain a competitive advantage.
What are the key market drivers leading to the rise in the adoption of Inhalation Anesthesia Industry?
- The escalating incidence of cancer serves as the primary catalyst for market growth.
- Inhalation anesthesia plays a significant role in pediatric anesthesia and endoscopic surgery, offering immersive and harmonious experiences for patients. Anesthetic agents, such as nitrous oxide and inhaled anesthetics, are delivered via aerosol for effective analgesia and muscle relaxation. Pharmacodynamic and pharmacokinetic studies are essential to understand the drug's effects on the body and optimize clinical practice guidelines. Monitoring devices, including drug concentration monitoring, ensure safe administration and timely response adjustments. Reusable circuits and anesthesia services cater to the growing demand for ambulatory surgery.
- The increasing number of cancer cases in the US, projected to reach 2 million new cases and 600,000 deaths in 2025, will further fuel the need for anesthesia services as cancer surgery offers the best chance for a cure. Ensuring patient safety and comfort, inhalation anesthesia continues to be a vital aspect of clinical care.
What are the market trends shaping the Inhalation Anesthesia Industry?
- The trend in the healthcare industry is marked by an increasing number of surgeries being performed. This upward trend signifies a significant growth opportunity for medical professionals and related businesses.
- The market is witnessing notable expansion due to the rising number of surgical procedures worldwide. This growth can be attributed to various factors, including an increasing geriatric population, advancements in surgical techniques, and the growing prevalence of chronic diseases necessitating surgical intervention. Inhalation anesthesia, recognized for its precise control over anesthetic depth and swift recovery times, is gaining popularity for numerous surgical procedures. Technological innovations in anesthesia delivery systems, which amplify precision and patient safety, are further fueling market growth. Moreover, the demand for shorter hospital stays and outpatient surgical procedures is surging, leading to the increased adoption of inhalation anesthesia, as it facilitates quicker patient recovery and discharge.
- Clinical trials are continually being conducted to explore the efficacy and safety of volatile anesthetics, ensuring optimal anesthesia care. Anesthesia providers and technicians are meticulously documenting anesthesia records to minimize drug interactions and maintain accurate patient histories. The integration of electronic medical records and advanced anesthesia delivery systems, such as disposable circuits and robotic surgery, is revolutionizing anesthesia protocols. Dental anesthesia also benefits from the use of inhalation anesthesia, ensuring a more comfortable and efficient experience for patients.
What challenges does the Inhalation Anesthesia Industry face during its growth?
- The strict regulations governing the use of inhalation anesthesia pose a significant challenge to the growth of the industry. Adhering to these mandates adds complexity and cost to anesthesia delivery systems, potentially limiting market expansion.
- Inhalation anesthesia plays a crucial role in critical care settings, enabling effective patient management during surgical procedures. Anesthesia machines are essential tools in delivering anesthesia, ensuring automated delivery for optimal patient safety and satisfaction. However, the use of inhalation anesthetics, such as halogenated agents, carries potential risks, including adverse events during general anesthesia. These risks underscore the importance of adhering to best practices, including proper drug delivery, patient monitoring, and postoperative recovery. Governments worldwide prioritize patient safety, implementing stringent regulations to ensure the efficacy and safety of inhalation anesthetics. Regulatory authorities, such as the US FDA and Health Canada, require rigorous testing and certification for anesthesia machines and breathing circuits.
- These regulations aim to minimize the risks of therapeutic failure, disease exacerbation, and resistance to medicines, ultimately safeguarding patient well-being and confidence in healthcare systems. Efficacy studies and continuous research are essential to improve the safety and effectiveness of inhalation anesthesia. By focusing on best practices and regulatory compliance, healthcare professionals, pharmaceutical manufacturers, and distributors can ensure the highest standards of care for their patients.
Exclusive Customer Landscape
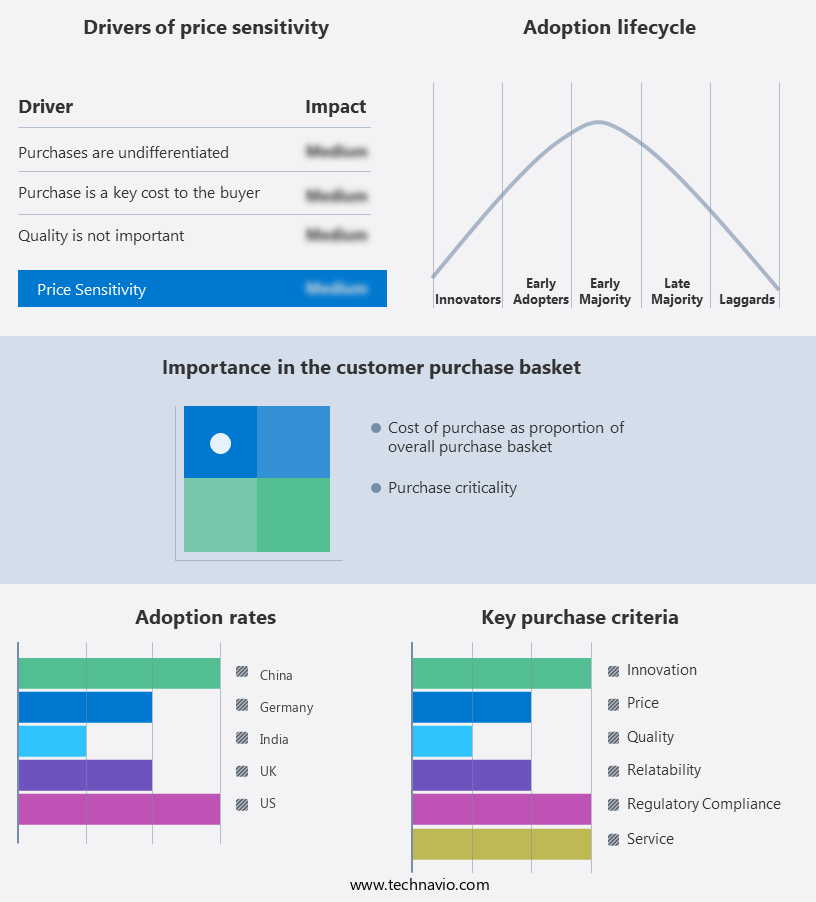
The inhalation anesthesia market forecasting report includes the adoption lifecycle of the market, covering from the innovator's stage to the laggard's stage. It focuses on adoption rates in different regions based on penetration. Furthermore, the inhalation anesthesia market report also includes key purchase criteria and drivers of price sensitivity to help companies evaluate and develop their market growth analysis strategies.
Customer Landscape
Key Companies & Market Insights
Companies are implementing various strategies, such as strategic alliances, inhalation anesthesia market forecast, partnerships, mergers and acquisitions, geographical expansion, and product/service launches, to enhance their presence in the industry.
AbbVie Inc. - Inhalation anesthesia, including Ultane, plays a crucial role in the medical field for inducing and maintaining general anesthesia during surgical procedures. This anesthetic method delivers anesthetic agents directly to the lungs, ensuring rapid onset and effective analgesia. Ultane, specifically, is a commonly used inhalation anesthetic, contributing significantly to the safety and efficiency of surgical interventions. Its application enhances patient comfort and reduces the risk of complications associated with traditional anesthesia administration methods.
The industry research and growth report includes detailed analyses of the competitive landscape of the market and information about key companies, including:
- AbbVie Inc.
- Baxter International Inc.
- Fresenius Kabi AG
- Halocarbon Life Sciences LLC.
- Hikma Pharmaceuticals Plc
- Lunan Pharmaceutical Group
- Maruishi Pharmaceutical Co. Ltd.
- Novartis AG
- Piramal Enterprises Ltd.
- Senko Medical Instrument Mfg. Co. Ltd.
Qualitative and quantitative analysis of companies has been conducted to help clients understand the wider business environment as well as the strengths and weaknesses of key industry players. Data is qualitatively analyzed to categorize companies as pure play, category-focused, industry-focused, and diversified; it is quantitatively analyzed to categorize companies as dominant, leading, strong, tentative, and weak.
Recent Development and News in Inhalation Anesthesia Market
- In January 2024, Merck KGaA, a leading pharmaceutical company, announced the launch of their innovative anesthesia product, Isoflurane 1%, for inhalation anesthesia, expanding their anesthesia portfolio (Merck KGaA, 2024). This new product is expected to offer improved efficiency and enhanced patient safety.
- In March 2025, Pfizer Inc. And General Electric Company (GE) entered into a strategic collaboration to develop a digital anesthesia system, integrating GE's anesthesia machines with Pfizer's anesthetics (Pfizer, 2025). This partnership aims to improve patient care and streamline the anesthesia administration process.
- In July 2024, Fresenius Kabi AG, a global healthcare company, completed the acquisition of Akorn Inc., a leading manufacturer of generic and branded injectable and inhalation anesthetics (Fresenius Kabi AG, 2024). This acquisition significantly strengthened Fresenius Kabi's position in the market.
- In October 2025, the U.S. Food and Drug Administration (FDA) approved the marketing of sevoflurane inhalation anesthesia for pediatric patients under the age of 3 (FDA, 2025). This approval expanded the usage of sevoflurane, a widely used inhalation anesthetic, in the pediatric population.
Research Analyst Overview
The anesthesia market encompasses various aspects, including workflow, equipment, protocols, gas management, vaporized anesthesia, research, education, licensing, and compliance. Anesthesia workflow optimization is a significant trend, with advanced technology streamlining processes and improving patient outcomes. Anesthesia equipment, such as anesthesia machines and monitors, continue to evolve, offering enhanced functionality and safety features. Anesthetic gas management systems ensure efficient and safe delivery of anesthesia gases, while anesthesia billing and reimbursement remain crucial aspects of practice management. Compliance with regulations, accreditation, certification, and standards is essential for maintaining a reputable anesthesia practice.
Inhaled drug delivery systems, anesthesia technology, and risk management tools are driving innovation in the market. Anesthesia coding, supplies, consumables, monitoring, and safety are integral components of effective anesthesia practice and patient care.
Dive into Technavio's robust research methodology, blending expert interviews, extensive data synthesis, and validated models for unparalleled Inhalation Anesthesia Market insights. See full methodology.
|
Market Scope |
|
|
Report Coverage |
Details |
|
Page number |
191 |
|
Base year |
2024 |
|
Historic period |
2019-2023 |
|
Forecast period |
2025-2029 |
|
Growth momentum & CAGR |
Accelerate at a CAGR of 4.5% |
|
Market growth 2025-2029 |
USD 318.2 million |
|
Market structure |
Concentrated |
|
YoY growth 2024-2025(%) |
4.2 |
|
Key countries |
US, Canada, China, UK, Germany, Japan, India, Italy, South Korea, and France |
|
Competitive landscape |
Leading Companies, Market Positioning of Companies, Competitive Strategies, and Industry Risks |
What are the Key Data Covered in this Inhalation Anesthesia Market Research and Growth Report?
- CAGR of the Inhalation Anesthesia industry during the forecast period
- Detailed information on factors that will drive the growth and forecasting between 2025 and 2029
- Precise estimation of the size of the market and its contribution of the industry in focus to the parent market
- Accurate predictions about upcoming growth and trends and changes in consumer behaviour
- Growth of the market across North America, Europe, Asia, and Rest of World (ROW)
- Thorough analysis of the market's competitive landscape and detailed information about companies
- Comprehensive analysis of factors that will challenge the inhalation anesthesia market growth of industry companies
We can help! Our analysts can customize this inhalation anesthesia market research report to meet your requirements.
 RIA -
RIA - 
