Licensed Sports Merchandise Market Analysis, Size, and Forecast 2026-2030: North America (US, Canada, and Mexico), Europe (Germany, UK, and France), APAC (China, India, and Japan), South America (Brazil and Argentina), Middle East and Africa (Saudi Arabia, UAE, and South Africa), and Rest of World (ROW)

Licensed Sports Merchandise Market Analysis, Size, and Forecast 2026-2030:
North America (US, Canada, and Mexico), Europe (Germany, UK, and France), APAC (China, India, and Japan), South America (Brazil and Argentina), Middle East and Africa (Saudi Arabia, UAE, and South Africa), and Rest of World (ROW)

Published: Mar 2026 302 Pages SKU: IRTNTR44517

Market Overview at a Glance

$8.75 B
Market Opportunity
4.8%
CAGR 2025 - 2030
40.8%
North America Growth
$22.59 B
Offline segment 2024

Licensed Sports Merchandise Market Size 2026-2030

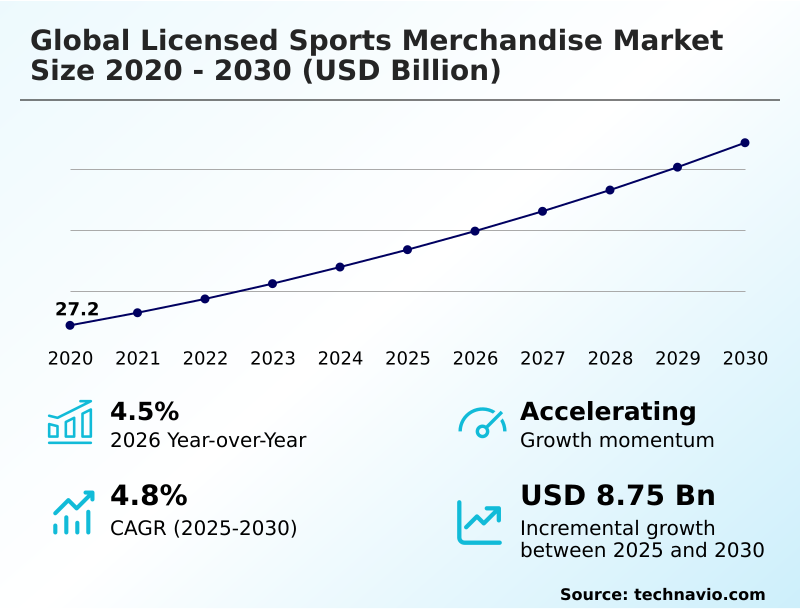
The licensed sports merchandise market size is valued to increase by USD 8.75 billion, at a CAGR of 4.8% from 2025 to 2030. Design and material innovations leading to product premiumization will drive the licensed sports merchandise market.

Major Market Trends & Insights

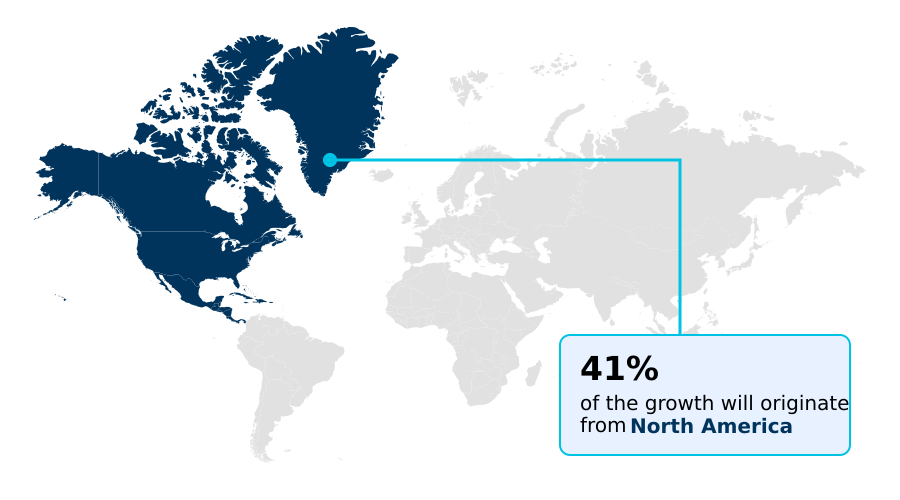
  • North America dominated the market and accounted for a 40.8% growth during the forecast period.
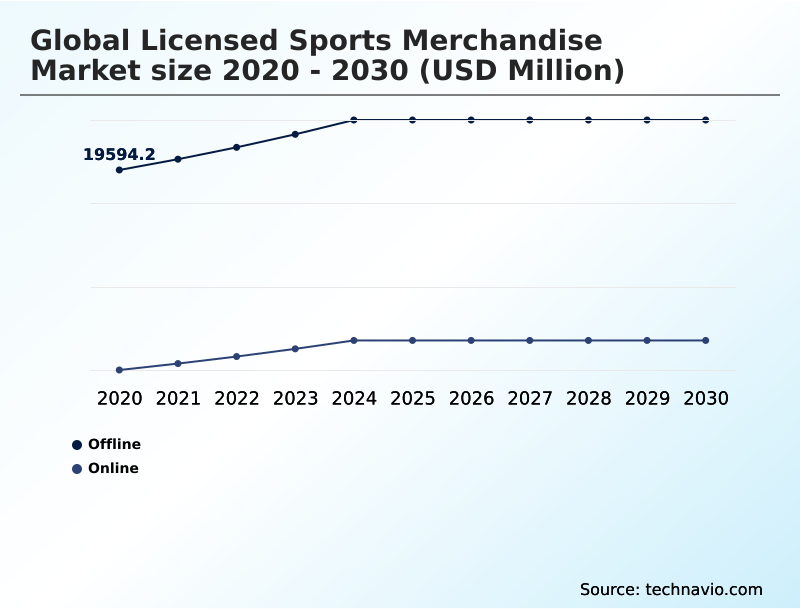
  • By Distribution Channel - Offline segment was valued at USD 22.59 billion in 2024
  • By End-user - Men segment accounted for the largest market revenue share in 2024

Market Size & Forecast

  • Market Opportunities: USD 14.94 billion
  • Market Future Opportunities: USD 8.75 billion
  • CAGR from 2025 to 2030 : 4.8%

Market Summary

  • The licensed sports merchandise market is a dynamic segment within the broader apparel, accessories, and luxury goods industry, defined by deep consumer loyalty and increasing commercialization. Growth is fueled by design and material innovations leading to product premiumization, with a notable shift toward sustainable fabrics and performance wear that merges aesthetics with functionality.
  • Key trends like the rise of athleisure and demand for fan apparel customization are reshaping product strategies, while celebrity athlete endorsements continue to be a powerful influence on purchasing decisions. However, the market faces challenges from the proliferation of counterfeit goods and the unorganized sector, which erodes brand equity and pressures profit margins.
  • In a typical business scenario, a licensor must balance a complex supply chain to deliver high-quality, authentic official team apparel in time for major sporting events, while simultaneously investing in anti-counterfeit technologies like blockchain authenticity tracking to protect its intellectual property and maintain consumer trust in its e-commerce sports retail channels.
  • This environment necessitates a robust omnichannel retail strategy to maximize reach and fan engagement.

What will be the Size of the Licensed Sports Merchandise Market during the forecast period?

Get Key Insights on Market Forecast (PDF) Request Free Sample

How is the Licensed Sports Merchandise Market Segmented?

The licensed sports merchandise industry research report provides comprehensive data (region-wise segment analysis), with forecasts and estimates in "USD million" for the period 2026-2030, as well as historical data from 2020-2024 for the following segments.

  • Distribution channel
    • Offline
    • Online
  • End-user
    • Men
    • Women
    • Children
  • Type
    • Apparel
    • Footwear
    • Accessories
    • Sports equipment
    • Others
  • Geography
    • North America
      • US
      • Canada
      • Mexico
    • Europe
      • Germany
      • UK
      • France
    • APAC
      • China
      • India
      • Japan
    • South America
      • Brazil
      • Argentina
    • Middle East and Africa
      • Saudi Arabia
      • UAE
      • South Africa
    • Rest of World (ROW)

By Distribution Channel Insights

The offline segment is estimated to witness significant growth during the forecast period.

The offline segment remains a foundational pillar, offering tactile consumer experiences that digital platforms cannot fully replicate.

This channel, which includes specialty stores and stadium retail solutions, provides immediate product gratification and allows fans to verify the quality of high-value fan wear and athletic footwear.

In-person retail, including pop-up retail events, fosters community and drives sales of game-day apparel and sports equipment branding, accounting for a significant 44.4% of consumer interactions.

Brands are enhancing this channel by integrating an omnichannel retail strategy, transforming physical locations into fulfillment hubs for collectible merchandise and even supporting on-demand manufacturing, bridging the gap between digital browsing and physical acquisition for pro sports merchandise.

Request Free Sample

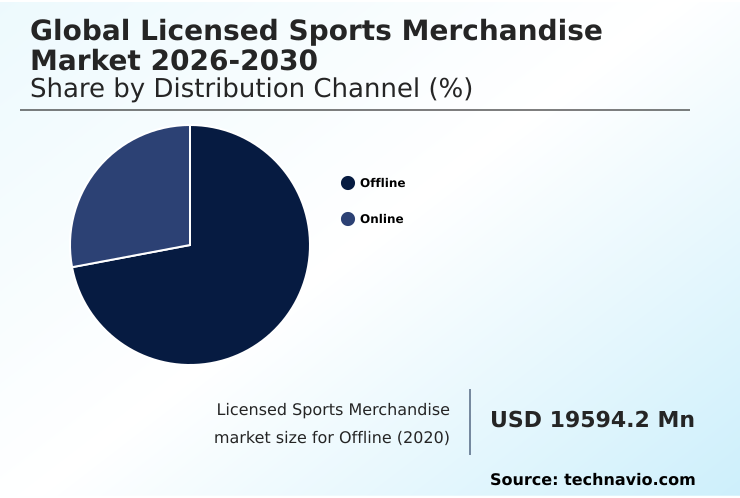
The Offline segment was valued at USD 22.59 billion in 2024 and showed a gradual increase during the forecast period.

Request Free Sample

Regional Analysis

North America is estimated to contribute 40.8% to the growth of the global market during the forecast period.Technavio’s analysts have elaborately explained the regional trends and drivers that shape the market during the forecast period.

See How Licensed Sports Merchandise Market Demand is Rising in North America Request Free Sample

The geographic landscape is led by North America, which accounts for 40.8% of incremental growth, driven by a mature sports ecosystem and high consumer spending on licensed fan gear.

This region shows a faster growth rate compared to APAC, 5.3% versus 4.2%, respectively. The European market, securing 27.04% of new growth, is fueled by football's popularity and strong demand for official league jerseys.

In contrast, APAC represents the fastest-growing region, where rising disposable incomes and burgeoning e-commerce sports retail infrastructure are expanding access to international sports memorabilia market products like women's fan apparel and limited-edition product drops.

Celebrity athlete endorsements and the introduction of tech-integrated jerseys and digital collectibles using recycled polyester blends are key strategies for engaging a global audience.

Market Dynamics

Our researchers analyzed the data with 2025 as the base year, along with the key drivers, trends, and challenges. A holistic analysis of drivers will help companies refine their marketing strategies to gain a competitive advantage.

  • The global licensed sports merchandise market is navigating a complex landscape shaped by evolving consumer behaviors and digital transformation. Understanding the impact of endorsements on merchandise sales remains crucial, as high-profile collaborations like the nike skims women activewear line demonstrate how partnerships can drive the growth of women's licensed sports apparel.
  • Simultaneously, sustainability trends in sports merchandise production are pushing brands to adopt eco-friendly practices, a core consideration for marketing sports merchandise to gen z. The role of e-commerce in sports merchandise distribution cannot be overstated, yet it also amplifies the challenges of counterfeit sports merchandise, prompting investment in technologies like using blockchain for authenticating collectibles.
  • The athleisure trend in licensed team apparel continues to gain momentum, driving the premiumization of official fan wear with items like official college team performance fan gear and nba-branded apparel and performance sportswear.
  • Major leagues and events, from mlb-branded baseball gloves and equipment to wimbledon apparel and olympic team uniforms and official football club kits and sneakers, are leveraging this trend.
  • Supply chains that successfully implement omnichannel strategies for stadium retail, which integrate physical stores with digital fan engagement platforms to drive sales, report inventory turnover rates up to 40% higher than those relying on traditional, siloed channels. This is where innovations in direct-to-garment printing and understanding how fan engagement platforms drive sales become competitive advantages.
  • Exclusive releases like the fanatics nfl rivalries uniforms collection and unique ventures into luxury sailing and sports event collaborations further illustrate the market's diversification, all underpinned by complex technology licensing agreements in sports.

What are the key market drivers leading to the rise in the adoption of Licensed Sports Merchandise Industry?

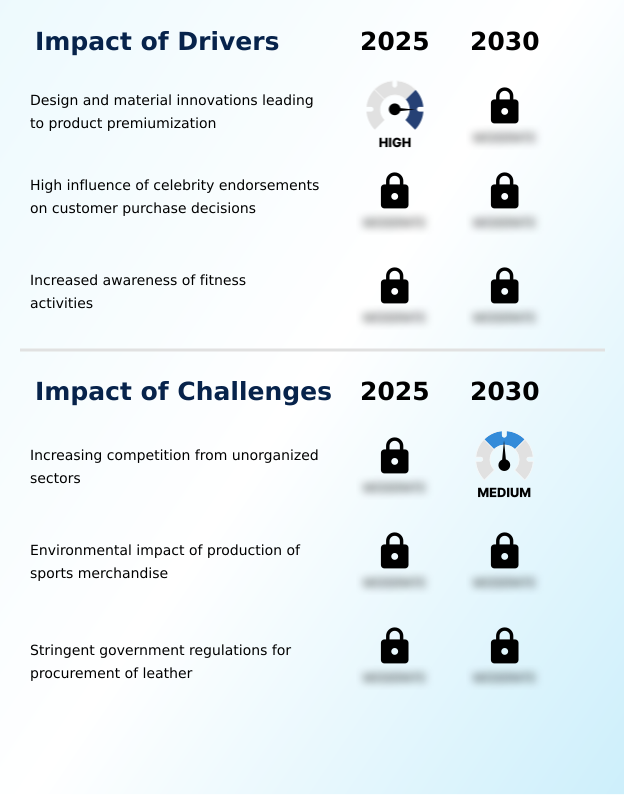
  • Design and material innovations that facilitate product premiumization are a key driver influencing market growth.

  • Market growth is significantly propelled by design and material innovations.
  • The push for product premiumization is evident in the adoption of sustainable fabrics and advanced smart textiles in performance wear, which resonates with eco-conscious consumers and can boost sports brand loyalty by over 10% among younger demographics.
  • Athletic brand collaborations that result in signature edition products and player-endorsed footwear remain a powerful driver, often leading to a sales uplift of 30-40% during launch periods.
  • This focus on fan-centric product design, which blends aesthetic appeal with high functionality, allows brands to command higher price points for sustainable sportswear and niche sports merchandise, reinforcing the value of authenticity and innovation.

What are the market trends shaping the Licensed Sports Merchandise Industry?

  • The increasing popularity of athleisure represents a significant market trend. This movement reflects a growing consumer desire for versatile apparel that combines comfort with everyday style.

  • Key trends are reshaping product strategies and consumer interactions. The rise of athleisure apparel continues to blend sports fashion trends with everyday wear, expanding the market for official team apparel beyond game days. Fan apparel customization is a major force, with platforms offering customized sports apparel reporting a 20% higher repeat purchase rate.
  • Digital fan engagement is being enhanced through innovations like virtual try-on technology, which has proven to reduce online return rates by up to 35%. Furthermore, fan engagement platforms are integrating augmented reality collectibles, a strategy that increases user session times by an average of 40%.
  • These trends signal a shift toward more personalized and interactive experiences for consumers of pro sports merchandise.

What challenges does the Licensed Sports Merchandise Industry face during its growth?

  • Increasing competition from unorganized sectors and counterfeit products presents a key challenge that affects the industry's growth potential.

  • The market faces significant challenges, primarily from the proliferation of counterfeit sports merchandise, which is estimated to erode revenues for authentic team-branded footwear and collectible sports jerseys by up to 25% in certain online marketplaces. This forces legitimate vendors to invest in countermeasures like blockchain authenticity tracking.
  • Another challenge involves the environmental impact of production, as transitioning to eco-friendly merchandise requires significant capital investment, potentially increasing production costs by 15-20%. Furthermore, stringent sports licensing agreements can limit flexibility, while competition from unorganized sectors offering low-cost youth sports apparel and vintage team apparel via direct-to-garment printing continues to pressure pricing strategies for authentic goods like tech-integrated jerseys.

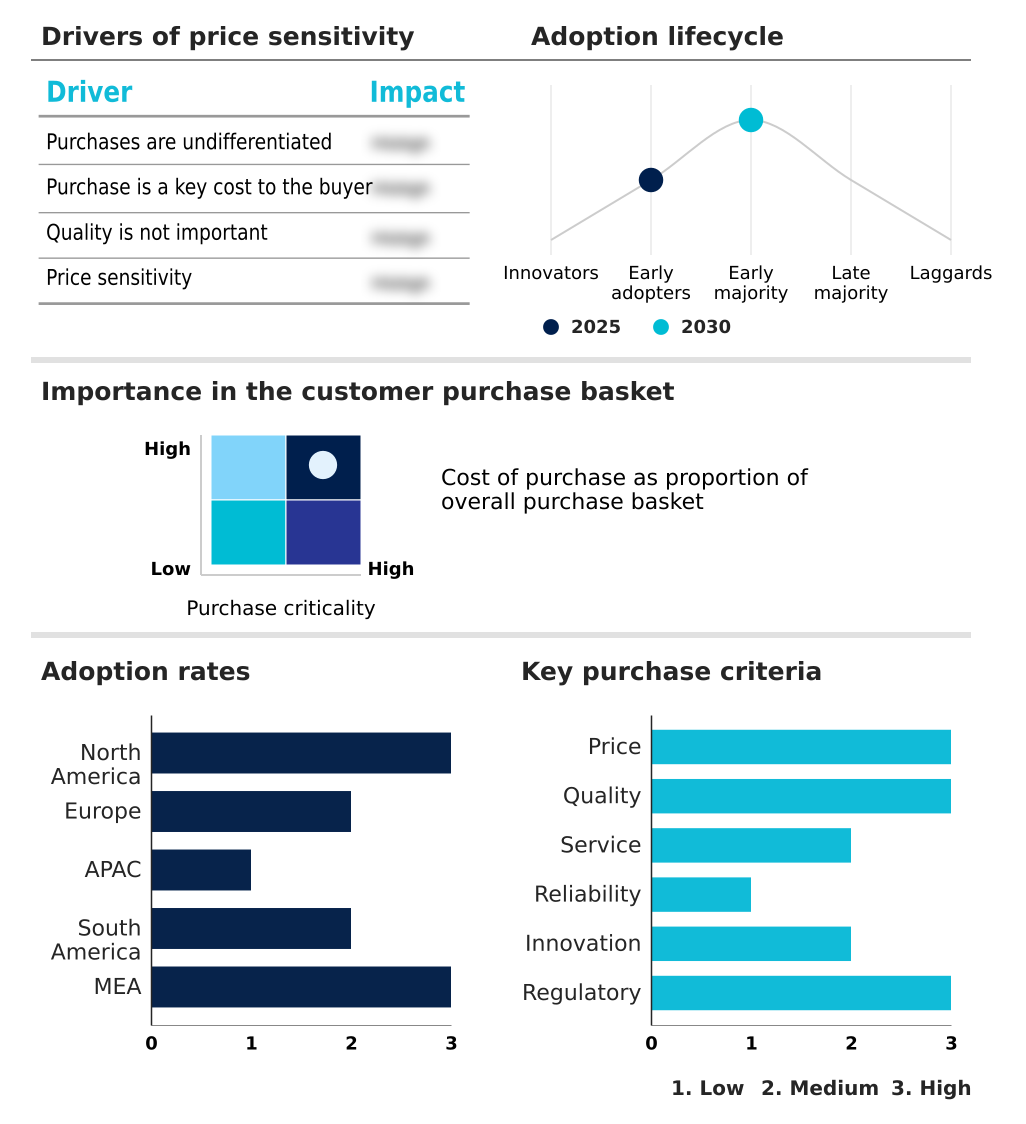
Exclusive Technavio Analysis on Customer Landscape

The licensed sports merchandise market forecasting report includes the adoption lifecycle of the market, covering from the innovator’s stage to the laggard’s stage. It focuses on adoption rates in different regions based on penetration. Furthermore, the licensed sports merchandise market report also includes key purchase criteria and drivers of price sensitivity to help companies evaluate and develop their market growth analysis strategies.

Customer Landscape of Licensed Sports Merchandise Industry

Competitive Landscape

Companies are implementing various strategies, such as strategic alliances, licensed sports merchandise market forecast, partnerships, mergers and acquisitions, geographical expansion, and product/service launches, to enhance their presence in the industry.

47 Brand LLC - Provides a comprehensive range of licensed sports merchandise, encompassing fan gear, jerseys, and collectibles for major professional sports leagues.

The industry research and growth report includes detailed analyses of the competitive landscape of the market and information about key companies, including:

  • 47 Brand LLC
  • Adidas AG
  • ANTA Sports Products Ltd.
  • Boardriders Inc.
  • Columbia Sportswear Co.
  • Fanatics Inc.
  • Forever Collectibles
  • G III Apparel Group Ltd.
  • Hanesbrands Inc.
  • Logo Brands Inc.
  • New Era Cap LLC
  • Nike Inc.
  • Outerstuff LLC
  • Prada SpA
  • PUMA SE
  • Ralph Lauren Corp.
  • Rawlings Sporting Goods Co.
  • Thornico AS
  • Under Armour Inc.
  • VF Corp.

Qualitative and quantitative analysis of companies has been conducted to help clients understand the wider business environment as well as the strengths and weaknesses of key industry players. Data is qualitatively analyzed to categorize companies as pure play, category-focused, industry-focused, and diversified; it is quantitatively analyzed to categorize companies as dominant, leading, strong, tentative, and weak.

Recent Development and News in Licensed sports merchandise market

  • In August 2025, Adidas AG announced a ten-year partnership with the University of Tennessee to become the primary provider of footwear and apparel starting in July 2026.
  • In September 2025, Fanatics launched the National Football League Rivalries Uniforms Collection, introducing alternate jerseys for various teams to meet consumer demand for licensed and collectible apparel.
  • In September 2025, Nike Inc. introduced the NikeSKIMS Women Activewear Line in a high-profile collaboration, underscoring a strategic pivot toward inclusive and stylish fan apparel for female sports enthusiasts.
  • In February 2025, Saudi Arabia's SURJ Sports Investment arm made a substantial investment in the DAZN media group, establishing a joint venture aimed at revolutionizing sports viewership and fan engagement in the MENA region.

Dive into Technavio’s robust research methodology, blending expert interviews, extensive data synthesis, and validated models for unparalleled Licensed Sports Merchandise Market insights. See full methodology.

Market Scope
Page number 302
Base year 2025
Historic period 2020-2024
Forecast period 2026-2030
Growth momentum & CAGR Accelerate at a CAGR of 4.8%
Market growth 2026-2030 USD 8752.1 million
Market structure Fragmented
YoY growth 2025-2026(%) 4.5%
Key countries US, Canada, Mexico, Germany, UK, France, Italy, Spain, The Netherlands, China, India, Japan, South Korea, Australia, Indonesia, Brazil, Argentina, Chile, Saudi Arabia, UAE, South Africa, Turkey and Israel
Competitive landscape Leading Companies, Market Positioning of Companies, Competitive Strategies, and Industry Risks

Request Free Sample

Research Analyst Overview

  • The licensed sports merchandise market is evolving beyond traditional fan wear, driven by technological integration and a focus on premium, functional products. The production of official league jerseys and team-branded footwear now incorporates smart textiles and sustainable fabrics, appealing to a more discerning consumer. This shift toward high-quality athletic footwear and performance wear is redefining market dynamics.
  • Boardroom decisions are increasingly centered on adopting on-demand manufacturing and direct-to-garment printing, with some firms achieving a 30% reduction in inventory holding costs through these agile methods. The rise of athleisure apparel and sports lifestyle apparel continues to blur the lines between sportswear and fashion.
  • Strategic initiatives include launching limited-edition product drops of signature edition products and player-endorsed footwear to create exclusivity. To combat counterfeits and enhance fan engagement, companies are investing in blockchain authenticity tracking for collectible merchandise and tech-integrated jerseys.
  • Innovations like virtual try-on technology and augmented reality collectibles are becoming central to the omnichannel retail strategy, alongside the development of fan engagement platforms. This focus on customized sports apparel and eco-friendly merchandise made from recycled polyester blends underscores a move toward a more interactive and sustainable industry.

What are the Key Data Covered in this Licensed Sports Merchandise Market Research and Growth Report?

  • What is the expected growth of the Licensed Sports Merchandise Market between 2026 and 2030?

    • USD 8.75 billion, at a CAGR of 4.8%

  • What segmentation does the market report cover?

    • The report is segmented by Distribution Channel (Offline, and Online), End-user (Men, Women, and Children), Type (Apparel, Footwear, Accessories, Sports equipment, and Others) and Geography (North America, Europe, APAC, South America, Middle East and Africa)

  • Which regions are analyzed in the report?

    • North America, Europe, APAC, South America and Middle East and Africa

  • What are the key growth drivers and market challenges?

    • Design and material innovations leading to product premiumization, Increasing competition from unorganized sectors

  • Who are the major players in the Licensed Sports Merchandise Market?

    • 47 Brand LLC, Adidas AG, ANTA Sports Products Ltd., Boardriders Inc., Columbia Sportswear Co., Fanatics Inc., Forever Collectibles, G III Apparel Group Ltd., Hanesbrands Inc., Logo Brands Inc., New Era Cap LLC, Nike Inc., Outerstuff LLC, Prada SpA, PUMA SE, Ralph Lauren Corp., Rawlings Sporting Goods Co., Thornico AS, Under Armour Inc. and VF Corp.

Market Research Insights

  • The market is characterized by a strategic focus on enhancing sports brand loyalty and fan-centric product design. Companies are leveraging athletic brand collaborations to expand their reach, with such partnerships showing an ability to increase market penetration in new demographics by over 15%.
  • The shift toward fan apparel customization is significant, as personalized items can elevate customer lifetime value by more than 25% compared to standard merchandise. E-commerce sports retail continues to dominate distribution, while physical pop-up retail events and sophisticated stadium retail solutions are used to create immersive game-day apparel experiences.
  • As the sports memorabilia market grows, so does the emphasis on niche sports merchandise and curated vintage team apparel lines to capture diverse consumer interests.

We can help! Our analysts can customize this licensed sports merchandise market research report to meet your requirements.

Get in touch

1. Executive Summary

1.1 Market overview

Executive Summary - Chart on Market Overview
Executive Summary - Data Table on Market Overview
Executive Summary - Chart on Global Market Characteristics
Executive Summary - Chart on Market by Geography
Executive Summary - Chart on Market Segmentation by Distribution Channel
Executive Summary - Chart on Market Segmentation by End-user
Executive Summary - Chart on Market Segmentation by Type
Executive Summary - Chart on Incremental Growth
Executive Summary - Data Table on Incremental Growth
Executive Summary - Chart on Company Market Positioning

2. Technavio Analysis

2.1 Analysis of price sensitivity, lifecycle, customer purchase basket, adoption rates, and purchase criteria

2.2 Criticality of inputs and Factors of differentiation

Chart on Overview on criticality of inputs and factors of differentiation

2.3 Factors of disruption

Chart on Overview on factors of disruption

2.4 Impact of drivers and challenges

Chart on Impact of drivers and challenges in 2025 and 2030

3. Market Landscape

3.1 Market ecosystem

Chart on Parent Market
Data Table on - Parent Market

3.2 Market characteristics

Chart on Market characteristics analysis

3.3 Value chain analysis

Chart on Value chain analysis

4. Market Sizing

4.1 Market definition

Data Table on Offerings of companies included in the market definition

4.2 Market segment analysis

Market segments

4.3 Market size 2025

4.4 Market outlook: Forecast for 2025-2030

Chart on Global - Market size and forecast 2025-2030 ($ million)
Data Table on Global - Market size and forecast 2025-2030 ($ million)
Chart on Global Market: Year-over-year growth 2025-2030 (%)
Data Table on Global Market: Year-over-year growth 2025-2030 (%)

5. Historic Market Size

5.1 Global Licensed Sports Merchandise Market 2020 - 2024

Historic Market Size - Data Table on Global Licensed Sports Merchandise Market 2020 - 2024 ($ million)

5.2 Distribution Channel segment analysis 2020 - 2024

Historic Market Size - Distribution Channel Segment 2020 - 2024 ($ million)

5.3 End-user segment analysis 2020 - 2024

Historic Market Size - End-user Segment 2020 - 2024 ($ million)

5.4 Type segment analysis 2020 - 2024

Historic Market Size - Type Segment 2020 - 2024 ($ million)

5.5 Geography segment analysis 2020 - 2024

Historic Market Size - Geography Segment 2020 - 2024 ($ million)

5.6 Country segment analysis 2020 - 2024

Historic Market Size - Country Segment 2020 - 2024 ($ million)

6. Qualitative Analysis

6.1 The AI Impact On Global Licensed Sports Merchandise Market

7. Five Forces Analysis

7.1 Five forces summary

Five forces analysis - Comparison between 2025 and 2030

7.2 Bargaining power of buyers

Bargaining power of buyers - Impact of key factors 2025 and 2030

7.3 Bargaining power of suppliers

Bargaining power of suppliers - Impact of key factors in 2025 and 2030

7.4 Threat of new entrants

Threat of new entrants - Impact of key factors in 2025 and 2030

7.5 Threat of substitutes

Threat of substitutes - Impact of key factors in 2025 and 2030

7.6 Threat of rivalry

Threat of rivalry - Impact of key factors in 2025 and 2030

7.7 Market condition

Chart on Market condition - Five forces 2025 and 2030

8. Market Segmentation by Distribution Channel

8.1 Market segments

Chart on Distribution Channel - Market share 2025-2030 (%)
Data Table on Distribution Channel - Market share 2025-2030 (%)

8.2 Comparison by Distribution Channel

Chart on Comparison by Distribution Channel
Data Table on Comparison by Distribution Channel

8.3 Offline - Market size and forecast 2025-2030

Chart on Offline - Market size and forecast 2025-2030 ($ million)
Data Table on Offline - Market size and forecast 2025-2030 ($ million)
Chart on Offline - Year-over-year growth 2025-2030 (%)
Data Table on Offline - Year-over-year growth 2025-2030 (%)

8.4 Online - Market size and forecast 2025-2030

Chart on Online - Market size and forecast 2025-2030 ($ million)
Data Table on Online - Market size and forecast 2025-2030 ($ million)
Chart on Online - Year-over-year growth 2025-2030 (%)
Data Table on Online - Year-over-year growth 2025-2030 (%)

8.5 Market opportunity by Distribution Channel

Market opportunity by Distribution Channel ($ million)
Data Table on Market opportunity by Distribution Channel ($ million)

9. Market Segmentation by End-user

9.1 Market segments

Chart on End-user - Market share 2025-2030 (%)
Data Table on End-user - Market share 2025-2030 (%)

9.2 Comparison by End-user

Chart on Comparison by End-user
Data Table on Comparison by End-user

9.3 Men - Market size and forecast 2025-2030

Chart on Men - Market size and forecast 2025-2030 ($ million)
Data Table on Men - Market size and forecast 2025-2030 ($ million)
Chart on Men - Year-over-year growth 2025-2030 (%)
Data Table on Men - Year-over-year growth 2025-2030 (%)

9.4 Women - Market size and forecast 2025-2030

Chart on Women - Market size and forecast 2025-2030 ($ million)
Data Table on Women - Market size and forecast 2025-2030 ($ million)
Chart on Women - Year-over-year growth 2025-2030 (%)
Data Table on Women - Year-over-year growth 2025-2030 (%)

9.5 Children - Market size and forecast 2025-2030

Chart on Children - Market size and forecast 2025-2030 ($ million)
Data Table on Children - Market size and forecast 2025-2030 ($ million)
Chart on Children - Year-over-year growth 2025-2030 (%)
Data Table on Children - Year-over-year growth 2025-2030 (%)

9.6 Market opportunity by End-user

Market opportunity by End-user ($ million)
Data Table on Market opportunity by End-user ($ million)

10. Market Segmentation by Type

10.1 Market segments

Chart on Type - Market share 2025-2030 (%)
Data Table on Type - Market share 2025-2030 (%)

10.2 Comparison by Type

Chart on Comparison by Type
Data Table on Comparison by Type

10.3 Apparel - Market size and forecast 2025-2030

Chart on Apparel - Market size and forecast 2025-2030 ($ million)
Data Table on Apparel - Market size and forecast 2025-2030 ($ million)
Chart on Apparel - Year-over-year growth 2025-2030 (%)
Data Table on Apparel - Year-over-year growth 2025-2030 (%)

10.4 Footwear - Market size and forecast 2025-2030

Chart on Footwear - Market size and forecast 2025-2030 ($ million)
Data Table on Footwear - Market size and forecast 2025-2030 ($ million)
Chart on Footwear - Year-over-year growth 2025-2030 (%)
Data Table on Footwear - Year-over-year growth 2025-2030 (%)

10.5 Accessories - Market size and forecast 2025-2030

Chart on Accessories - Market size and forecast 2025-2030 ($ million)
Data Table on Accessories - Market size and forecast 2025-2030 ($ million)
Chart on Accessories - Year-over-year growth 2025-2030 (%)
Data Table on Accessories - Year-over-year growth 2025-2030 (%)

10.6 Sports equipment - Market size and forecast 2025-2030

Chart on Sports equipment - Market size and forecast 2025-2030 ($ million)
Data Table on Sports equipment - Market size and forecast 2025-2030 ($ million)
Chart on Sports equipment - Year-over-year growth 2025-2030 (%)
Data Table on Sports equipment - Year-over-year growth 2025-2030 (%)

10.7 Others - Market size and forecast 2025-2030

Chart on Others - Market size and forecast 2025-2030 ($ million)
Data Table on Others - Market size and forecast 2025-2030 ($ million)
Chart on Others - Year-over-year growth 2025-2030 (%)
Data Table on Others - Year-over-year growth 2025-2030 (%)

10.8 Market opportunity by Type

Market opportunity by Type ($ million)
Data Table on Market opportunity by Type ($ million)

11. Customer Landscape

11.1 Customer landscape overview

Analysis of price sensitivity, lifecycle, customer purchase basket, adoption rates, and purchase criteria

12. Geographic Landscape

12.1 Geographic segmentation

Chart on Market share by geography 2025-2030 (%)
Data Table on Market share by geography 2025-2030 (%)

12.2 Geographic comparison

Chart on Geographic comparison
Data Table on Geographic comparison

12.3 North America - Market size and forecast 2025-2030

Chart on North America - Market size and forecast 2025-2030 ($ million)
Data Table on North America - Market size and forecast 2025-2030 ($ million)
Chart on North America - Year-over-year growth 2025-2030 (%)
Data Table on North America - Year-over-year growth 2025-2030 (%)
Chart on Regional Comparison - North America
Data Table on Regional Comparison - North America

12.3.1 US - Market size and forecast 2025-2030

Chart on US - Market size and forecast 2025-2030 ($ million)
Data Table on US - Market size and forecast 2025-2030 ($ million)
Chart on US - Year-over-year growth 2025-2030 (%)
Data Table on US - Year-over-year growth 2025-2030 (%)

12.3.2 Canada - Market size and forecast 2025-2030

Chart on Canada - Market size and forecast 2025-2030 ($ million)
Data Table on Canada - Market size and forecast 2025-2030 ($ million)
Chart on Canada - Year-over-year growth 2025-2030 (%)
Data Table on Canada - Year-over-year growth 2025-2030 (%)

12.3.3 Mexico - Market size and forecast 2025-2030

Chart on Mexico - Market size and forecast 2025-2030 ($ million)
Data Table on Mexico - Market size and forecast 2025-2030 ($ million)
Chart on Mexico - Year-over-year growth 2025-2030 (%)
Data Table on Mexico - Year-over-year growth 2025-2030 (%)

12.4 Europe - Market size and forecast 2025-2030

Chart on Europe - Market size and forecast 2025-2030 ($ million)
Data Table on Europe - Market size and forecast 2025-2030 ($ million)
Chart on Europe - Year-over-year growth 2025-2030 (%)
Data Table on Europe - Year-over-year growth 2025-2030 (%)
Chart on Regional Comparison - Europe
Data Table on Regional Comparison - Europe

12.4.1 Germany - Market size and forecast 2025-2030

Chart on Germany - Market size and forecast 2025-2030 ($ million)
Data Table on Germany - Market size and forecast 2025-2030 ($ million)
Chart on Germany - Year-over-year growth 2025-2030 (%)
Data Table on Germany - Year-over-year growth 2025-2030 (%)

12.4.2 UK - Market size and forecast 2025-2030

Chart on UK - Market size and forecast 2025-2030 ($ million)
Data Table on UK - Market size and forecast 2025-2030 ($ million)
Chart on UK - Year-over-year growth 2025-2030 (%)
Data Table on UK - Year-over-year growth 2025-2030 (%)

12.4.3 France - Market size and forecast 2025-2030

Chart on France - Market size and forecast 2025-2030 ($ million)
Data Table on France - Market size and forecast 2025-2030 ($ million)
Chart on France - Year-over-year growth 2025-2030 (%)
Data Table on France - Year-over-year growth 2025-2030 (%)

12.4.4 Italy - Market size and forecast 2025-2030

Chart on Italy - Market size and forecast 2025-2030 ($ million)
Data Table on Italy - Market size and forecast 2025-2030 ($ million)
Chart on Italy - Year-over-year growth 2025-2030 (%)
Data Table on Italy - Year-over-year growth 2025-2030 (%)

12.4.5 Spain - Market size and forecast 2025-2030

Chart on Spain - Market size and forecast 2025-2030 ($ million)
Data Table on Spain - Market size and forecast 2025-2030 ($ million)
Chart on Spain - Year-over-year growth 2025-2030 (%)
Data Table on Spain - Year-over-year growth 2025-2030 (%)

12.4.6 The Netherlands - Market size and forecast 2025-2030

Chart on The Netherlands - Market size and forecast 2025-2030 ($ million)
Data Table on The Netherlands - Market size and forecast 2025-2030 ($ million)
Chart on The Netherlands - Year-over-year growth 2025-2030 (%)
Data Table on The Netherlands - Year-over-year growth 2025-2030 (%)

12.5 APAC - Market size and forecast 2025-2030

Chart on APAC - Market size and forecast 2025-2030 ($ million)
Data Table on APAC - Market size and forecast 2025-2030 ($ million)
Chart on APAC - Year-over-year growth 2025-2030 (%)
Data Table on APAC - Year-over-year growth 2025-2030 (%)
Chart on Regional Comparison - APAC
Data Table on Regional Comparison - APAC

12.5.1 China - Market size and forecast 2025-2030

Chart on China - Market size and forecast 2025-2030 ($ million)
Data Table on China - Market size and forecast 2025-2030 ($ million)
Chart on China - Year-over-year growth 2025-2030 (%)
Data Table on China - Year-over-year growth 2025-2030 (%)

12.5.2 India - Market size and forecast 2025-2030

Chart on India - Market size and forecast 2025-2030 ($ million)
Data Table on India - Market size and forecast 2025-2030 ($ million)
Chart on India - Year-over-year growth 2025-2030 (%)
Data Table on India - Year-over-year growth 2025-2030 (%)

12.5.3 Japan - Market size and forecast 2025-2030

Chart on Japan - Market size and forecast 2025-2030 ($ million)
Data Table on Japan - Market size and forecast 2025-2030 ($ million)
Chart on Japan - Year-over-year growth 2025-2030 (%)
Data Table on Japan - Year-over-year growth 2025-2030 (%)

12.5.4 South Korea - Market size and forecast 2025-2030

Chart on South Korea - Market size and forecast 2025-2030 ($ million)
Data Table on South Korea - Market size and forecast 2025-2030 ($ million)
Chart on South Korea - Year-over-year growth 2025-2030 (%)
Data Table on South Korea - Year-over-year growth 2025-2030 (%)

12.5.5 Australia - Market size and forecast 2025-2030

Chart on Australia - Market size and forecast 2025-2030 ($ million)
Data Table on Australia - Market size and forecast 2025-2030 ($ million)
Chart on Australia - Year-over-year growth 2025-2030 (%)
Data Table on Australia - Year-over-year growth 2025-2030 (%)

12.5.6 Indonesia - Market size and forecast 2025-2030

Chart on Indonesia - Market size and forecast 2025-2030 ($ million)
Data Table on Indonesia - Market size and forecast 2025-2030 ($ million)
Chart on Indonesia - Year-over-year growth 2025-2030 (%)
Data Table on Indonesia - Year-over-year growth 2025-2030 (%)

12.6 South America - Market size and forecast 2025-2030

Chart on South America - Market size and forecast 2025-2030 ($ million)
Data Table on South America - Market size and forecast 2025-2030 ($ million)
Chart on South America - Year-over-year growth 2025-2030 (%)
Data Table on South America - Year-over-year growth 2025-2030 (%)
Chart on Regional Comparison - South America
Data Table on Regional Comparison - South America

12.6.1 Brazil - Market size and forecast 2025-2030

Chart on Brazil - Market size and forecast 2025-2030 ($ million)
Data Table on Brazil - Market size and forecast 2025-2030 ($ million)
Chart on Brazil - Year-over-year growth 2025-2030 (%)
Data Table on Brazil - Year-over-year growth 2025-2030 (%)

12.6.2 Argentina - Market size and forecast 2025-2030

Chart on Argentina - Market size and forecast 2025-2030 ($ million)
Data Table on Argentina - Market size and forecast 2025-2030 ($ million)
Chart on Argentina - Year-over-year growth 2025-2030 (%)
Data Table on Argentina - Year-over-year growth 2025-2030 (%)

12.6.3 Chile - Market size and forecast 2025-2030

Chart on Chile - Market size and forecast 2025-2030 ($ million)
Data Table on Chile - Market size and forecast 2025-2030 ($ million)
Chart on Chile - Year-over-year growth 2025-2030 (%)
Data Table on Chile - Year-over-year growth 2025-2030 (%)

12.7 Middle East and Africa - Market size and forecast 2025-2030

Chart on Middle East and Africa - Market size and forecast 2025-2030 ($ million)
Data Table on Middle East and Africa - Market size and forecast 2025-2030 ($ million)
Chart on Middle East and Africa - Year-over-year growth 2025-2030 (%)
Data Table on Middle East and Africa - Year-over-year growth 2025-2030 (%)
Chart on Regional Comparison - Middle East and Africa
Data Table on Regional Comparison - Middle East and Africa

12.7.1 Saudi Arabia - Market size and forecast 2025-2030

Chart on Saudi Arabia - Market size and forecast 2025-2030 ($ million)
Data Table on Saudi Arabia - Market size and forecast 2025-2030 ($ million)
Chart on Saudi Arabia - Year-over-year growth 2025-2030 (%)
Data Table on Saudi Arabia - Year-over-year growth 2025-2030 (%)

12.7.2 UAE - Market size and forecast 2025-2030

Chart on UAE - Market size and forecast 2025-2030 ($ million)
Data Table on UAE - Market size and forecast 2025-2030 ($ million)
Chart on UAE - Year-over-year growth 2025-2030 (%)
Data Table on UAE - Year-over-year growth 2025-2030 (%)

12.7.3 South Africa - Market size and forecast 2025-2030

Chart on South Africa - Market size and forecast 2025-2030 ($ million)
Data Table on South Africa - Market size and forecast 2025-2030 ($ million)
Chart on South Africa - Year-over-year growth 2025-2030 (%)
Data Table on South Africa - Year-over-year growth 2025-2030 (%)

12.7.4 Turkey - Market size and forecast 2025-2030

Chart on Turkey - Market size and forecast 2025-2030 ($ million)
Data Table on Turkey - Market size and forecast 2025-2030 ($ million)
Chart on Turkey - Year-over-year growth 2025-2030 (%)
Data Table on Turkey - Year-over-year growth 2025-2030 (%)

12.7.5 Israel - Market size and forecast 2025-2030

Chart on Israel - Market size and forecast 2025-2030 ($ million)
Data Table on Israel - Market size and forecast 2025-2030 ($ million)
Chart on Israel - Year-over-year growth 2025-2030 (%)
Data Table on Israel - Year-over-year growth 2025-2030 (%)

12.8 Market opportunity by geography

Market opportunity by geography ($ million)
Data Tables on Market opportunity by geography ($ million)

13. Drivers, Challenges, and Opportunity

13.1 Market drivers

Design and material innovations leading to product premiumization
High influence of celebrity endorsements on customer purchase decisions
Increased awareness of fitness activities

13.2 Market challenges

Increasing competition from unorganized sectors
Environmental impact of production of sports merchandise
Stringent government regulations for procurement of leather

13.3 Impact of drivers and challenges

Impact of drivers and challenges in 2025 and 2030

13.4 Market opportunities

Increasing popularity of athleisure
Customization of sports merchandise
Expansion of distribution network

14. Competitive Landscape

14.1 Overview

14.2

Overview on criticality of inputs and factors of differentiation

14.3 Landscape disruption

Overview on factors of disruption

14.4 Industry risks

Impact of key risks on business

15. Competitive Analysis

15.1 Companies profiled

Companies covered

15.2 Company ranking index

15.3 Market positioning of companies

Matrix on companies position and classification

15.4 47 Brand LLC

47 Brand LLC - Overview
47 Brand LLC - Product / Service
47 Brand LLC - Key offerings
SWOT

15.5 Adidas AG

Adidas AG - Overview
Adidas AG - Business segments
Adidas AG - Key news
Adidas AG - Key offerings
Adidas AG - Segment focus
SWOT

15.6 ANTA Sports Products Ltd.

ANTA Sports Products Ltd. - Overview
ANTA Sports Products Ltd. - Business segments
ANTA Sports Products Ltd. - Key news
ANTA Sports Products Ltd. - Key offerings
ANTA Sports Products Ltd. - Segment focus
SWOT

15.7 Boardriders Inc.

Boardriders Inc. - Overview
Boardriders Inc. - Product / Service
Boardriders Inc. - Key offerings
SWOT

15.8 Columbia Sportswear Co.

Columbia Sportswear Co. - Overview
Columbia Sportswear Co. - Business segments
Columbia Sportswear Co. - Key offerings
Columbia Sportswear Co. - Segment focus
SWOT

15.9 Fanatics Inc.

Fanatics Inc. - Overview
Fanatics Inc. - Product / Service
Fanatics Inc. - Key offerings
SWOT

15.10 G III Apparel Group Ltd.

G III Apparel Group Ltd. - Overview
G III Apparel Group Ltd. - Business segments
G III Apparel Group Ltd. - Key offerings
G III Apparel Group Ltd. - Segment focus
SWOT

15.11 Hanesbrands Inc.

Hanesbrands Inc. - Overview
Hanesbrands Inc. - Business segments
Hanesbrands Inc. - Key news
Hanesbrands Inc. - Key offerings
Hanesbrands Inc. - Segment focus
SWOT

15.12 Nike Inc.

Nike Inc. - Overview
Nike Inc. - Business segments
Nike Inc. - Key news
Nike Inc. - Key offerings
Nike Inc. - Segment focus
SWOT

15.13 Prada SpA

Prada SpA - Overview
Prada SpA - Business segments
Prada SpA - Key offerings
Prada SpA - Segment focus
SWOT

15.14 PUMA SE

PUMA SE - Overview
PUMA SE - Business segments
PUMA SE - Key news
PUMA SE - Key offerings
PUMA SE - Segment focus
SWOT

15.15 Ralph Lauren Corp.

Ralph Lauren Corp. - Overview
Ralph Lauren Corp. - Business segments
Ralph Lauren Corp. - Key news
Ralph Lauren Corp. - Key offerings
Ralph Lauren Corp. - Segment focus
SWOT

15.16 Rawlings Sporting Goods Co.

Rawlings Sporting Goods Co. - Overview
Rawlings Sporting Goods Co. - Product / Service
Rawlings Sporting Goods Co. - Key offerings
SWOT

15.17 Under Armour Inc.

Under Armour Inc. - Overview
Under Armour Inc. - Business segments
Under Armour Inc. - Key news
Under Armour Inc. - Key offerings
Under Armour Inc. - Segment focus
SWOT

15.18 VF Corp.

VF Corp. - Overview
VF Corp. - Business segments
VF Corp. - Key news
VF Corp. - Key offerings
VF Corp. - Segment focus
SWOT

16. Appendix

16.1 Scope of the report

Market definition
Objectives
Notes and caveats

16.2 Inclusions and exclusions checklist

Inclusions checklist
Exclusions checklist

16.3 Currency conversion rates for US$

16.4 Research methodology

16.5 Data procurement

Information sources

16.6 Data validation

16.7 Validation techniques employed for market sizing

16.8 Data synthesis

16.9 360 degree market analysis

16.10 List of abbreviations

Research Methodology

Technavio presents a detailed picture of the market by way of study, synthesis, and summation of data from multiple sources. The analysts have presented the various facets of the market with a particular focus on identifying the key industry influencers. The data thus presented is comprehensive, reliable, and the result of extensive research, both primary and secondary.

INFORMATION SOURCES

Primary sources

  • Manufacturers and suppliers
  • Channel partners
  • Industry experts
  • Strategic decision makers

Secondary sources

  • Industry journals and periodicals
  • Government data
  • Financial reports of key industry players
  • Historical data
  • Press releases

DATA ANALYSIS

Data Synthesis

  • Collation of data
  • Estimation of key figures
  • Analysis of derived insights

Data Validation

  • Triangulation with data models
  • Reference against proprietary databases
  • Corroboration with industry experts

REPORT WRITING

Qualitative

  • Market drivers
  • Market challenges
  • Market trends
  • Five forces analysis

Quantitative

  • Market size and forecast
  • Market segmentation
  • Geographical insights
  • Competitive landscape

Interested in this report?

Get your sample now to see our research methodology and insights!

Download Now

Frequently Asked Questions

Licensed Sports Merchandise market growth will increase by USD 8752.1 million during 2026-2030.

The Licensed Sports Merchandise market is expected to grow at a CAGR of 4.8% during 2026-2030.

Licensed Sports Merchandise market is segmented by Distribution channel (Offline, Online) End-user (Men, Women, Children) Type (Apparel, Footwear, Accessories, Sports equipment, Others)

47 Brand LLC, Adidas AG, ANTA Sports Products Ltd., Boardriders Inc., Columbia Sportswear Co., Fanatics Inc., Forever Collectibles, G III Apparel Group Ltd., Hanesbrands Inc., Logo Brands Inc., New Era Cap LLC, Nike Inc., Outerstuff LLC, Prada SpA, PUMA SE, Ralph Lauren Corp., Rawlings Sporting Goods Co., Thornico AS, Under Armour Inc., VF Corp. are a few of the key vendors in the Licensed Sports Merchandise market.

North America will register the highest growth rate of 40.8% among the other regions. Therefore, the Licensed Sports Merchandise market in North America is expected to garner significant business opportunities for the vendors during the forecast period.

US, Canada, Mexico, Germany, UK, France, Italy, Spain, The Netherlands, China, India, Japan, South Korea, Australia, Indonesia, Brazil, Argentina, Chile, Saudi Arabia, UAE, South Africa, Turkey, Israel

  • Design and material innovations leading to product premiumization is the driving factor this market.

The Licensed Sports Merchandise market vendors should focus on grabbing business opportunities from the Distribution channel segment as it accounted for the largest market share in the base year.
RIA - Research AI Assistant
Ask RIA