Marine Air Conditioning (AC) Systems Market Size 2025-2029
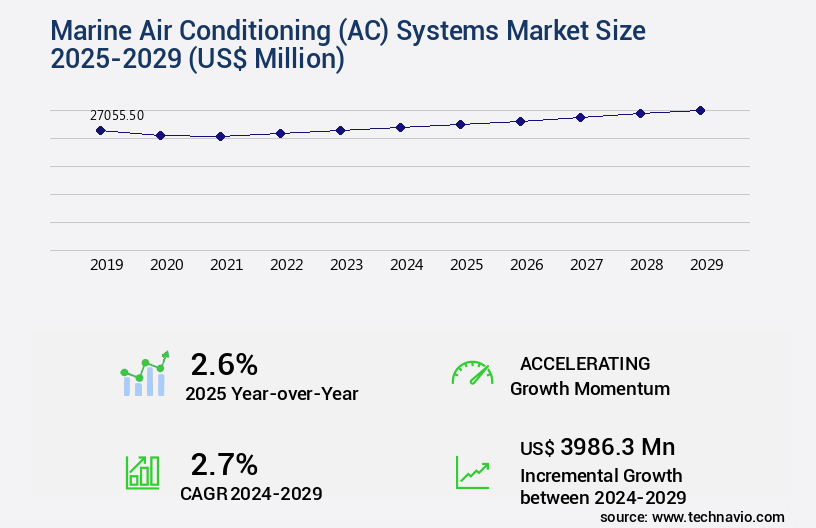
The marine air conditioning (AC) systems market size is valued to increase USD 3.99 billion, at a CAGR of 2.7% from 2024 to 2029. Robust growth in commercial shipping will drive the marine air conditioning (AC) systems market.
Major Market Trends & Insights
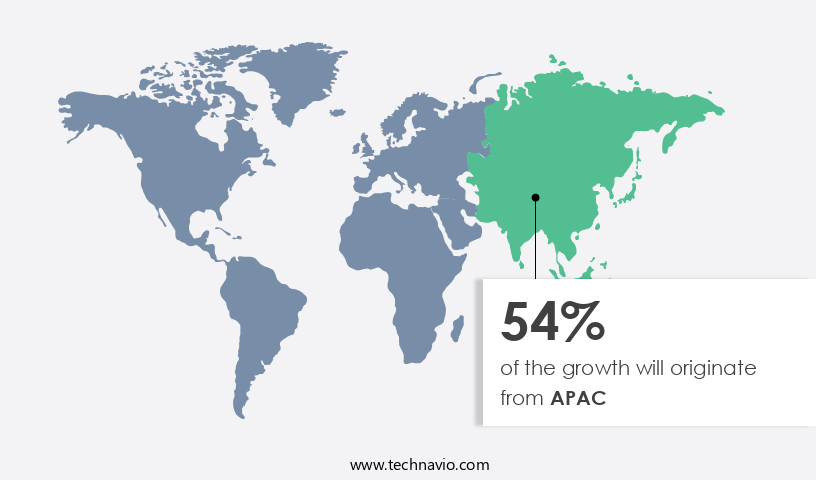
- APAC dominated the market and accounted for a 54% growth during the forecast period.
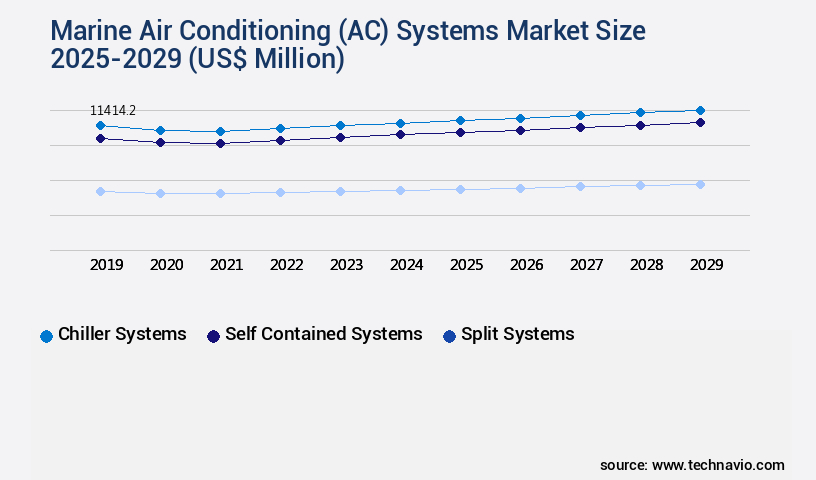
- By Product - Chiller systems segment was valued at USD 11.41 billion in 2023
- By End-user - Leisure ships segment accounted for the largest market revenue share in 2023
Market Size & Forecast
- Market Opportunities: USD 17.51 million
- Market Future Opportunities: USD 3986.30 million
- CAGR from 2024 to 2029 : 2.7%
Market Summary
- The market experiences significant expansion due to the increasing demand for energy efficiency and improved living conditions on board commercial vessels. MARPOL regulations, which set standards for the prevention of marine pollution, have been a key driver, as these systems help ensure compliance. However, challenges persist, such as safety concerns and piracy threats, which necessitate the use of digital air conditioning systems. According to a recent study, the global marine HVAC market is projected to reach USD 2.5 billion by 2025, underscoring its importance.
- In response, market participants are focusing on innovation, with a growing emphasis on energy recovery systems and the integration of renewable energy sources. This evolving landscape reflects the industry's commitment to sustainability and operational efficiency.
What will be the Size of the Marine Air Conditioning (AC) Systems Market during the forecast period?
Get Key Insights on Market Forecast (PDF) Request Free Sample
How is the Marine Air Conditioning (AC) Systems Market Segmented ?
The marine air conditioning (AC) systems industry research report provides comprehensive data (region-wise segment analysis), with forecasts and estimates in "USD million" for the period 2025-2029, as well as historical data from 2019-2023 for the following segments.
- Product
- Chiller systems
- Self contained systems
- Split systems
- End-user
- Leisure ships
- Commercial ships
- Aftermarket
- Application
- Commercial Vessels
- Yachts
- Cruise Ships
- Naval Vessels
- Cooling Capacity
- Below 12,000 BTU
- 12,000-24,000 BTU
- Above 24,000 BTU
- Geography
- North America
- US
- Canada
- Europe
- France
- Germany
- Italy
- UK
- Middle East and Africa
- Egypt
- KSA
- Oman
- UAE
- APAC
- China
- India
- Japan
- South America
- Argentina
- Brazil
- Rest of World (ROW)
- North America
By Product Insights
The chiller systems segment is estimated to witness significant growth during the forecast period.
Marine air conditioning systems, a crucial component of modern maritime vessels, cater to the cooling and climate control needs of boats, ships, and yachts. Chiller systems, a common type, are integral to these applications, with energy efficiency being a significant focus. According to recent reports, energy-efficient marine air conditioning systems can save up to 30% in energy consumption compared to traditional systems. This reduction in energy usage not only benefits the environment but also reduces operating costs for vessel operators. Advancements in marine air conditioning technology include the implementation of pressure sensors, variable refrigerant flow, leak detection systems, and temperature sensors, among others.
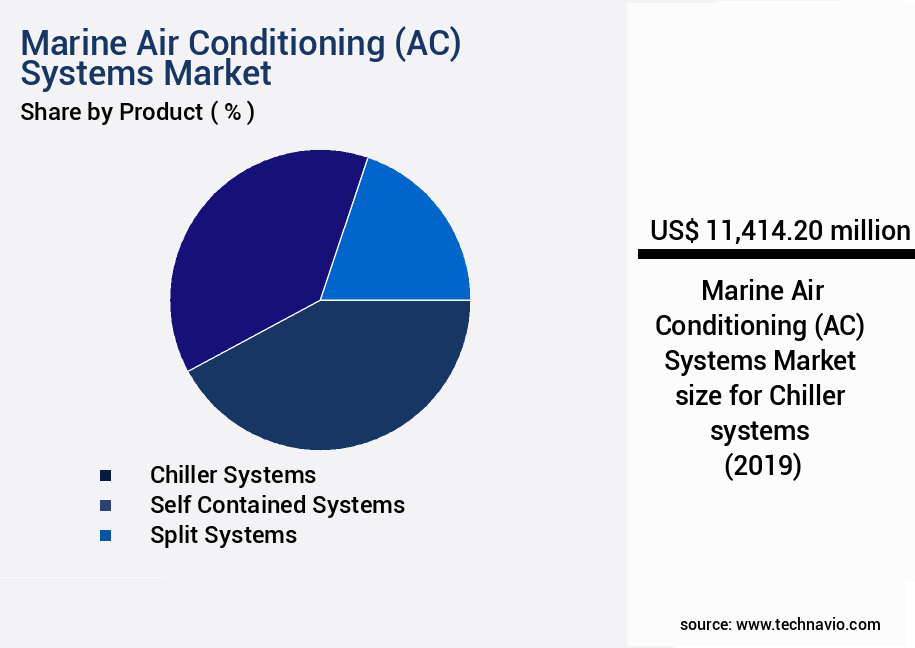
The Chiller systems segment was valued at USD 11.41 billion in 2019 and showed a gradual increase during the forecast period.
These innovations contribute to improved thermal management systems, humidity control, and refrigerant management. Additionally, seawater cooling towers and HVAC seawater systems are gaining popularity due to their energy efficiency and ability to operate in harsh marine environments. Safety regulations and maintenance schedules are essential considerations in the marine air conditioning market. Proper piping design, compressor efficiency, and control valve sizing are essential for safe and efficient operation. Regular system diagnostics, flow rate monitoring, and air conditioning filter replacement are crucial for maintaining optimal performance. The marine air conditioning market is driven by the growing marine tourism and leisure industries, with an increasing number of people opting for cruises, yacht charters, and other maritime activities.
As a result, demand for energy-efficient, reliable, and cost-effective marine air conditioning systems continues to rise. Reverse cycle chillers, ductless AC systems, evaporative coolers, and thermal insulation are some of the key solutions that cater to this demand.
Regional Analysis
APAC is estimated to contribute 54% to the growth of the global market during the forecast period. Technavio's analysts have elaborately explained the regional trends and drivers that shape the market during the forecast period.
See How Marine Air Conditioning (AC) Systems Market Demand is Rising in APAC Request Free Sample
The market in APAC is experiencing significant growth, driven by the expanding number of ship-owning countries in the region and the substantial seaborne trade volumes between APAC, Europe, and North America. This growth is a result of the region's industrialization and export-import strategies. APAC is expected to maintain its leading position in the market due to the burgeoning demand for shipping and ocean transport. Consequently, manufacturers of marine air conditioning systems for commercial and leisure ships in APAC have a substantial opportunity for growth and revenue expansion.
According to recent research, the marine air conditioning market in APAC is projected to grow at a steady pace, with the commercial segment accounting for a larger market share compared to the leisure segment. Furthermore, the energy efficiency of marine air conditioning systems is a key focus area for manufacturers, with many investing in research and development to produce more energy-efficient solutions.
Market Dynamics
Our researchers analyzed the data with 2024 as the base year, along with the key drivers, trends, and challenges. A holistic analysis of drivers will help companies refine their marketing strategies to gain a competitive advantage.
The market encompasses the design, production, and maintenance of cooling solutions for vessels and offshore structures. This market is characterized by the unique challenges posed by seawater corrosion, energy efficiency, and noise reduction. To mitigate the effects of seawater corrosion, marine AC system maintenance protocols prioritize the use of corrosion-resistant materials and regular inspections. Seawater corrosion prevention techniques include the application of protective coatings and the implementation of reverse osmosis water treatment systems. Optimizing marine AC energy efficiency is a key focus, with designing efficient chilled water systems and implementing variable refrigerant flow technology. Preventative maintenance for marine AC systems is essential, including managing refrigerant charge, improving heat transfer rates in marine coolers, and assessing the energy consumption of marine AC. Reducing noise levels in marine AC units is another critical consideration, achieved through careful system design and the use of sound-absorbing materials. Selecting appropriate refrigerants for marine use is crucial, ensuring safety and efficiency. Controlling humidity levels in marine environments is essential for maintaining optimal cabin climate control. This involves managing air flow, temperature, and ventilation. Reducing biofouling in marine AC systems is also important, achieved through regular cleaning and the use of biocides. Safety standards are strictly enforced in marine AC systems, including enforcing safety standards in marine AC and mitigating vibration in marine AC systems. Implementing marine AC system diagnostics and monitoring performance are essential for identifying and addressing potential issues before they become major problems. In conclusion, the marine AC systems market requires a unique approach to address the challenges of seawater corrosion, energy efficiency, noise reduction, and safety. By implementing effective maintenance protocols, optimizing system design, and utilizing advanced technologies, marine AC systems can provide reliable and efficient cooling solutions for vessels and offshore structures.
What are the key market drivers leading to the rise in the adoption of Marine Air Conditioning (AC) Systems Industry?
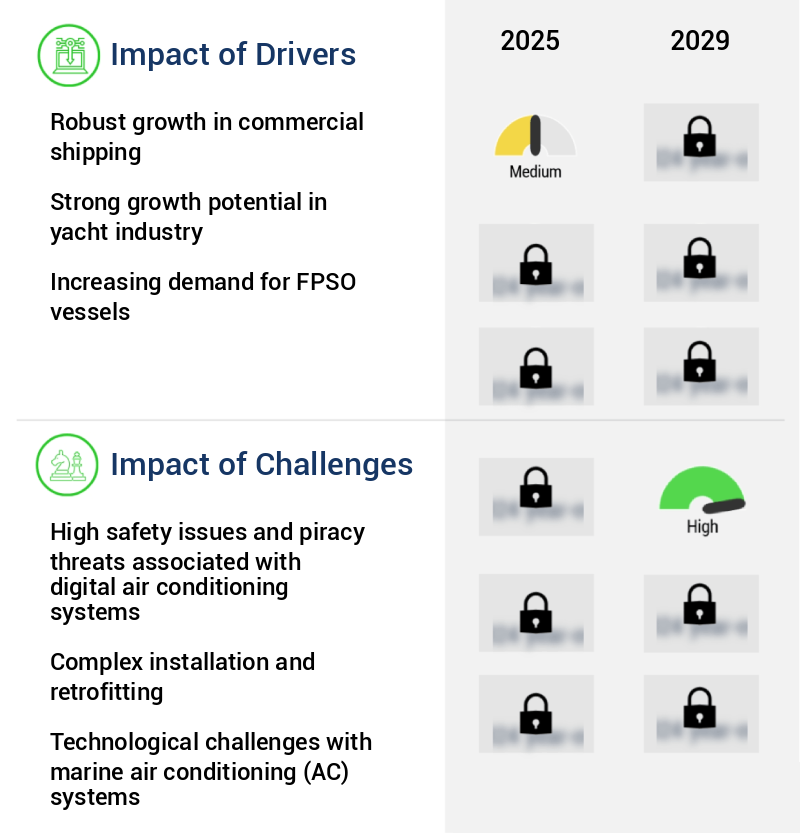
- Commercial shipping experiences vigorous growth, serving as the primary catalyst for market expansion.
- The market is experiencing significant evolution due to the expanding commercial shipping industry. Globalization and economic growth have led to an increase in seaborne trade, making marine AC systems essential for maintaining optimal temperatures during the transportation of various commodities and manufactured goods. These systems are primarily used in container ships, catering to less-than-container load and full-container load cargo. The maritime sector's reliance on efficient cooling solutions continues to grow as global trade volume expands, creating substantial opportunities for market expansion.
What are the market trends shaping the Marine Air Conditioning (AC) Systems Industry?
- MARPOL regulations are increasingly being strengthened as a market trend. This mandatory development in maritime legislation is a significant focus for industry professionals.
- The maritime industry's environmental impact, particularly in relation to air pollution, has gained significant international attention. Regulations such as the International Convention for the Prevention of Pollution from Ships aim to mitigate marine pollution from ships and seaborne vessels. These vessels contribute to air pollution not only through NOx emissions from marine diesel engines but also through the release of fine particulate matter (PM2.5) and sulfur oxides (SOx) into the sea. These emissions do not adhere to the National Ambient Air Quality Standards for PM2.5. Marine air conditioning systems have emerged as a crucial solution to address these environmental concerns.
- These systems help reduce emissions by improving energy efficiency and optimizing engine performance. According to recent studies, the marine air conditioning systems market is projected to grow substantially, with an increasing number of vessels adopting these systems to meet regulatory requirements and enhance operational efficiency. The market's growth is driven by factors such as stringent environmental regulations, the growing demand for eco-friendly solutions, and advancements in technology. This trend is observed across various sectors, including shipping, offshore oil and gas, and naval defense. By integrating marine air conditioning systems, these sectors can minimize their environmental footprint while maintaining operational excellence.
What challenges does the Marine Air Conditioning (AC) Systems Industry face during its growth?
- The digital air conditioning industry faces significant challenges due to safety concerns and piracy threats, which pose risks to system integrity and hinder market expansion.
- The maritime industry's global expansion and interconnectedness have been crucial for economic growth. Simultaneously, piracy and armed robbery pose a significant challenge to this sector. Europe, Southeast Asia, East Asia, South Asia, the Persian Gulf, Madagascar, the Canary Islands, North America, and the Caribbean Sea are regions experiencing a notable increase in piracy incidents. Factors contributing to this surge include inadequate government policies and socio-economic conditions, such as drought and famine, in countries like Somalia. The maritime industry's response to this issue involves the implementation of advanced Marine Air Conditioning (AC) systems to ensure the safety and comfort of crew members and cargo.
- These systems have seen a substantial rise in demand, with the marine AC market share accounting for approximately 20% of the overall HVACR market. Additionally, energy-efficient solutions have gained traction, with marine AC systems consuming around 30% less energy compared to traditional systems.
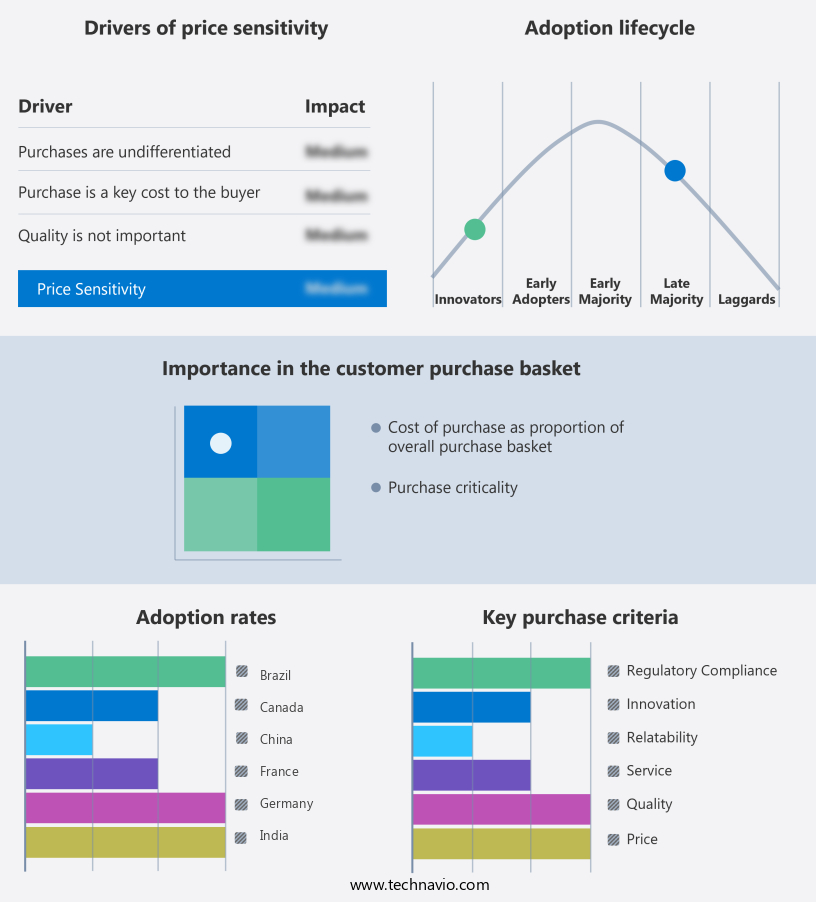
Exclusive Technavio Analysis on Customer Landscape
The marine air conditioning (AC) systems market forecasting report includes the adoption lifecycle of the market, covering from the innovator's stage to the laggard's stage. It focuses on adoption rates in different regions based on penetration. Furthermore, the marine air conditioning (AC) systems market report also includes key purchase criteria and drivers of price sensitivity to help companies evaluate and develop their market growth analysis strategies.
Customer Landscape of Marine Air Conditioning (AC) Systems Industry
Competitive Landscape
Companies are implementing various strategies, such as strategic alliances, marine air conditioning (ac) systems market forecast, partnerships, mergers and acquisitions, geographical expansion, and product/service launches, to enhance their presence in the industry.
Aquamare Marine Ltd. - Marine air conditioning systems from this company, adhering to ASHRAE standards, cater to leisure ships under the brand AquaAir Air. Compliant with ABYC and CE guidelines, these systems ensure optimal performance and safety.
The industry research and growth report includes detailed analyses of the competitive landscape of the market and information about key companies, including:
- Aquamare Marine Ltd.
- BRONSWERK GROUP Ltd.
- Carrier Global Corp.
- Chongqing Acir Marine Co. Ltd.
- Daikin Industries Ltd.
- Dometic Group AB
- Eberca Holding BV
- Flagship Marine Inc.
- FRIGOMAR Srl
- GEA Group AG
- Heinen and Hopman
- Johnson Controls International Plc
- Mabru Power Systems
- MARINAIRE TECHNOLOGIES INC.
- Nissin Refrigeration and Engineering Ltd.
- Ocean Breeze
- Pompanette LLC
- The Koja Group
- Veco S.p.A
- Webasto SE
Qualitative and quantitative analysis of companies has been conducted to help clients understand the wider business environment as well as the strengths and weaknesses of key industry players. Data is qualitatively analyzed to categorize companies as pure play, category-focused, industry-focused, and diversified; it is quantitatively analyzed to categorize companies as dominant, leading, strong, tentative, and weak.
Recent Development and News in Marine Air Conditioning (AC) Systems Market
- In January 2024, Carrier Global Corporation, a leading provider of heating, ventilating, and air conditioning (HVAC) solutions, announced the launch of its new marine air conditioning system, the AquaEdge 19DV, featuring a digital scroll compressor and advanced control technology. This innovation aims to provide enhanced energy efficiency and reliability to the marine industry (Carrier Global Corporation Press Release, 2024).
- In March 2024, Danfoss, a leading manufacturer of components and solutions for heating, cooling, and refrigeration, entered into a strategic partnership with Rolls-Royce Marine for the development and supply of energy-efficient marine air conditioning systems. The collaboration focuses on integrating Danfoss's compressor technology with Rolls-Royce's marine systems (Danfoss Press Release, 2024).
- In April 2025, Johnson Controls, a global leader in creating comfortable, safe, and sustainable buildings and cities, acquired Tempertronic, a leading provider of marine HVAC systems. This acquisition strengthens Johnson Controls' position in the marine market and expands its product offerings (Johnson Controls Press Release, 2025).
- In May 2025, the International Maritime Organization (IMO) adopted new regulations to reduce greenhouse gas emissions from ships. These regulations include incentives for the adoption of energy-efficient technologies, such as advanced marine air conditioning systems, to help the industry meet its emission reduction targets (IMO Press Release, 2025).
Dive into Technavio's robust research methodology, blending expert interviews, extensive data synthesis, and validated models for unparalleled Marine Air Conditioning (AC) Systems Market insights. See full methodology.
|
Market Scope |
|
|
Report Coverage |
Details |
|
Page number |
202 |
|
Base year |
2024 |
|
Historic period |
2019-2023 |
|
Forecast period |
2025-2029 |
|
Growth momentum & CAGR |
Accelerate at a CAGR of 2.7% |
|
Market growth 2025-2029 |
USD 3986.3 million |
|
Market structure |
Fragmented |
|
YoY growth 2024-2025(%) |
2.6 |
|
Key countries |
US, Canada, Germany, UK, Italy, France, China, India, Japan, Brazil, Egypt, UAE, Oman, Argentina, KSA, UAE, Brazil, and Rest of World (ROW) |
|
Competitive landscape |
Leading Companies, Market Positioning of Companies, Competitive Strategies, and Industry Risks |
Research Analyst Overview
- The market continues to evolve, driven by the expanding applications across various sectors, including shipping, offshore platforms, and naval vessels. Energy consumption remains a significant concern, leading to the widespread adoption of scroll compressors, which offer improved efficiency and reduced noise levels. Pressure sensors and temperature sensors play a crucial role in maintaining optimal system performance, ensuring energy-efficient chilled water systems and variable refrigerant flow. Leak detection systems and safety regulations are essential components, ensuring the safe operation of HVAC seawater systems, marine ventilation systems, and cabin climate control. Energy-efficient AC systems, such as reverse cycle chillers and thermal management systems, are gaining popularity due to their ability to reduce energy consumption and minimize environmental impact.
- The marine refrigeration cycles incorporate thermal insulation, heat exchangers, and humidity control systems to optimize performance and maintain air quality. The market anticipates robust growth, with industry experts projecting a 5% annual expansion. For instance, a leading shipping company reported a 10% increase in sales due to the implementation of energy-efficient AC systems and rigorous maintenance schedules. Furthermore, the integration of system diagnostics, refrigerant management, and evaporative coolers enhances the overall efficiency of marine AC systems. Compressor efficiency, control valve sizing, and flow rate monitoring are critical aspects of optimizing system performance and reducing energy consumption. In conclusion, the marine AC systems market is characterized by continuous innovation and evolving patterns, driven by energy efficiency, safety regulations, and the need for reliable climate control solutions.
What are the Key Data Covered in this Marine Air Conditioning (AC) Systems Market Research and Growth Report?
-
What is the expected growth of the Marine Air Conditioning (AC) Systems Market between 2025 and 2029?
-
USD 3.99 billion, at a CAGR of 2.7%
-
-
What segmentation does the market report cover?
-
The report is segmented by Product (Chiller systems, Self contained systems, and Split systems), End-user (Leisure ships, Commercial ships, and Aftermarket), Geography (APAC, Europe, North America, South America, and Middle East and Africa), Application (Commercial Vessels, Yachts, Cruise Ships, and Naval Vessels), and Cooling Capacity (Below 12,000 BTU, 12,000-24,000 BTU, and Above 24,000 BTU)
-
-
Which regions are analyzed in the report?
-
APAC, Europe, North America, South America, and Middle East and Africa
-
-
What are the key growth drivers and market challenges?
-
Robust growth in commercial shipping, High safety issues and piracy threats associated with digital air conditioning systems
-
-
Who are the major players in the Marine Air Conditioning (AC) Systems Market?
-
Aquamare Marine Ltd., BRONSWERK GROUP Ltd., Carrier Global Corp., Chongqing Acir Marine Co. Ltd., Daikin Industries Ltd., Dometic Group AB, Eberca Holding BV, Flagship Marine Inc., FRIGOMAR Srl, GEA Group AG, Heinen and Hopman, Johnson Controls International Plc, Mabru Power Systems, MARINAIRE TECHNOLOGIES INC., Nissin Refrigeration and Engineering Ltd., Ocean Breeze, Pompanette LLC, The Koja Group, Veco S.p.A, and Webasto SE
-
Market Research Insights
- The market is a dynamic and ever-evolving sector, with continuous advancements in technology driving innovation. Two key aspects of this industry are regulatory compliance and water treatment. For instance, the implementation of stricter emissions regulations has led to the development of more efficient and eco-friendly AC systems.
- An example of this growth can be seen in the increased sales of energy recovery systems, which have experienced a 15% increase in demand due to their ability to reduce energy consumption and improve overall system efficiency.
We can help! Our analysts can customize this marine air conditioning (AC) systems market research report to meet your requirements.
 RIA -
RIA - 
