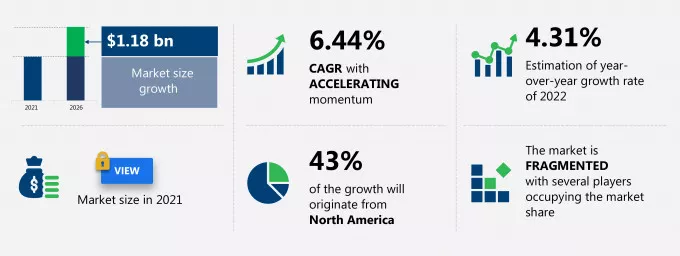
The mascarpone cheese market share is expected to increase to USD 1.18 billion from 2021 to 2026, and the market's growth momentum will accelerate at a CAGR of 6.44%.
This mascarpone cheese market research report provides valuable insights on the post COVID-19 impact on the market, which will help companies evaluate their business approaches. Furthermore, this report extensively covers mascarpone cheese market segmentation by distribution channel (offline and online) and geography (North America, Europe, APAC, South America, and Middle East and Africa). The mascarpone cheese market report also offers information on several market vendors, including Arla Foods amba, BelGioioso Cheese Inc., BV Dairy, Elle and Vire, Emborg Uhrenholt AS, EMILIO MAURI S.p.A., Ferraro Dairy Foods, Goloka Dairy Products Pvt. Ltd., Granarolo S.p.A., La Casa Del Formaggio, Land O Lakes Inc., Meadow Foods Ltd., Mila LATTE MONTAGNA ALTO ADIGE Soc. Agr. Coop., Newlat Food SpA, Phoon Huat Pte. Ltd., Piatnica, Quality Cheese Inc., Sordi Srl, Tatua Co operative Dairy Co. Ltd., and Woolworths Group Ltd. among others.
What will the Mascarpone Cheese Market Size be During the Forecast Period?
Download the Free Report Sample to Unlock the Mascarpone Cheese Market Size for the Forecast Period and Other Important Statistics
Mascarpone Cheese Market: Key Drivers, Trends, and Challenges
The increased demand for convenience foods is notably driving the mascarpone cheese market growth, although factors such as high operational costs of raw materials may impede the market growth. Our research analysts have studied the historical data and deduced the key market drivers and the COVID-19 pandemic impact on the mascarpone cheese industry. The holistic analysis of the drivers will help in deducing end goals and refining marketing strategies to gain a competitive edge.
Key Mascarpone Cheese Market Driver
- The increased demand for convenience foods is one of the factors driving the mascarpone cheese market growth.
- Rapid urbanization around the world has increased disposable income leading to an increase in job opportunities.
- The female workforce has increased, which has spurred the demand for food products that are ready-to-eat (RTE) with minimal preparation time.
- The rise in the urban population is inculcating new food habits and trends of developing preferences for international food patterns. This, in turn, will drive the mascarpone cheese offerings in the RTE segment during the forecast period.
Key Mascarpone Cheese Market Trend
- Growth in the expansion of cheese production facilities is one of the key mascarpone cheese market trends fueling the market growth.
- Dairy product manufacturers are expanding their capacities and building new processing plants to explore new market opportunities in cheese products and meet the increased demand of customers.
- Dairy product manufacturers are focusing on increasing their production capabilities and capturing major market share to improve their competitive advantages.
- On June 10, 2022, the Minister of Agriculture and Agri-Food of Canada announced an investment of up to $2.7 million for Quality Cheese in Ontario under the dairy processing investment fund to increase production and competitiveness. This will help the dairy companies to improve their production and volume to meet the increasing global demand for mascarpone cheese during the forecast period.
Key Mascarpone Cheese Market Challenge
- High operational costs of raw materials is one of the key factors challenging the mascarpone cheese market growth.
- The increase in dairy prices globally can be attributed to the high cost of dairy processing. Also, various other costs are involved in transporting dairy products from receiving desk to the product delivery desk.
- Different types of dairy processing equipment are required for processing activities, which cost around $40,000 to $2 million.
- The intense competition in the market has compelled vendors to offer their products at competitive prices. However, this will increase the operational costs and will negatively impact the market growth during the forecast period.
This mascarpone cheese market analysis report also provides detailed information on other upcoming trends and challenges that will have a far-reaching effect on the market growth. The actionable insights on the trends and challenges will help companies evaluate and develop growth strategies for 2022-2026.
Parent Market Analysis
Technavio categorizes the global mascarpone cheese market as a part of the global packaged foods and meats market. Our research report has extensively covered external factors influencing the parent market growth potential in the coming years, which will determine the levels of growth of the mascarpone cheese market during the forecast period.
Who are the Major Mascarpone Cheese Market Vendors?
The report analyzes the market's competitive landscape and offers information on several market vendors, including:
- Arla Foods amba
- BelGioioso Cheese Inc.
- BV Dairy
- Elle and Vire
- Emborg Uhrenholt AS
- EMILIO MAURI S.p.A.
- Ferraro Dairy Foods
- Goloka Dairy Products Pvt. Ltd.
- Granarolo S.p.A.
- La Casa Del Formaggio
- Land O Lakes Inc.
- Meadow Foods Ltd.
- Mila LATTE MONTAGNA ALTO ADIGE Soc. Agr. Coop.
- Newlat Food SpA
- Phoon Huat Pte. Ltd.
- Piatnica
- Quality Cheese Inc.
- Sordi Srl
- Tatua Co operative Dairy Co. Ltd.
- Woolworths Group Ltd.
This statistical study of the mascarpone cheese market encompasses successful business strategies deployed by the key vendors. The mascarpone cheese market is fragmented and the vendors are deploying growth strategies such as introducing products, expanding their presence through M&A, and launching marketing campaigns to compete in the market.
Product Insights and News
- Arla.com - The company offers mascarpone cheese products under the brand Nutrilac.
- Mauri.it - The company offers mascarpone cheese products such as a duet cake with walnut, a duet with walnuts, and a duet with pistachios.
- Ferrarodairyfoods.com.au - The company offers mascarpone cheese products such as cream-based cheese.
To make the most of the opportunities and recover from post COVID-19 impact, market vendors should focus more on the growth prospects in the fast-growing segments, while maintaining their positions in the slow-growing segments.
The mascarpone cheese market forecast report offers in-depth insights into key vendor profiles. The profiles include information on the production, sustainability, and prospects of the leading companies.
Mascarpone Cheese Market Value Chain Analysis
Our report provides extensive information on the value chain analysis for the mascarpone cheese market, which vendors can leverage to gain a competitive advantage during the forecast period. The end-to-end understanding of the value chain is essential in profit margin optimization and evaluation of business strategies. The data available in our value chain analysis segment can help vendors drive costs and enhance customer services during the forecast period.
Which are the Key Regions for Mascarpone Cheese Market?
For more insights on the market share of various regions Request for a FREE sample now!
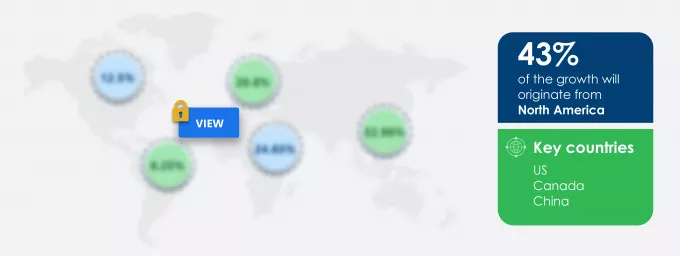
43% of the market's growth will originate from North America during the forecast period. The US and Canada are the key markets for the mascarpone cheese market in North America. Market growth in this region will be slower than the growth of the market in Europe and APAC.
The presence of a well-established food and beverage industry and an organized retail sector will facilitate the mascarpone cheese market growth in North America over the forecast period. This market research report entails detailed information on the competitive intelligence, marketing gaps, and regional opportunities in store for vendors, which will assist in creating efficient business plans.
COVID Impact and Recovery Analysis
The outbreak of COVID-19 negatively impacted the demand for mascarpone cheese in North America in 2020. However, with the initiation of the COVID-19 vaccination drives and the lifting of lockdown restrictions in the region from Q4 2020, the mascarpone cheese manufacturing units resumed operations of mascarpone cheese processing units. Therefore, the regional market is anticipated to witness growth, owing to the increasing consumption of dairy products among people and rising demand from food and beverage industries during the forecast period.
What are the Revenue-generating Distribution Channel Segments in the Mascarpone Cheese Market?

To gain further insights on the market contribution of various segments Request for a FREE sample
The mascarpone cheese market share growth in the offline segment will be significant during the forecast period. The offline distributional channels include specialty stores, hypermarkets, and others, which have a huge collection of cheese from different countries. A key factor that increases the customer preference for offline distribution channels is the availability of trained staff who can provide accurate information about different cheese products. This helps customers to make informed decisions based on product knowledge. Store staff plays a crucial role in educating customers about the products and converting them into potential buyers. Such benefits provided to consumers in offline stores will drive market growth during the forecast period.
This report provides an accurate prediction of the contribution of all the segments to the growth of the mascarpone cheese market size and actionable market insights on post COVID-19 impact on each segment.
|
Mascarpone Cheese Market Scope
|
|
Report Coverage
|
Details
|
|
Page number
|
120
|
|
Base year
|
2021
|
|
Forecast period
|
2022-2026
|
|
Growth momentum & CAGR
|
Accelerate at a CAGR of 6.44%
|
|
Market growth 2022-2026
|
$ 1.18 billion
|
|
Market structure
|
Fragmented
|
|
YoY growth (%)
|
4.31
|
|
Regional analysis
|
North America, Europe, APAC, South America, and Middle East and Africa
|
|
Performing market contribution
|
North America at 43%
|
|
Key consumer countries
|
US, Canada, China, Germany, and France
|
|
Competitive landscape
|
Leading companies, Competitive strategies, Consumer engagement scope
|
|
Key companies profiled
|
Arla Foods amba, BelGioioso Cheese Inc., BV Dairy, Elle and Vire, Emborg Uhrenholt AS, EMILIO MAURI S.p.A., Ferraro Dairy Foods, Goloka Dairy Products Pvt. Ltd., Granarolo S.p.A., La Casa Del Formaggio, Land O Lakes Inc., Meadow Foods Ltd., Mila LATTE MONTAGNA ALTO ADIGE Soc. Agr. Coop., Newlat Food SpA, Phoon Huat Pte. Ltd., Piatnica, Quality Cheese Inc., Sordi Srl, Tatua Co operative Dairy Co. Ltd., and Woolworths Group Ltd.
|
|
Market dynamics
|
Parent market analysis, Market growth inducers and obstacles, Fast-growing and slow-growing segment analysis, COVID-19 impact and recovery analysis and future consumer dynamics, Market condition analysis for forecast period
|
|
Customization purview
|
If our report has not included the data that you are looking for, you can reach out to our analysts and get segments customized.
|
Request for a FREE sample
What are the Key Data Covered in this Mascarpone Cheese Market Report?
- CAGR of the market during the forecast period 2022-2026
- Detailed information on factors that will drive mascarpone cheese market growth during the next five years
- Precise estimation of the mascarpone cheese market size and its contribution to the parent market
- Accurate predictions on upcoming trends and changes in consumer behavior
- The growth of the mascarpone cheese industry across North America, Europe, APAC, South America, and Middle East and Africa
- A thorough analysis of the market's competitive landscape and detailed information on vendors
- Comprehensive details of factors that will challenge the growth of mascarpone cheese market vendors
We can help! Our analysts can customize this report to meet your requirements. Get in touch
1 Executive Summary
- 1.1 Market overview
- Exhibit 01: Executive Summary – Chart on Market Overview
- Exhibit 02: Executive Summary – Data Table on Market Overview
- Exhibit 03: Executive Summary – Chart on Global Market Characteristics
- Exhibit 04: Executive Summary – Chart on Market by Geography
- Exhibit 05: Executive Summary – Chart on Market Segmentation by Distribution Channel
- Exhibit 06: Executive Summary – Chart on Incremental Growth
- Exhibit 07: Executive Summary – Data Table on Incremental Growth
- Exhibit 08: Executive Summary – Chart on Vendor Market Positioning
2 Market Landscape
- 2.1 Market ecosystem
- Exhibit 09: Parent market
- Exhibit 10: Market Characteristics
3 Market Sizing
- 3.1 Market definition
- Exhibit 11: Offerings of vendors included in the market definition
- 3.2 Market segment analysis
- Exhibit 12: Market segments
- 3.4 Market outlook: Forecast for 2021-2026
- Exhibit 13: Chart on Global - Market size and forecast 2021-2026 ($ million)
- Exhibit 14: Data Table on Global - Market size and forecast 2021-2026 ($ million)
- Exhibit 15: Chart on Global Market: Year-over-year growth 2021-2026 (%)
- Exhibit 16: Data Table on Global Market: Year-over-year growth 2021-2026 (%)
4 Five Forces Analysis
- 4.1 Five forces summary
- Exhibit 17: Five forces analysis - Comparison between 2021 and 2026
- 4.2 Bargaining power of buyers
- Exhibit 18: Chart on Bargaining power of buyers – Impact of key factors 2021 and 2026
- 4.3 Bargaining power of suppliers
- Exhibit 19: Bargaining power of suppliers – Impact of key factors in 2021 and 2026
- 4.4 Threat of new entrants
- Exhibit 20: Threat of new entrants – Impact of key factors in 2021 and 2026
- 4.5 Threat of substitutes
- Exhibit 21: Threat of substitutes – Impact of key factors in 2021 and 2026
- 4.6 Threat of rivalry
- Exhibit 22: Threat of rivalry – Impact of key factors in 2021 and 2026
- 4.7 Market condition
- Exhibit 23: Chart on Market condition - Five forces 2021 and 2026
5 Market Segmentation by Distribution Channel
- 5.1 Market segments
- Exhibit 24: Chart on Distribution Channel - Market share 2021-2026 (%)
- Exhibit 25: Data Table on Distribution Channel - Market share 2021-2026 (%)
- 5.2 Comparison by Distribution Channel
- Exhibit 26: Chart on Comparison by Distribution Channel
- Exhibit 27: Data Table on Comparison by Distribution Channel
- 5.3 Offline - Market size and forecast 2021-2026
- Exhibit 28: Chart on Offline - Market size and forecast 2021-2026 ($ million)
- Exhibit 29: Data Table on Offline - Market size and forecast 2021-2026 ($ million)
- Exhibit 30: Chart on Offline - Year-over-year growth 2021-2026 (%)
- Exhibit 31: Data Table on Offline - Year-over-year growth 2021-2026 (%)
- 5.4 Online - Market size and forecast 2021-2026
- Exhibit 32: Chart on Online - Market size and forecast 2021-2026 ($ million)
- Exhibit 33: Data Table on Online - Market size and forecast 2021-2026 ($ million)
- Exhibit 34: Chart on Online - Year-over-year growth 2021-2026 (%)
- Exhibit 35: Data Table on Online - Year-over-year growth 2021-2026 (%)
- 5.5 Market opportunity by Distribution Channel
- Exhibit 36: Market opportunity by Distribution Channel ($ million)
6 Customer Landscape
- 6.1 Customer landscape overview
- Exhibit 37: Analysis of price sensitivity, lifecycle, customer purchase basket, adoption rates, and purchase criteria
7 Geographic Landscape
- 7.1 Geographic segmentation
- Exhibit 38: Chart on Market share by geography 2021-2026 (%)
- Exhibit 39: Data Table on Market share by geography 2021-2026 (%)
- 7.2 Geographic comparison
- Exhibit 40: Chart on Geographic comparison
- Exhibit 41: Data Table on Geographic comparison
- 7.3 North America - Market size and forecast 2021-2026
- Exhibit 42: Chart on North America - Market size and forecast 2021-2026 ($ million)
- Exhibit 43: Data Table on North America - Market size and forecast 2021-2026 ($ million)
- Exhibit 44: Chart on North America - Year-over-year growth 2021-2026 (%)
- Exhibit 45: Data Table on North America - Year-over-year growth 2021-2026 (%)
- 7.4 Europe - Market size and forecast 2021-2026
- Exhibit 46: Chart on Europe - Market size and forecast 2021-2026 ($ million)
- Exhibit 47: Data Table on Europe - Market size and forecast 2021-2026 ($ million)
- Exhibit 48: Chart on Europe - Year-over-year growth 2021-2026 (%)
- Exhibit 49: Data Table on Europe - Year-over-year growth 2021-2026 (%)
- 7.5 APAC - Market size and forecast 2021-2026
- Exhibit 50: Chart on APAC - Market size and forecast 2021-2026 ($ million)
- Exhibit 51: Data Table on APAC - Market size and forecast 2021-2026 ($ million)
- Exhibit 52: Chart on APAC - Year-over-year growth 2021-2026 (%)
- Exhibit 53: Data Table on APAC - Year-over-year growth 2021-2026 (%)
- 7.6 South America - Market size and forecast 2021-2026
- Exhibit 54: Chart on South America - Market size and forecast 2021-2026 ($ million)
- Exhibit 55: Data Table on South America - Market size and forecast 2021-2026 ($ million)
- Exhibit 56: Chart on South America - Year-over-year growth 2021-2026 (%)
- Exhibit 57: Data Table on South America - Year-over-year growth 2021-2026 (%)
- 7.7 Middle East and Africa - Market size and forecast 2021-2026
- Exhibit 58: Chart on Middle East and Africa - Market size and forecast 2021-2026 ($ million)
- Exhibit 59: Data Table on Middle East and Africa - Market size and forecast 2021-2026 ($ million)
- Exhibit 60: Chart on Middle East and Africa - Year-over-year growth 2021-2026 (%)
- Exhibit 61: Data Table on Middle East and Africa - Year-over-year growth 2021-2026 (%)
- 7.8 US - Market size and forecast 2021-2026
- Exhibit 62: Chart on US - Market size and forecast 2021-2026 ($ million)
- Exhibit 63: Data Table on US - Market size and forecast 2021-2026 ($ million)
- Exhibit 64: Chart on US - Year-over-year growth 2021-2026 (%)
- Exhibit 65: Data Table on US - Year-over-year growth 2021-2026 (%)
- 7.9 Germany - Market size and forecast 2021-2026
- Exhibit 66: Chart on Germany - Market size and forecast 2021-2026 ($ million)
- Exhibit 67: Data Table on Germany - Market size and forecast 2021-2026 ($ million)
- Exhibit 68: Chart on Germany - Year-over-year growth 2021-2026 (%)
- Exhibit 69: Data Table on Germany - Year-over-year growth 2021-2026 (%)
- 7.10 China - Market size and forecast 2021-2026
- Exhibit 70: Chart on China - Market size and forecast 2021-2026 ($ million)
- Exhibit 71: Data Table on China - Market size and forecast 2021-2026 ($ million)
- Exhibit 72: Chart on China - Year-over-year growth 2021-2026 (%)
- Exhibit 73: Data Table on China - Year-over-year growth 2021-2026 (%)
- 7.11 Canada - Market size and forecast 2021-2026
- Exhibit 74: Chart on Canada - Market size and forecast 2021-2026 ($ million)
- Exhibit 75: Data Table on Canada - Market size and forecast 2021-2026 ($ million)
- Exhibit 76: Chart on Canada - Year-over-year growth 2021-2026 (%)
- Exhibit 77: Data Table on Canada - Year-over-year growth 2021-2026 (%)
- 7.12 France - Market size and forecast 2021-2026
- Exhibit 78: Chart on France - Market size and forecast 2021-2026 ($ million)
- Exhibit 79: Data Table on France - Market size and forecast 2021-2026 ($ million)
- Exhibit 80: Chart on France - Year-over-year growth 2021-2026 (%)
- Exhibit 81: Data Table on France - Year-over-year growth 2021-2026 (%)
- 7.13 Market opportunity by geography
- Exhibit 82: Market opportunity by geography ($ million)
8 Drivers, Challenges, and Trends
- 8.3 Impact of drivers and challenges
- Exhibit 83: Impact of drivers and challenges in 2021 and 2026
9 Vendor Landscape
- 9.2 Vendor landscape
- Exhibit 84: Overview on Criticality of inputs and Factors of differentiation
- 9.3 Landscape disruption
- Exhibit 85: Overview on factors of disruption
- 9.4 Industry risks
- Exhibit 86: Impact of key risks on business
10 Vendor Analysis
- 10.1 Vendors covered
- Exhibit 87: Vendors covered
- 10.2 Market positioning of vendors
- Exhibit 88: Matrix on vendor position and classification
- 10.3 Arla Foods amba
- Exhibit 89: Arla Foods amba - Overview
- Exhibit 90: Arla Foods amba - Business segments
- Exhibit 91: Arla Foods amba - Key offerings
- Exhibit 92: Arla Foods amba - Segment focus
- 10.4 EMILIO MAURI S.p.A.
- Exhibit 93: EMILIO MAURI S.p.A. - Overview
- Exhibit 94: EMILIO MAURI S.p.A. - Product / Service
- Exhibit 95: EMILIO MAURI S.p.A. - Key offerings
- 10.5 Ferraro Dairy Foods
- Exhibit 96: Ferraro Dairy Foods - Overview
- Exhibit 97: Ferraro Dairy Foods - Product / Service
- Exhibit 98: Ferraro Dairy Foods - Key offerings
- 10.6 Goloka Dairy Products Pvt. Ltd.
- Exhibit 99: Goloka Dairy Products Pvt. Ltd. - Overview
- Exhibit 100: Goloka Dairy Products Pvt. Ltd. - Product / Service
- Exhibit 101: Goloka Dairy Products Pvt. Ltd. - Key offerings
- 10.7 Granarolo S.p.A.
- Exhibit 102: Granarolo S.p.A. - Overview
- Exhibit 103: Granarolo S.p.A. - Product / Service
- Exhibit 104: Granarolo S.p.A. - Key offerings
- 10.8 Meadow Foods Ltd.
- Exhibit 105: Meadow Foods Ltd. - Overview
- Exhibit 106: Meadow Foods Ltd. - Product / Service
- Exhibit 107: Meadow Foods Ltd. - Key offerings
- 10.9 Mila LATTE MONTAGNA ALTO ADIGE Soc. Agr. Coop.
- Exhibit 108: Mila LATTE MONTAGNA ALTO ADIGE Soc. Agr. Coop. - Overview
- Exhibit 109: Mila LATTE MONTAGNA ALTO ADIGE Soc. Agr. Coop. - Product / Service
- Exhibit 110: Mila LATTE MONTAGNA ALTO ADIGE Soc. Agr. Coop. - Key offerings
- 10.10 Newlat Food SpA
- Exhibit 111: Newlat Food SpA - Overview
- Exhibit 112: Newlat Food SpA - Product / Service
- Exhibit 113: Newlat Food SpA - Key offerings
- 10.11 Piatnica
- Exhibit 114: Piatnica - Overview
- Exhibit 115: Piatnica - Product / Service
- Exhibit 116: Piatnica - Key offerings
- 10.12 Quality Cheese Inc.
- Exhibit 117: Quality Cheese Inc. - Overview
- Exhibit 118: Quality Cheese Inc. - Product / Service
- Exhibit 119: Quality Cheese Inc. - Key offerings
11 Appendix
- 11.2 Inclusions and exclusions checklist
- Exhibit 120: Inclusions checklist
- Exhibit 121: Exclusions checklist
- 11.3 Currency conversion rates for US$
- Exhibit 122: Currency conversion rates for US$
- 11.4 Research methodology
- Exhibit 123: Research methodology
- Exhibit 124: Validation techniques employed for market sizing
- Exhibit 125: Information sources
- 11.5 List of abbreviations
- Exhibit 126: List of abbreviations
- food allergy among consumers: There is an increase in the number of people suffering from food allergies globally. Food allergy is caused when the immune system reacts to the ingestion of certain foods. Ingredients of packaged foods and meats that can create allergic reactions in some people include (but are not limited to) milk, eggs, fish, crustacean shellfish (e.g., crab, lobster, and shrimp), tree nuts (e.g., almonds, walnuts, and pecan), peanuts, wheat, and soybeans. Even consumption of small amounts of food allergens can trigger signs and symptoms such as digestive problems, hives, and swollen airways. In some people, a food allergy can cause severe symptoms, or even a life-threatening reaction is, known as anaphylaxis. For example, in the US, nearly 3% of the adult population suffers from shellfish allergy.


