Military Battery Market Size 2024-2028
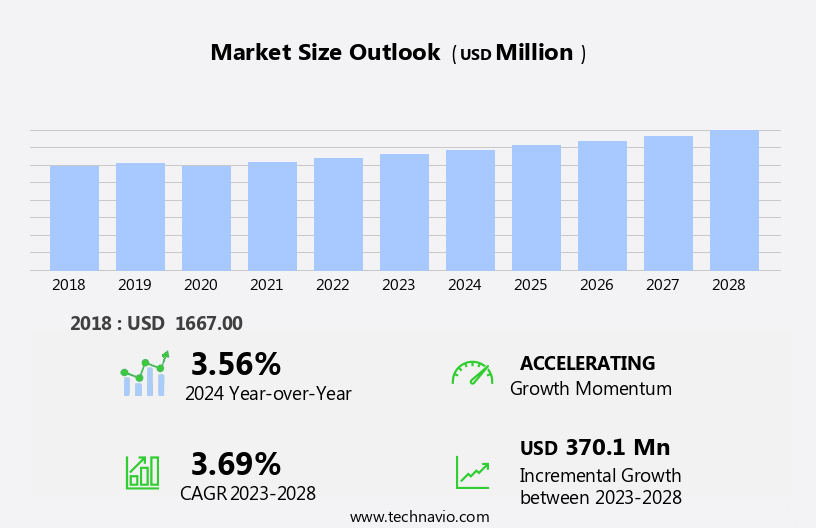
The military battery market size is forecast to increase by USD 370.1 million, at a CAGR of 3.69% between 2023 and 2028.
- The market is poised for significant growth, driven by increasing military spending and the expanding adoption of military drones. Military batteries play a crucial role in powering various military applications, including unmanned aerial vehicles (UAVs), communication systems, and weapon systems. The growing investment in military modernization and defense technology is fueling the demand for advanced batteries that offer high energy density, long cycle life, and reliability. Moreover, the necessity for adherence to military standards, such as MIL-STD-810 for harsh environmental conditions and MIL-STD-1275 for power systems, presents both opportunities and challenges for market participants. On the one hand, these standards ensure the reliability and durability of military batteries, making them suitable for mission-critical applications.
- On the other hand, meeting these stringent requirements can increase the cost of production and limit the number of potential suppliers. Despite these opportunities, the market faces challenges, including the need for lightweight and compact batteries to reduce the overall weight of military equipment and the requirement for long operational life to minimize the need for frequent battery replacements. Additionally, the market is subject to regulatory and geopolitical risks, such as export restrictions and geopolitical tensions, which can impact the supply chain and pricing dynamics. Companies seeking to capitalize on the market opportunities and navigate these challenges effectively must focus on developing innovative battery technologies that meet military standards while addressing the specific requirements of military applications.
What will be the Size of the Military Battery Market during the forecast period?

Request Free Sample
The market is characterized by its continuous evolution and dynamic nature, with ongoing advancements shaping the landscape. High-performance batteries play a crucial role in various sectors, including electronic warfare and military specifications, where shock resistance and power management are paramount. Sealed batteries find applications in weapon systems, while energy storage solutions are essential for ground vehicles and naval applications. Long-life batteries are a priority for defense organizations, necessitating stringent safety measures and certifications. Battery performance evaluation and analysis are integral to ensuring optimal battery efficiency and reliability. Lithium-ion batteries, with their high energy density and power conditioning capabilities, are increasingly adopted for aerospace applications.
Battery size, weight, and resistance are critical factors, as are temperature management and battery shape. Power backup and emergency power requirements necessitate robust battery manufacturing processes and rigorous testing. Rechargeable batteries, including secondary batteries and nickel-cadmium batteries, offer advantages in terms of sustainability and cost-effectiveness. Battery disposal and recycling are growing concerns, with a focus on minimizing environmental impact. Vibration and water resistance are essential for ground vehicles and naval applications, while extreme temperature batteries and high-power batteries cater to specific defense requirements. Battery anode, cathode, electrolyte, and separator technologies continue to evolve, driving performance improvements and enabling new applications.
Battery connectors, impedance, and efficiency are essential considerations for power distribution and power conversion. In the military context, battery manufacturing and reliability are paramount, with ongoing research and development aimed at enhancing battery durability and resistance to dust and vibration. Battery capacity, discharge rate, and voltage are essential factors in meeting the diverse power requirements of military applications.
How is this Military Battery Industry segmented?
The military battery industry research report provides comprehensive data (region-wise segment analysis), with forecasts and estimates in "USD million" for the period 2024-2028, as well as historical data from 2018-2022 for the following segments.
- End-user
- OEM
- Aftermarket
- Defense Forces
- System Integrators
- Technology
- Non-rechargeable batteries
- Rechargeable batteries
- Emerging Technologies
- Platform
- Ground
- Airborne
- Marine
- Space
- Munition
- Wearable/Portable Soldier Systems
- Composition
- Lead acid
- Nickel-based
- Thermal
- Silver-based
- Alkaline/Carbon-zinc
- Lithium Variants
- Geography
- North America
- Europe
- APAC
- China
- India
- Japan
- South Korea
- South America
- Rest of World (ROW)
By End-user Insights
The OEM segment is estimated to witness significant growth during the forecast period.
The market is experiencing significant growth due to the increasing production of military equipment, including UAVs, vehicles, and weapon systems. The defense industry's expansion over the past decade is expected to continue, fueled by rising military spending. In 2023, North America accounted for a substantial share of military battery sales and is projected to maintain its leading position in the segment. The US, in particular, is a major contributor to this trend. High-performance batteries are essential for various military applications, including electronic warfare, power management, and energy storage. Military specifications demand shock resistance, long battery life, and reliability, which are addressed through nickel-cadmium batteries and secondary batteries.
Vibration and water resistance are also crucial factors, as are extreme temperature batteries for aerospace applications. Battery certifications, power conversion, and power distribution are essential aspects of military battery systems. Sealed batteries and rechargeable batteries are preferred for their power backup capabilities, while battery disposal and recycling are important considerations for sustainability. Lithium-ion batteries and lead-acid batteries are popular choices for their high energy density and battery capacity, respectively. Battery testing, durability, and safety are critical factors in military applications. Battery performance evaluation and analysis are ongoing processes to ensure optimal functionality in ground, naval, and aerospace applications.
Battery size, efficiency, and impedance are essential factors in power conditioning and battery manufacturing. In summary, the market is driven by the increasing demand for military equipment and rising military spending. High-performance batteries cater to various military applications, with a focus on durability, reliability, and safety. North America remains a significant market, with the US being a major contributor. The market's evolution involves ongoing research and development to meet the unique requirements of military applications.

Request Free Sample
The OEM segment was valued at USD 1289.90 million in 2018 and showed a gradual increase during the forecast period.
Regional Analysis
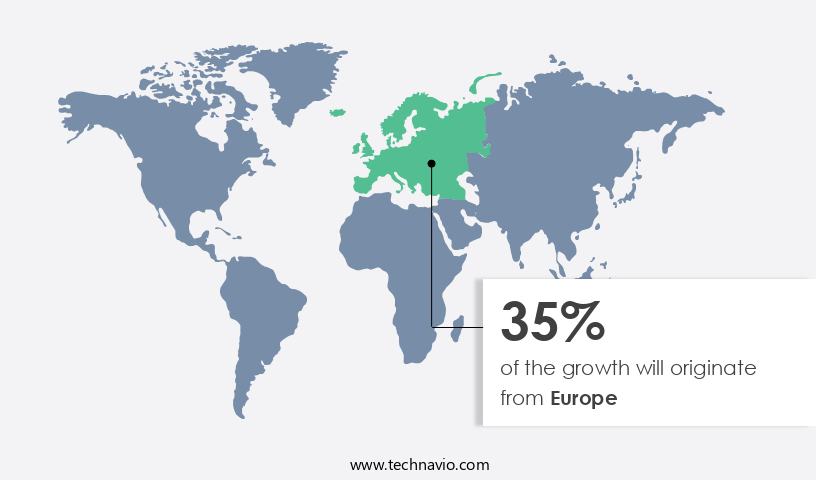
Europe is estimated to contribute 35% to the growth of the global market during the forecast period. Technavio's analysts have elaborately explained the regional trends and drivers that shape the market during the forecast period.

Request Free Sample
The market is witnessing significant growth due to the increasing demand for high-performance batteries in various defense applications. These batteries are essential for powering electronic warfare systems, weapon systems, and energy storage solutions that require high power density, long battery life, and robustness. Military specifications mandate shock resistance, vibration resistance, water resistance, and extreme temperature capabilities, making battery manufacturing a complex process. Nickel-cadmium batteries and lead-acid batteries have traditionally been used in military applications due to their reliability and durability. However, lithium-ion batteries are gaining popularity due to their higher energy density and power output. Battery certifications, such as MIL-STD-810 and MIL-STD-1275, ensure the batteries meet military standards for performance and safety.
Power management systems are crucial for optimizing battery usage and extending battery life. Battery management systems (BMS) monitor battery voltage, temperature, and current to prevent overcharging, overdischarging, and thermal runaway. Rechargeable batteries are increasingly being used to reduce the need for frequent battery replacements, and battery recycling is gaining importance for sustainable military operations. The market is witnessing trends such as the development of high-energy batteries for powering electric and hybrid air vehicles, long-life batteries for ground and naval applications, and emergency power solutions for critical military infrastructure. Battery testing and analysis are essential to ensure battery performance and reliability, and battery manufacturing processes are continuously evolving to improve battery efficiency and reduce costs.
The European market is expected to grow significantly due to increasing military investments in Russia and the UK, which are focusing on improving their military capabilities through advanced technologies. Counter-insurgency operations and military modernization efforts are also driving the demand for military batteries. The market is expected to continue growing as military applications expand and technological advancements lead to the development of more efficient and reliable battery solutions.
Market Dynamics
Our researchers analyzed the data with 2023 as the base year, along with the key drivers, trends, and challenges. A holistic analysis of drivers will help companies refine their marketing strategies to gain a competitive advantage.
What are the key market drivers leading to the rise in the adoption of Military Battery Industry?
- Military spending increases is the primary catalyst for market growth.
- Military expenditures continue to rise globally, driven by geopolitical tensions and security concerns. In 2023, the five largest military spenders were the US, China, India, Russia, and Saudi Arabia, collectively accounting for approximately 60% of the global military expenditure. The global military expenditure in 2023 represented around 2.3% of the world's Gross Domestic Product (GDP). China and Russia held the second and third largest military budgets, with China investing over USD296 billion and Russia increasing its spending by 24% to approximately USD109 billion. The US maintained the highest military expenditure, allocating around USD196 billion. In the context of military applications, batteries play a crucial role, particularly in powering various military equipment and providing power backup.
- The demand for military batteries is driven by their unique features, such as high energy density, extreme temperature resistance, vibration resistance, and water resistance. These batteries are available in various shapes and sizes, including cylindrical, prismatic, and pouch cells. Battery management systems are essential for ensuring the optimal performance and longevity of military batteries. Both primary and secondary batteries, including non-rechargeable and rechargeable types, are used in military applications. The battery anode and cathode materials are critical factors influencing battery power and capacity. Battery connectors play a vital role in ensuring reliable and efficient power transfer between battery cells and military equipment.
- Battery recycling is also a growing concern to minimize environmental impact and recover valuable resources. The market is expected to grow due to these factors, offering significant opportunities for manufacturers and suppliers.
What are the market trends shaping the Military Battery Industry?
- The increasing use of military drones represents a significant market trend. This development is driven by the advantages they offer in terms of surveillance, reconnaissance, and precision strikes.
- The market is witnessing significant growth due to the increasing usage of unmanned aerial vehicles (UAVs) and ground vehicles in defense applications. Sealed batteries, such as lithium-ion batteries, are gaining popularity due to their long-life span and fast charging time. In military operations, quick charging is crucial to ensure continuous operation. Military drones, used extensively for surveillance and intelligence, reconnaissance activities, and battle damage management, are major consumers of these batteries. The demand for military drones is escalating due to the growing focus on information warfare and real-time imaging capabilities.
- Lithium-ion batteries are preferred for military drones due to their high energy density, low weight, and excellent battery performance. Battery safety, resistance, separator, cathode, and electrolyte are essential factors influencing battery performance evaluation and analysis. Naval applications also require long-lasting batteries for submarines and ships, further boosting the market growth.
What challenges does the Military Battery Industry face during its growth?
- Adhering to military standards is a significant challenge that necessitates rigorous compliance, impacting the growth trajectory of the industry.
- Batteries play a crucial role in military applications, providing emergency power and power conditioning for various equipment. However, the reliability and durability of batteries are essential considerations in this sector due to the potential risks of explosion and thermal runaway. These issues can be attributed to the electrochemical constituents used and the battery technology. To ensure the safety and efficiency of batteries for military use, a rigorous approval process is mandatory. The first step involves submitting a Safety Data Package (SDP), which outlines the battery specifications and intended use, for review and approval by the governing body.
- Based on the requirements, the battery is further developed. Battery efficiency, battery impedance, battery size, battery discharge rate, and battery voltage are critical factors that influence battery selection for military applications. Lead-acid batteries and high-power batteries are commonly used due to their reliability and ability to deliver high current. In addition, dust-resistant batteries are preferred for their durability in harsh environments. Battery testing is an essential part of the approval process to ensure compliance with military standards. Primary batteries, which are non-rechargeable, and secondary batteries, which are rechargeable, undergo various tests to evaluate their performance under extreme conditions.
- In conclusion, the battery approval process in the military sector is a meticulous one, ensuring the safety, efficiency, and reliability of batteries used in military applications. The process involves several steps, including the submission of a Safety Data Package, development based on requirements, and rigorous testing to meet military standards.
Exclusive Customer Landscape
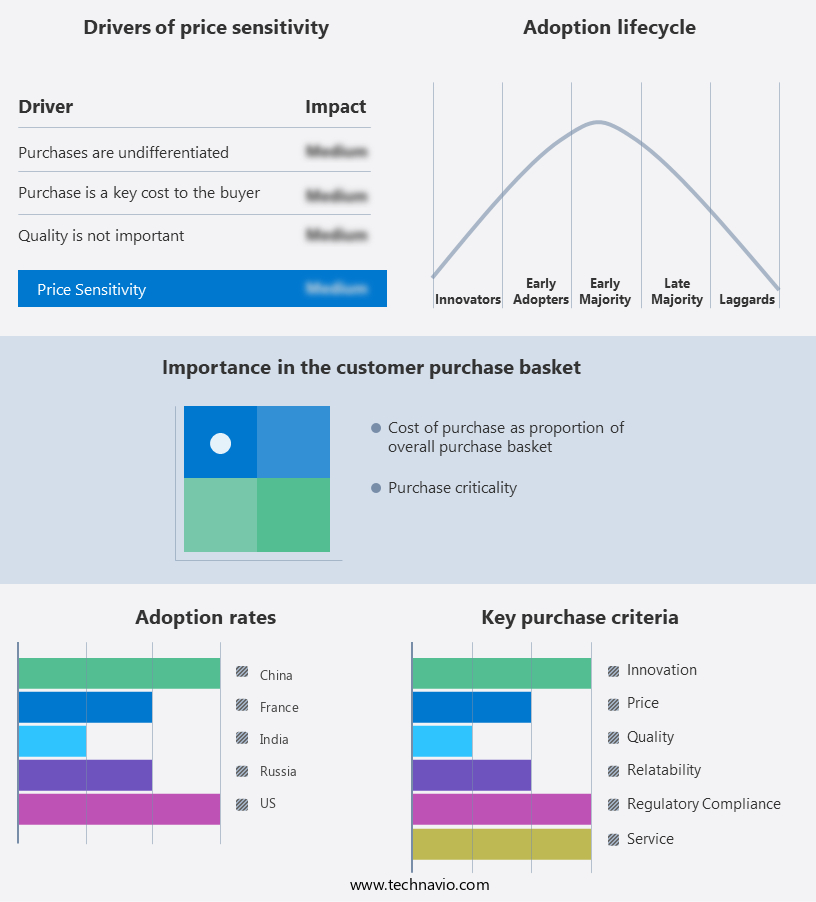
The military battery market forecasting report includes the adoption lifecycle of the market, covering from the innovator's stage to the laggard's stage. It focuses on adoption rates in different regions based on penetration. Furthermore, the military battery market report also includes key purchase criteria and drivers of price sensitivity to help companies evaluate and develop their market growth analysis strategies.

Customer Landscape
Key Companies & Market Insights
Companies are implementing various strategies, such as strategic alliances, military battery market forecast, partnerships, mergers and acquisitions, geographical expansion, and product/service launches, to enhance their presence in the industry.
Arotech Corporation - The company specializes in the development and distribution of innovative sports products, catering to a global market.
The industry research and growth report includes detailed analyses of the competitive landscape of the market and information about key companies, including:
- Arotech Corporation
- Bren-Tronics Inc.
- Cochlear Limited
- Denchi Group Ltd.
- EaglePicher Technologies
- Enersys
- Exide Technologies
- General Dynamics
- GS Yuasa Corporation
- HBL Power Systems Ltd.
- Kokam Co., Ltd.
- Lincad Ltd.
- Mathews Associates Inc.
- Navitas Systems
- Raytheon Technologies
- Relion Battery
- Saft Groupe S.A.
- Thales Group
- Ultralife Corporation
- Valence Technology Inc.
Qualitative and quantitative analysis of companies has been conducted to help clients understand the wider business environment as well as the strengths and weaknesses of key industry players. Data is qualitatively analyzed to categorize companies as pure play, category-focused, industry-focused, and diversified; it is quantitatively analyzed to categorize companies as dominant, leading, strong, tentative, and weak.
Recent Development and News in Military Battery Market
- In February 2023, Lockheed Martin Corporation, a leading defense technology company, announced the successful testing of a lithium-ion battery system for the Joint Light Tactical Vehicle (JLTV), surpassing the Department of Defense's energy storage requirements by 20% (Lockheed Martin Press Release, 2023). This technological advancement signifies a significant leap forward in military battery technology, ensuring extended operational capabilities for military vehicles.
- In August 2024, Northrop Grumman Corporation and QuantumScape Corporation, a solid-state battery technology company, announced a strategic partnership to develop and integrate QuantumScape's solid-state batteries into Northrop Grumman's defense and aerospace platforms. This collaboration aims to provide lighter, safer, and more efficient energy storage solutions for military applications (Northrop Grumman Press Release, 2024).
- In January 2025, the U.S. Army awarded a contract to Samsung SDI Co. Ltd. For the production and supply of lithium-ion batteries for the Stryker fleet modernization program. This contract is valued at approximately USD 250 million, reflecting the growing demand for advanced energy storage systems in military applications (U.S. Department of Defense Press Release, 2025).
- In April 2025, the European Union unveiled the European Battery Alliance 2.0, a â¬3 billion initiative aimed at establishing a competitive European battery value chain. This initiative includes the development of military battery applications, positioning Europe as a key player in The market (European Commission Press Release, 2025).
Research Analyst Overview
- The market encompasses various aspects of battery technology, from innovation and design to procurement and maintenance. Battery engineering and system design play crucial roles in ensuring optimal performance, particularly in extreme conditions such as cold weather and high altitude. Battery modeling and simulation are essential tools for predicting behavior and identifying potential issues. Battery safety regulations and sustainability are paramount concerns, driving the need for labeling requirements and life cycle analysis. Battery chemistry and development continue to advance, with a focus on improving cost, environmental impact, and performance. Battery optimization and monitoring, including telemetry and diagnostics, are vital for maximizing efficiency and extending battery life.
- The battery supply chain and logistics are undergoing transformation, with a growing emphasis on integration and just-in-time delivery. Battery innovation and technology are evolving rapidly, addressing challenges in battery materials, battery safety, and battery availability. The military sector demands the highest standards of reliability and durability, making battery engineering and safety regulations a top priority. Battery labeling and sustainability are increasingly important considerations for military applications, with a focus on reducing environmental impact and ensuring compliance with regulations. The market is a dynamic and complex landscape, requiring ongoing research and development to meet the unique demands of defense applications.
Dive into Technavio's robust research methodology, blending expert interviews, extensive data synthesis, and validated models for unparalleled Military Battery Market insights. See full methodology.
Market Scope
|
Report Coverage
|
Details
|
Page number
|
166
|
Base year
|
2023
|
Historic period
|
2018-2022 |
Forecast period
|
2024-2028
|
Growth momentum & CAGR
|
Accelerate at a CAGR of 3.69%
|
Market growth 2024-2028
|
USD 370.1 million
|
Market structure
|
Fragmented
|
YoY growth 2023-2024(%)
|
3.56
|
Key countries
|
US, China, Russia, India, Japan, Canada, South Korea, Brazil, France, and Germany
|
Competitive landscape
|
Leading Companies, Market Positioning of Companies, Competitive Strategies, and Industry Risks
|
Request Free Sample
What are the Key Data Covered in this Military Battery Market Research and Growth Report?
- CAGR of the Military Battery industry during the forecast period
- Detailed information on factors that will drive the growth and forecasting between 2024 and 2028
- Precise estimation of the size of the market and its contribution of the industry in focus to the parent market
- Accurate predictions about upcoming growth and trends and changes in consumer behaviour
- Growth of the market across Europe, North America, APAC, South America, and Middle East and Africa
- Thorough analysis of the market's competitive landscape and detailed information about companies
- Comprehensive analysis of factors that will challenge the military battery market growth of industry companies
We can help! Our analysts can customize this military battery market research report to meet your requirements.
Get in touch
1 Executive Summary
- 1.1 Market overview
- Executive Summary - Chart on Market Overview
- Executive Summary - Data Table on Market Overview
- Executive Summary - Chart on Global Market Characteristics
- Executive Summary - Chart on Market by Geography
- Executive Summary - Chart on Market Segmentation by End-user
- Executive Summary - Chart on Market Segmentation by Technology
- Executive Summary - Chart on Incremental Growth
- Executive Summary - Data Table on Incremental Growth
- Executive Summary - Chart on Company Market Positioning
2 Market Landscape
- 2.1 Market ecosystem
- Parent Market
- Data Table on - Parent Market
- 2.2 Market characteristics
- Market characteristics analysis
3 Market Sizing
- 3.1 Market definition
- Offerings of companies included in the market definition
- 3.2 Market segment analysis
- 3.4 Market outlook: Forecast for 2023-2028
- Chart on Global - Market size and forecast 2023-2028 ($ million)
- Data Table on Global - Market size and forecast 2023-2028 ($ million)
- Chart on Global Market: Year-over-year growth 2023-2028 (%)
- Data Table on Global Market: Year-over-year growth 2023-2028 (%)
4 Historic Market Size
- 4.1 Global Military Battery Market 2018 - 2022
- Historic Market Size - Data Table on Global Military Battery Market 2018 - 2022 ($ million)
- 4.2 End-user segment analysis 2018 - 2022
- Historic Market Size - End-user Segment 2018 - 2022 ($ million)
- 4.3 Technology segment analysis 2018 - 2022
- Historic Market Size - Technology Segment 2018 - 2022 ($ million)
- 4.4 Geography segment analysis 2018 - 2022
- Historic Market Size - Geography Segment 2018 - 2022 ($ million)
- 4.5 Country segment analysis 2018 - 2022
- Historic Market Size - Country Segment 2018 - 2022 ($ million)
5 Five Forces Analysis
- 5.1 Five forces summary
- Five forces analysis - Comparison between 2023 and 2028
- 5.2 Bargaining power of buyers
- Bargaining power of buyers - Impact of key factors 2023 and 2028
- 5.3 Bargaining power of suppliers
- Bargaining power of suppliers - Impact of key factors in 2023 and 2028
- 5.4 Threat of new entrants
- Threat of new entrants - Impact of key factors in 2023 and 2028
- 5.5 Threat of substitutes
- Threat of substitutes - Impact of key factors in 2023 and 2028
- 5.6 Threat of rivalry
- Threat of rivalry - Impact of key factors in 2023 and 2028
- 5.7 Market condition
- Chart on Market condition - Five forces 2023 and 2028
6 Market Segmentation by End-user
- 6.1 Market segments
- Chart on End-user - Market share (2023-2028) (%)
- Data Table on End-user - Market share (2023-2028) (%)
- 6.2 Comparison by End-user
- Chart on Comparison by End-user
- Data Table on Comparison by End-user
- 6.3 OEM - Market size and forecast (2023-2028)
- Chart on OEM - Market size and forecast (2023-2028) ($ million)
- Data Table on OEM - Market size and forecast (2023-2028) ($ million)
- Chart on OEM - Year-over-year growth (2023-2028) (%)
- Data Table on OEM - Year-over-year growth (2023-2028) (%)
- 6.4 Aftermarket - Market size and forecast (2023-2028)
- Chart on Aftermarket - Market size and forecast (2023-2028) ($ million)
- Data Table on Aftermarket - Market size and forecast (2023-2028) ($ million)
- Chart on Aftermarket - Year-over-year growth (2023-2028) (%)
- Data Table on Aftermarket - Year-over-year growth (2023-2028) (%)
- 6.5 Defense Forces - Market size and forecast (2023-2028)
- Chart on Defense Forces - Market size and forecast (2023-2028) ($ million)
- Data Table on Defense Forces - Market size and forecast (2023-2028) ($ million)
- Chart on Defense Forces - Year-over-year growth (2023-2028) (%)
- Data Table on Defense Forces - Year-over-year growth (2023-2028) (%)
- 6.6 System Integrators - Market size and forecast (2023-2028)
- Chart on System Integrators - Market size and forecast (2023-2028) ($ million)
- Data Table on System Integrators - Market size and forecast (2023-2028) ($ million)
- Chart on System Integrators - Year-over-year growth (2023-2028) (%)
- Data Table on System Integrators - Year-over-year growth (2023-2028) (%)
- 6.7 Market opportunity by End-user
- Market opportunity by End-user ($ million)
- Data Table on Market opportunity by End-user ($ million)
7 Market Segmentation by Technology
- 7.1 Market segments
- Chart on Technology - Market share (2023-2028) (%)
- Data Table on Technology - Market share (2023-2028) (%)
- 7.2 Comparison by Technology
- Chart on Comparison by Technology
- Data Table on Comparison by Technology
- 7.3 Non-rechargeable batteries - Market size and forecast (2023-2028)
- Chart on Non-rechargeable batteries - Market size and forecast (2023-2028) ($ million)
- Data Table on Non-rechargeable batteries - Market size and forecast (2023-2028) ($ million)
- Chart on Non-rechargeable batteries - Year-over-year growth (2023-2028) (%)
- Data Table on Non-rechargeable batteries - Year-over-year growth (2023-2028) (%)
- 7.4 Rechargeable batteries - Market size and forecast (2023-2028)
- Chart on Rechargeable batteries - Market size and forecast (2023-2028) ($ million)
- Data Table on Rechargeable batteries - Market size and forecast (2023-2028) ($ million)
- Chart on Rechargeable batteries - Year-over-year growth (2023-2028) (%)
- Data Table on Rechargeable batteries - Year-over-year growth (2023-2028) (%)
- 7.5 Emerging Technologies - Market size and forecast (2023-2028)
- Chart on Emerging Technologies - Market size and forecast (2023-2028) ($ million)
- Data Table on Emerging Technologies - Market size and forecast (2023-2028) ($ million)
- Chart on Emerging Technologies - Year-over-year growth (2023-2028) (%)
- Data Table on Emerging Technologies - Year-over-year growth (2023-2028) (%)
- 7.6 Market opportunity by Technology
- Market opportunity by Technology ($ million)
- Data Table on Market opportunity by Technology ($ million)
8 Market Segmentation by Platform
- 8.1 Market segments
- Chart on Platform - Market share (2023-2028) (%)
- Data Table on Platform - Market share (2023-2028) (%)
- 8.2 Comparison by Platform
- Chart on Comparison by Platform
- Data Table on Comparison by Platform
- 8.3 Ground - Market size and forecast (2023-2028)
- Chart on Ground - Market size and forecast (2023-2028) ($ million)
- Data Table on Ground - Market size and forecast (2023-2028) ($ million)
- Chart on Ground - Year-over-year growth (2023-2028) (%)
- Data Table on Ground - Year-over-year growth (2023-2028) (%)
- 8.4 Airborne - Market size and forecast (2023-2028)
- Chart on Airborne - Market size and forecast (2023-2028) ($ million)
- Data Table on Airborne - Market size and forecast (2023-2028) ($ million)
- Chart on Airborne - Year-over-year growth (2023-2028) (%)
- Data Table on Airborne - Year-over-year growth (2023-2028) (%)
- 8.5 Marine - Market size and forecast (2023-2028)
- Chart on Marine - Market size and forecast (2023-2028) ($ million)
- Data Table on Marine - Market size and forecast (2023-2028) ($ million)
- Chart on Marine - Year-over-year growth (2023-2028) (%)
- Data Table on Marine - Year-over-year growth (2023-2028) (%)
- 8.6 Space - Market size and forecast (2023-2028)
- Chart on Space - Market size and forecast (2023-2028) ($ million)
- Data Table on Space - Market size and forecast (2023-2028) ($ million)
- Chart on Space - Year-over-year growth (2023-2028) (%)
- Data Table on Space - Year-over-year growth (2023-2028) (%)
- 8.7 Munition - Market size and forecast (2023-2028)
- Chart on Munition - Market size and forecast (2023-2028) ($ million)
- Data Table on Munition - Market size and forecast (2023-2028) ($ million)
- Chart on Munition - Year-over-year growth (2023-2028) (%)
- Data Table on Munition - Year-over-year growth (2023-2028) (%)
- 8.8 Wearable/Portable Soldier Systems - Market size and forecast (2023-2028)
- Chart on Wearable/Portable Soldier Systems - Market size and forecast (2023-2028) ($ million)
- Data Table on Wearable/Portable Soldier Systems - Market size and forecast (2023-2028) ($ million)
- Chart on Wearable/Portable Soldier Systems - Year-over-year growth (2023-2028) (%)
- Data Table on Wearable/Portable Soldier Systems - Year-over-year growth (2023-2028) (%)
- 8.9 Market opportunity by Platform
- Market opportunity by Platform ($ million)
- Data Table on Market opportunity by Platform ($ million)
9 Market Segmentation by Composition
- 9.1 Market segments
- Chart on Composition - Market share (2023-2028) (%)
- Data Table on Composition - Market share (2023-2028) (%)
- 9.2 Comparison by Composition
- Chart on Comparison by Composition
- Data Table on Comparison by Composition
- 9.3 Lead acid - Market size and forecast (2023-2028)
- Chart on Lead acid - Market size and forecast (2023-2028) ($ million)
- Data Table on Lead acid - Market size and forecast (2023-2028) ($ million)
- Chart on Lead acid - Year-over-year growth (2023-2028) (%)
- Data Table on Lead acid - Year-over-year growth (2023-2028) (%)
- 9.4 Nickel-based - Market size and forecast (2023-2028)
- Chart on Nickel-based - Market size and forecast (2023-2028) ($ million)
- Data Table on Nickel-based - Market size and forecast (2023-2028) ($ million)
- Chart on Nickel-based - Year-over-year growth (2023-2028) (%)
- Data Table on Nickel-based - Year-over-year growth (2023-2028) (%)
- 9.5 Thermal - Market size and forecast (2023-2028)
- Chart on Thermal - Market size and forecast (2023-2028) ($ million)
- Data Table on Thermal - Market size and forecast (2023-2028) ($ million)
- Chart on Thermal - Year-over-year growth (2023-2028) (%)
- Data Table on Thermal - Year-over-year growth (2023-2028) (%)
- 9.6 Silver-based - Market size and forecast (2023-2028)
- Chart on Silver-based - Market size and forecast (2023-2028) ($ million)
- Data Table on Silver-based - Market size and forecast (2023-2028) ($ million)
- Chart on Silver-based - Year-over-year growth (2023-2028) (%)
- Data Table on Silver-based - Year-over-year growth (2023-2028) (%)
- 9.7 Alkaline/Carbon-zinc - Market size and forecast (2023-2028)
- Chart on Alkaline/Carbon-zinc - Market size and forecast (2023-2028) ($ million)
- Data Table on Alkaline/Carbon-zinc - Market size and forecast (2023-2028) ($ million)
- Chart on Alkaline/Carbon-zinc - Year-over-year growth (2023-2028) (%)
- Data Table on Alkaline/Carbon-zinc - Year-over-year growth (2023-2028) (%)
- 9.8 Lithium Variants - Market size and forecast (2023-2028)
- Chart on Lithium Variants - Market size and forecast (2023-2028) ($ million)
- Data Table on Lithium Variants - Market size and forecast (2023-2028) ($ million)
- Chart on Lithium Variants - Year-over-year growth (2023-2028) (%)
- Data Table on Lithium Variants - Year-over-year growth (2023-2028) (%)
- 9.9 Market opportunity by Composition
- Market opportunity by Composition ($ million)
- Data Table on Market opportunity by Composition ($ million)
10 Customer Landscape
- 10.1 Customer landscape overview
- Analysis of price sensitivity, lifecycle, customer purchase basket, adoption rates, and purchase criteria
11 Geographic Landscape
- 11.1 Geographic segmentation
- Chart on Market share by geography 2023-2028 (%)
- Data Table on Market share by geography 2023-2028 (%)
- 11.2 Geographic comparison
- Chart on Geographic comparison
- Data Table on Geographic comparison
- 11.3 Europe - Market size and forecast 2023-2028
- Chart on Europe - Market size and forecast 2023-2028 ($ million)
- Data Table on Europe - Market size and forecast 2023-2028 ($ million)
- Chart on Europe - Year-over-year growth 2023-2028 (%)
- Data Table on Europe - Year-over-year growth 2023-2028 (%)
- 11.4 North America - Market size and forecast 2023-2028
- Chart on North America - Market size and forecast 2023-2028 ($ million)
- Data Table on North America - Market size and forecast 2023-2028 ($ million)
- Chart on North America - Year-over-year growth 2023-2028 (%)
- Data Table on North America - Year-over-year growth 2023-2028 (%)
- 11.5 APAC - Market size and forecast 2023-2028
- Chart on APAC - Market size and forecast 2023-2028 ($ million)
- Data Table on APAC - Market size and forecast 2023-2028 ($ million)
- Chart on APAC - Year-over-year growth 2023-2028 (%)
- Data Table on APAC - Year-over-year growth 2023-2028 (%)
- 11.6 South America - Market size and forecast 2023-2028
- Chart on South America - Market size and forecast 2023-2028 ($ million)
- Data Table on South America - Market size and forecast 2023-2028 ($ million)
- Chart on South America - Year-over-year growth 2023-2028 (%)
- Data Table on South America - Year-over-year growth 2023-2028 (%)
- 11.7 Middle East and Africa - Market size and forecast 2023-2028
- Chart on Middle East and Africa - Market size and forecast 2023-2028 ($ million)
- Data Table on Middle East and Africa - Market size and forecast 2023-2028 ($ million)
- Chart on Middle East and Africa - Year-over-year growth 2023-2028 (%)
- Data Table on Middle East and Africa - Year-over-year growth 2023-2028 (%)
- 11.8 US - Market size and forecast 2023-2028
- Chart on US - Market size and forecast 2023-2028 ($ million)
- Data Table on US - Market size and forecast 2023-2028 ($ million)
- Chart on US - Year-over-year growth 2023-2028 (%)
- Data Table on US - Year-over-year growth 2023-2028 (%)
- 11.9 China - Market size and forecast 2023-2028
- Chart on China - Market size and forecast 2023-2028 ($ million)
- Data Table on China - Market size and forecast 2023-2028 ($ million)
- Chart on China - Year-over-year growth 2023-2028 (%)
- Data Table on China - Year-over-year growth 2023-2028 (%)
- 11.10 Russia - Market size and forecast 2023-2028
- Chart on Russia - Market size and forecast 2023-2028 ($ million)
- Data Table on Russia - Market size and forecast 2023-2028 ($ million)
- Chart on Russia - Year-over-year growth 2023-2028 (%)
- Data Table on Russia - Year-over-year growth 2023-2028 (%)
- 11.11 France - Market size and forecast 2023-2028
- Chart on France - Market size and forecast 2023-2028 ($ million)
- Data Table on France - Market size and forecast 2023-2028 ($ million)
- Chart on France - Year-over-year growth 2023-2028 (%)
- Data Table on France - Year-over-year growth 2023-2028 (%)
- 11.12 India - Market size and forecast 2023-2028
- Chart on India - Market size and forecast 2023-2028 ($ million)
- Data Table on India - Market size and forecast 2023-2028 ($ million)
- Chart on India - Year-over-year growth 2023-2028 (%)
- Data Table on India - Year-over-year growth 2023-2028 (%)
- 11.13 Market opportunity by geography
- Market opportunity by geography ($ million)
- Data Tables on Market opportunity by geography ($ million)
- 11.14 Japan - Market size and forecast (2023-2028)
- Chart on Japan - Market size and forecast (2023-2028) ($ million)
- Data Table on Japan - Market size and forecast (2023-2028) ($ million)
- Chart on Japan - Year-over-year growth (2023-2028) (%)
- Data Table on Japan - Year-over-year growth (2023-2028) (%)
- 11.15 Canada - Market size and forecast (2023-2028)
- Chart on Canada - Market size and forecast (2023-2028) ($ million)
- Data Table on Canada - Market size and forecast (2023-2028) ($ million)
- Chart on Canada - Year-over-year growth (2023-2028) (%)
- Data Table on Canada - Year-over-year growth (2023-2028) (%)
- 11.16 South Korea - Market size and forecast (2023-2028)
- Chart on South Korea - Market size and forecast (2023-2028) ($ million)
- Data Table on South Korea - Market size and forecast (2023-2028) ($ million)
- Chart on South Korea - Year-over-year growth (2023-2028) (%)
- Data Table on South Korea - Year-over-year growth (2023-2028) (%)
- 11.17 Brazil - Market size and forecast (2023-2028)
- Chart on Brazil - Market size and forecast (2023-2028) ($ million)
- Data Table on Brazil - Market size and forecast (2023-2028) ($ million)
- Chart on Brazil - Year-over-year growth (2023-2028) (%)
- Data Table on Brazil - Year-over-year growth (2023-2028) (%)
- 11.18 germany - Market size and forecast (2023-2028)
- Chart on germany - Market size and forecast (2023-2028) ($ million)
- Data Table on germany - Market size and forecast (2023-2028) ($ million)
- Chart on germany - Year-over-year growth (2023-2028) (%)
- Data Table on germany - Year-over-year growth (2023-2028) (%)
- 11.19 Rest of World (ROW) - Market size and forecast (2023-2028)
- Chart on Rest of World (ROW) - Market size and forecast (2023-2028) ($ million)
- Data Table on Rest of World (ROW) - Market size and forecast (2023-2028) ($ million)
- Chart on Rest of World (ROW) - Year-over-year growth (2023-2028) (%)
- Data Table on Rest of World (ROW) - Year-over-year growth (2023-2028) (%)
12 Drivers, Challenges, and Opportunity/Restraints
- 12.3 Impact of drivers and challenges
- Impact of drivers and challenges in 2023 and 2028
- 12.4 Market opportunities/restraints
13 Competitive Landscape
- 13.2 Competitive Landscape
- Overview on criticality of inputs and factors of differentiation
- 13.3 Landscape disruption
- Overview on factors of disruption
- 13.4 Industry risks
- Impact of key risks on business
14 Competitive Analysis
- 14.2 Market positioning of companies
- Matrix on companies position and classification
- 14.3 Arotech Corporation
- Arotech Corporation - Overview
- Arotech Corporation - Product / Service
- Arotech Corporation - Key offerings
- 14.4 Bren-Tronics Inc.
- Bren-Tronics Inc. - Overview
- Bren-Tronics Inc. - Product / Service
- Bren-Tronics Inc. - Key offerings
- 14.5 Cochlear Limited
- Cochlear Limited - Overview
- Cochlear Limited - Product / Service
- Cochlear Limited - Key offerings
- 14.6 Denchi Group Ltd.
- Denchi Group Ltd. - Overview
- Denchi Group Ltd. - Product / Service
- Denchi Group Ltd. - Key offerings
- 14.7 EaglePicher Technologies
- EaglePicher Technologies - Overview
- EaglePicher Technologies - Product / Service
- EaglePicher Technologies - Key offerings
- 14.8 Enersys
- Enersys - Overview
- Enersys - Product / Service
- Enersys - Key offerings
- 14.9 Exide Technologies
- Exide Technologies - Overview
- Exide Technologies - Product / Service
- Exide Technologies - Key offerings
- 14.10 General Dynamics
- General Dynamics - Overview
- General Dynamics - Product / Service
- General Dynamics - Key offerings
- 14.11 GS Yuasa Corporation
- GS Yuasa Corporation - Overview
- GS Yuasa Corporation - Product / Service
- GS Yuasa Corporation - Key offerings
- 14.12 HBL Power Systems Ltd.
- HBL Power Systems Ltd. - Overview
- HBL Power Systems Ltd. - Product / Service
- HBL Power Systems Ltd. - Key offerings
- 14.13 Kokam Co., Ltd.
- Kokam Co., Ltd. - Overview
- Kokam Co., Ltd. - Product / Service
- Kokam Co., Ltd. - Key offerings
- 14.14 Lincad Ltd.
- Lincad Ltd. - Overview
- Lincad Ltd. - Product / Service
- Lincad Ltd. - Key offerings
- 14.15 Mathews Associates Inc.
- Mathews Associates Inc. - Overview
- Mathews Associates Inc. - Product / Service
- Mathews Associates Inc. - Key offerings
- 14.16 Navitas Systems
- Navitas Systems - Overview
- Navitas Systems - Product / Service
- Navitas Systems - Key offerings
- 14.17 Raytheon Technologies
- Raytheon Technologies - Overview
- Raytheon Technologies - Product / Service
- Raytheon Technologies - Key offerings
- 14.18 Relion Battery
- Relion Battery - Overview
- Relion Battery - Product / Service
- Relion Battery - Key offerings
- 14.19 Saft Groupe S.A.
- Saft Groupe S.A. - Overview
- Saft Groupe S.A. - Product / Service
- Saft Groupe S.A. - Key offerings
- 14.20 Thales Group
- Thales Group - Overview
- Thales Group - Product / Service
- Thales Group - Key offerings
- 14.21 Ultralife Corporation
- Ultralife Corporation - Overview
- Ultralife Corporation - Product / Service
- Ultralife Corporation - Key offerings
- 14.22 Valence Technology Inc.
- Valence Technology Inc. - Overview
- Valence Technology Inc. - Product / Service
- Valence Technology Inc. - Key offerings
- 14.23 Arotech (USA)
- Arotech (USA) - Overview
- Arotech (USA) - Product / Service
- Arotech (USA) - Key offerings
- 14.24 BAE Systems Plc (UK)
- BAE Systems Plc (UK) - Overview
- BAE Systems Plc (UK) - Product / Service
- BAE Systems Plc (UK) - Key offerings
- 14.25 Bren-Tronics Inc. (USA)
- Bren-Tronics Inc. (USA) - Overview
- Bren-Tronics Inc. (USA) - Product / Service
- Bren-Tronics Inc. (USA) - Key offerings
- 14.26 BST Systems Inc. (USA)
- BST Systems Inc. (USA) - Overview
- BST Systems Inc. (USA) - Product / Service
- BST Systems Inc. (USA) - Key offerings
- 14.27 BYD Co. Ltd. (China)
- BYD Co. Ltd. (China) - Overview
- BYD Co. Ltd. (China) - Product / Service
- BYD Co. Ltd. (China) - Key offerings
- 14.28 Cell-Con Inc. (USA)
- Cell-Con Inc. (USA) - Overview
- Cell-Con Inc. (USA) - Product / Service
- Cell-Con Inc. (USA) - Key offerings
- 14.29 Concorde Battery Corp. (USA)
- Concorde Battery Corp. (USA) - Overview
- Concorde Battery Corp. (USA) - Product / Service
- Concorde Battery Corp. (USA) - Key offerings
- 14.30 Denchi Group Ltd. (UK)
- Denchi Group Ltd. (UK) - Overview
- Denchi Group Ltd. (UK) - Product / Service
- Denchi Group Ltd. (UK) - Key offerings
- 14.31 EaglePicher Technologies LLC (USA)
- EaglePicher Technologies LLC (USA) - Overview
- EaglePicher Technologies LLC (USA) - Product / Service
- EaglePicher Technologies LLC (USA) - Key offerings
- 14.32 East Penn Manufacturing Co. Inc. (USA)
- East Penn Manufacturing Co. Inc. (USA) - Overview
- East Penn Manufacturing Co. Inc. (USA) - Product / Service
- East Penn Manufacturing Co. Inc. (USA) - Key offerings
- 14.33 EnerSys (USA)
- EnerSys (USA) - Overview
- EnerSys (USA) - Product / Service
- EnerSys (USA) - Key offerings
- 14.34 Exide Industries Ltd. (India)
- Exide Industries Ltd. (India) - Overview
- Exide Industries Ltd. (India) - Product / Service
- Exide Industries Ltd. (India) - Key offerings
- 14.35 General Dynamics Corp. (USA)
- General Dynamics Corp. (USA) - Overview
- General Dynamics Corp. (USA) - Product / Service
- General Dynamics Corp. (USA) - Key offerings
- 14.36 GS Yuasa International Ltd. (Japan)
- GS Yuasa International Ltd. (Japan) - Overview
- GS Yuasa International Ltd. (Japan) - Product / Service
- GS Yuasa International Ltd. (Japan) - Key offerings
- 14.37 Kokam Co. Ltd. (South Korea)
- Kokam Co. Ltd. (South Korea) - Overview
- Kokam Co. Ltd. (South Korea) - Product / Service
- Kokam Co. Ltd. (South Korea) - Key offerings
- 14.38 Lincad Ltd. (UK)
- Lincad Ltd. (UK) - Overview
- Lincad Ltd. (UK) - Product / Service
- Lincad Ltd. (UK) - Key offerings
- 14.39 Mathews Associates Inc. (USA)
- Mathews Associates Inc. (USA) - Overview
- Mathews Associates Inc. (USA) - Product / Service
- Mathews Associates Inc. (USA) - Key offerings
- 14.40 Teledyne Technologies Inc. (USA)
- Teledyne Technologies Inc. (USA) - Overview
- Teledyne Technologies Inc. (USA) - Product / Service
- Teledyne Technologies Inc. (USA) - Key offerings
- 14.41 TotalEnergies SE (France)
- TotalEnergies SE (France) - Overview
- TotalEnergies SE (France) - Product / Service
- TotalEnergies SE (France) - Key offerings
- 14.42 Ultralife Corp. (USA)
- Ultralife Corp. (USA) - Overview
- Ultralife Corp. (USA) - Product / Service
- Ultralife Corp. (USA) - Key offerings
15 Appendix
- 15.2 Inclusions and exclusions checklist
- Inclusions checklist
- Exclusions checklist
- 15.3 Currency conversion rates for US$
- Currency conversion rates for US$
- 15.4 Research methodology
- 15.7 Validation techniques employed for market sizing
- Validation techniques employed for market sizing
- 15.9 360 degree market analysis
- 360 degree market analysis
- 15.10 List of abbreviations