Office Stationery And Supplies B2B Market Size 2025-2029
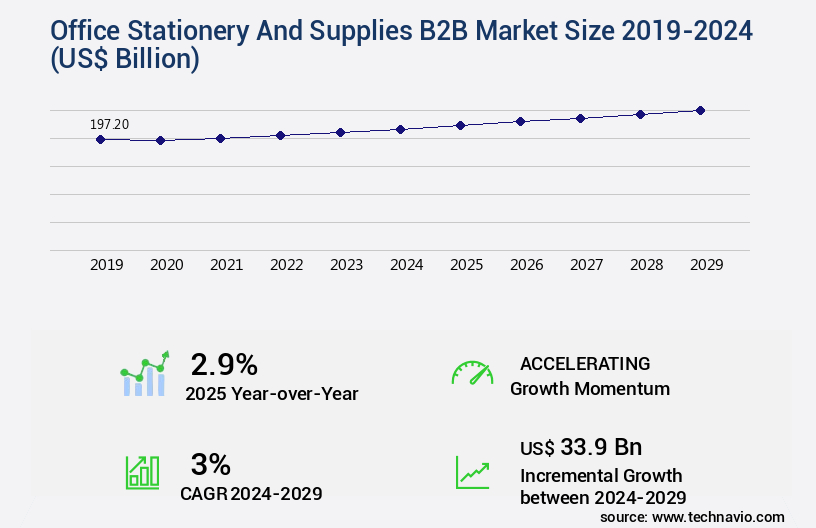
The office stationery and supplies b2b market size is forecast to increase by USD 33.9 billion, at a CAGR of 3% between 2024 and 2029.
- The market is experiencing significant growth, driven by the increasing expansion of businesses and their subsequent demand for stationery products. This trend is further fueled by the rising preference for eco-friendly and recyclable stationery items, reflecting a growing consciousness towards sustainability in business operations. Moreover, the digital transformation of offices is another key driver, with the increasing use of digital platforms leading to an uptick in demand for compatible stationery items, such as printer ink and toner cartridges. However, this market landscape is not without challenges. One significant obstacle is the intense competition, with numerous players vying for market share.
- Another challenge is the pressure to maintain low prices, as price sensitivity remains a critical factor for buyers in this market. Additionally, the rapid pace of technological advancements necessitates continuous innovation and adaptation to remain competitive. Companies seeking to capitalize on market opportunities and navigate challenges effectively must focus on offering high-quality, sustainable, and cost-effective products, while also investing in research and development to stay ahead of the competition.
What will be the Size of the Office Stationery And Supplies B2B Market during the forecast period?
Get Key Insights on Market Forecast (PDF)
Request Free Sample
- The market continues to evolve, driven by advancements in technology and shifting business priorities. Inventory management software and data analytics dashboards enable businesses to optimize their stock levels and streamline their ordering processes. Office furniture ergonomics and sustainable office supplies are increasingly important considerations, as companies prioritize employee well-being and reduce their environmental footprint. Supplier performance metrics and company relationship management are crucial for ensuring a reliable and efficient supply chain. Supply chain optimization and strategic sourcing initiatives help businesses minimize costs and improve overall performance. Paper recycling programs and waste reduction initiatives are also gaining traction, with many companies aiming for a 20% reduction in paper usage.
- Office equipment leasing and office space optimization are key areas of focus for businesses looking to reduce costs and improve efficiency. Contract negotiation strategies and demand forecasting models are essential tools for securing favorable deals and maintaining a steady supply of essential office supplies. Automated ordering systems and purchase order processing streamline the procurement process, while efficient delivery systems ensure timely receipt of goods. The office supplies industry is expected to grow at a steady pace, with a projected annual growth rate of 3% over the next five years. For instance, a leading retailer reported a 15% increase in sales of digital office solutions, such as electronic document management and stationery logistics management, in the past year.
- These trends underscore the continuous dynamism of the market and the importance of staying informed about the latest developments.
How is this Office Stationery And Supplies B2B Industry segmented?
The office stationery and supplies b2b industry research report provides comprehensive data (region-wise segment analysis), with forecasts and estimates in "USD billion" for the period 2025-2029, as well as historical data from 2019-2023 for the following segments.
- Distribution Channel
- Type
- Paper products
- Desk supplies
- Computer and printer supplies
- Stationery and mailing supplies
- Others
- End-user
- Commercial
- Education
- Others
- Geography
- North America
- Europe
- APAC
- China
- India
- Japan
- South Korea
- Rest of World (ROW)
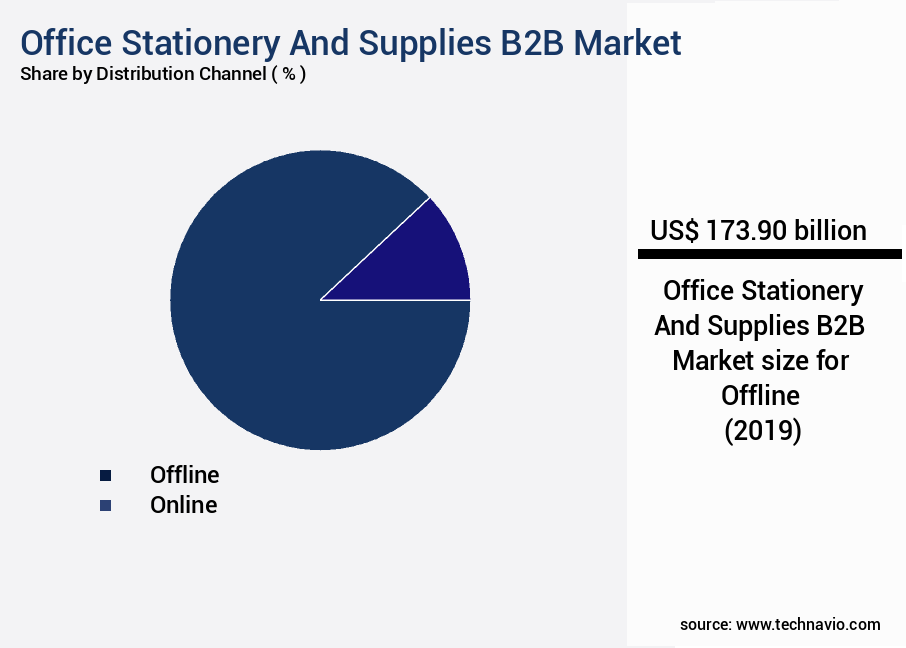
By Distribution Channel Insights
The offline segment is estimated to witness significant growth during the forecast period.
The market is witnessing significant trends and dynamics, with inventory management software and data analytics dashboards playing crucial roles in optimizing supply chain operations. Office furniture ergonomics and sustainable office supplies are gaining importance as businesses prioritize employee comfort and environmental responsibility. Supplier performance metrics and company relationship management are essential for ensuring consistent quality and reducing costs through strategic sourcing initiatives. The market is also witnessing a shift towards automation, with automated ordering systems, purchase order processing, and efficient delivery systems streamlining procurement processes. E-procurement platforms and electronic document management enable seamless transactions and enhance supply chain visibility.
Ergonomic office furniture and electronic document management further boost employee productivity. Moreover, the industry is focusing on waste reduction initiatives, such as bulk paper purchasing, printing supplies inventory management, and quality control procedures. Customized stationery printing and responsible sourcing practices are also gaining traction. According to recent studies, the global office stationery and supplies market is expected to grow by over 5% annually. For instance, a leading company in the sector reported a 10% increase in sales due to the implementation of an automated ordering system and supply chain optimization strategies.
Request Free Sample
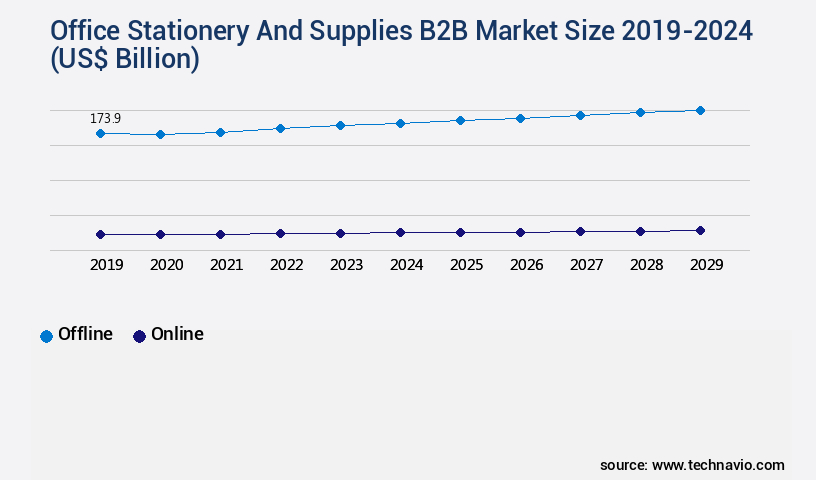
The Offline segment was valued at USD 173.90 billion in 2019 and showed a gradual increase during the forecast period.
Regional Analysis
North America is estimated to contribute 40% to the growth of the global market during the forecast period.Technavio's analysts have elaborately explained the regional trends and drivers that shape the market during the forecast period.

See How office stationery and supplies b2b market Demand is Rising in North America Request Free Sample
The North American the market is the largest globally, driven by the significant presence of corporate and home businesses in the region. With major players like the world's largest banks and IT companies headquartered here, the demand for office supplies is consistently high. In Silicon Valley, California, the global center for technology and innovation, over fifty leading corporations and thousands of startups reside. This business hub and startup ecosystem significantly contribute to the region's the market growth. Inventory management software and data analytics dashboards are essential tools for businesses to optimize their stock levels and demand forecasting.
Ergonomic office furniture and sustainable office supplies are increasingly popular due to their impact on employee productivity and the environment. Supplier performance metrics and company relationship management ensure consistent quality and cost savings. Product lifecycle management and e-procurement platforms streamline the purchasing process, while supply chain optimization and efficient delivery systems enhance operational efficiency. According to recent studies, the office stationery and supplies market in North America is expected to grow by over 5% annually. For instance, a leading company in the industry reported a 10% increase in sales through the implementation of strategic sourcing initiatives, automated ordering systems, and cost reduction strategies.
These trends reflect the market's dynamic and evolving patterns, as businesses continue to prioritize efficiency, sustainability, and cost savings.
Market Dynamics
Our researchers analyzed the data with 2024 as the base year, along with the key drivers, trends, and challenges. A holistic analysis of drivers will help companies refine their marketing strategies to gain a competitive advantage.
In the dynamic business world, optimizing B2B office stationery and supplies procurement processes is a critical aspect of efficient management for organizations. By implementing strategic approaches, companies can streamline their inventory management, ensuring they have the necessary supplies on hand while reducing excess stock and associated costs. Sustainable office supply practices are also gaining importance, with many businesses seeking eco-friendly alternatives to reduce their carbon footprint. Negotiating favorable stationery contracts is another key strategy for cost savings. Leveraging technology, such as automated ordering systems and inventory management software, can significantly improve office supply chain visibility and traceability. These tools enable real-time monitoring of stock levels, reducing the risk of stockouts and overstocking. Moreover, ergonomic furniture plays a crucial role in enhancing employee productivity and reducing workplace injuries. Measuring the ROI of office supply investments is essential to justify the costs and ensure long-term value. Integrating office supply management with ERP systems can facilitate seamless data flow and improve overall operational efficiency. Quality and reliability are non-negotiable when it comes to office supplies. Building strong relationships with companies and developing a comprehensive office supply purchasing policy can help ensure consistent quality and competitive pricing. Managing the lifecycle of office equipment and furniture, including disposal and replacement, is also crucial for long-term cost savings. Lastly, implementing a robust returns management process for office supplies is essential to minimize waste and maintain a lean inventory. By addressing these aspects, businesses can effectively manage their the market interactions, ensuring a cost-effective, efficient, and sustainable approach to their procurement needs.
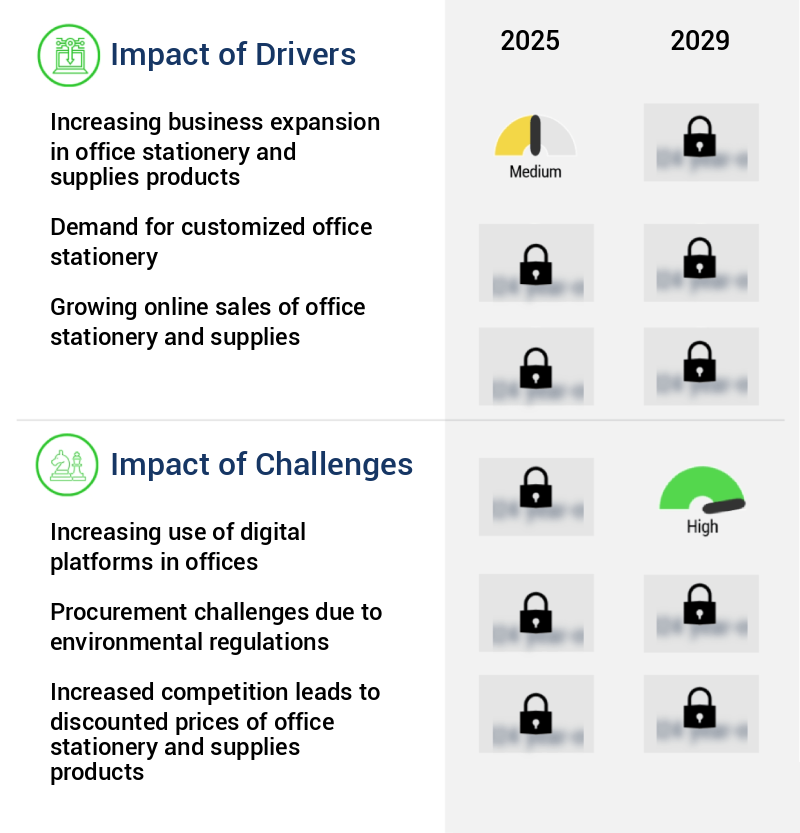
What are the key market drivers leading to the rise in the adoption of Office Stationery And Supplies B2B Industry?
- The significant growth in the office stationery and supplies sector drives the market expansion. As a proficient virtual assistant, I provide expert insights into this trend, underpinned by increasing demand for productivity tools and essential office supplies.
- The market is poised for growth due to the increasing business expansion across industries. Companies, including those in retail, food and beverage, banking and finance, and IT sectors, are expanding into new markets to attract a broader customer base and establish multiple revenue streams. This growth trend is reflected in the opening of new offices and outlets, which in turn fuels the demand for office stationery and supplies. According to recent market research, the office stationery and supplies market is expected to grow by over 5% annually in the coming years, as businesses continue to expand their operations globally.
- For instance, a leading retail company reported a 10% increase in sales following the opening of new stores in Asia and Europe.
What are the market trends shaping the Office Stationery And Supplies B2B Industry?
- The increasing demand for stationery products that are recyclable represents a notable market trend. A growing number of consumers are prioritizing eco-friendly options, leading to a surge in demand for recyclable stationery items.
- The market is experiencing a significant shift towards sustainability, with recyclable stationery products gaining increasing popularity. This trend is driven by growing corporate awareness regarding the environmental impact of non-recyclable materials, particularly plastics. As a result, the demand for recycled stationery items is on the rise. According to recent market research, the global office stationery and supplies market is projected to grow by over 7% in the next year.
- One notable outcome of this trend is a 15% increase in sales for companies specializing in recycled stationery products. This upward trajectory is expected to continue as more businesses prioritize eco-friendly practices in their operations.
What challenges does the Office Stationery And Supplies B2B Industry face during its growth?
- The escalating adoption of digital platforms in offices poses a significant challenge to the industry's growth trajectory.
- The market faces significant challenges due to the digitalization trend in work environments. Traditional office supplies, such as paper and fax materials, have experienced decreased demand as a result of advancements in technology. Communication and document storage have shifted to digital devices like computers, laptops, and smart gadgets. For instance, the adoption of cloud services has diminished the need for physical files and folders. This shift has negatively impacted the market, with industry experts predicting that the sector will grow at a rate of 3.5% annually over the next five years.
- Despite these challenges, there remains a demand for office stationery items such as pens, notepads, and binders, as they continue to be essential for taking notes and jotting down ideas during meetings and brainstorming sessions.
Exclusive Customer Landscape
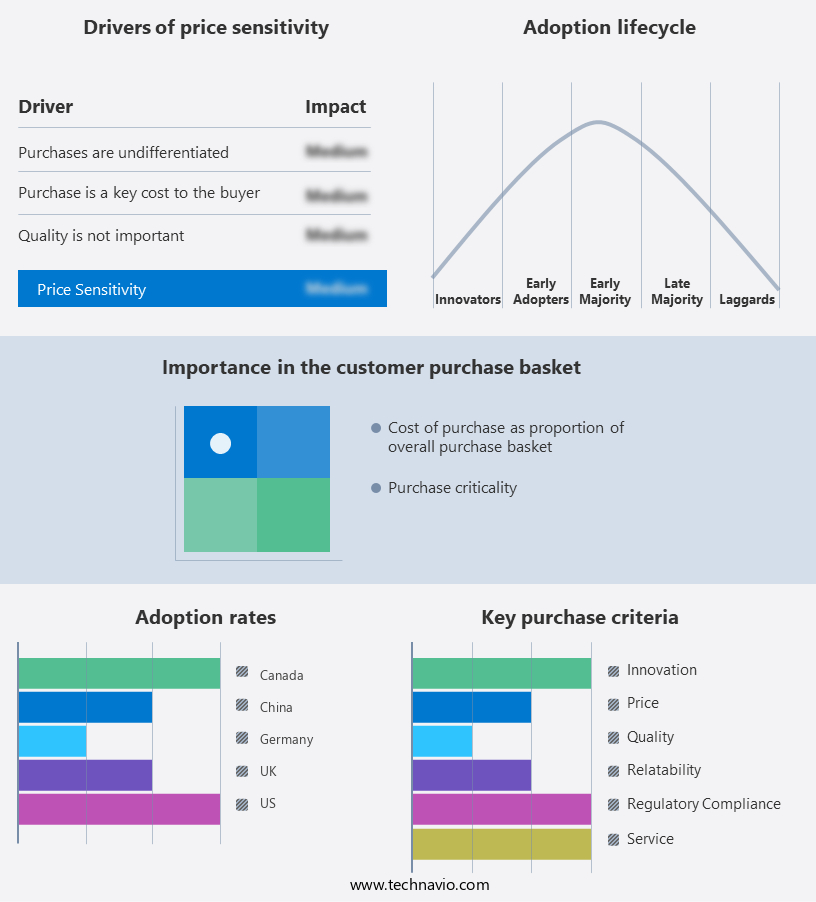
The office stationery and supplies b2b market forecasting report includes the adoption lifecycle of the market, covering from the innovator's stage to the laggard's stage. It focuses on adoption rates in different regions based on penetration. Furthermore, the office stationery and supplies b2b market report also includes key purchase criteria and drivers of price sensitivity to help companies evaluate and develop their market growth analysis strategies.

Customer Landscape
Key Companies & Market Insights
Companies are implementing various strategies, such as strategic alliances, office stationery and supplies b2b market forecast, partnerships, mergers and acquisitions, geographical expansion, and product/service launches, to enhance their presence in the industry.
Staples Inc. - This company specializes in providing a wide range of office stationery and supplies. Their product offerings include erasers, easel pads, flags, tabs, markers, notes, office tools, packing and shipping supplies, and accessories. These essential items cater to various professional needs, ensuring productivity and organization in any work environment.
The industry research and growth report includes detailed analyses of the competitive landscape of the market and information about key companies, including:
- Staples Inc.
- Office Depot Inc.
- Walmart Inc.
- Amazon Business
- Lyra Network
- ACCO Brands Corporation
- 3M Company
- Newell Brands
- BIC Corporation
- Pilot Corporation
- Kokuyo Co. Ltd.
- Mitsubishi Pencil Co. Ltd.
- Faber-Castell
- Schwan-Stabilo Group
- Pelikan International Corporation Berhad
- Esselte Group
- Maped
- Adel Kalemcilik
- Kum GmbH & Co. KG
- Staedtler Mars GmbH & Co. KG
Qualitative and quantitative analysis of companies has been conducted to help clients understand the wider business environment as well as the strengths and weaknesses of key industry players. Data is qualitatively analyzed to categorize companies as pure play, category-focused, industry-focused, and diversified; it is quantitatively analyzed to categorize companies as dominant, leading, strong, tentative, and weak.
Recent Development and News in Office Stationery And Supplies B2B Market
- In January 2024, office supplies giant Office Depot announced a strategic partnership with tech company Microsoft, integrating Microsoft's productivity software into Office Depot's online platform to streamline business operations for their B2B clients (Office Depot Press Release).
- In March 2024, Staples, another major office supplies retailer, completed the acquisition of Quill Corporation, a leading provider of custom promotional products, expanding their product offerings and strengthening their presence in the promotional merchandise sector (Staples Press Release).
- In April 2025, 3M, a global innovation company, launched its new line of recycled and biodegradable office supplies, marking a significant technological advancement in the industry and catering to the growing demand for eco-friendly products (3M Press Release).
- In May 2025, the European Union passed the Single Use Plastics Directive, banning the sale and distribution of certain single-use plastic office supplies from 2027, prompting suppliers to invest in sustainable alternatives and adapt their product lines accordingly (European Parliament Press Release).
Research Analyst Overview
- The market continues to evolve, with collaboration tools integration and print management services becoming increasingly important for businesses seeking to streamline operations and enhance productivity. E-invoicing systems and digital asset management are also gaining traction, as companies prioritize automation and efficiency in their procurement processes. Customer satisfaction scores remain a key performance indicator, with businesses implementing employee satisfaction surveys and risk mitigation strategies to ensure a positive work environment and minimize potential disruptions. Moreover, supply chain traceability and on-time delivery rates are crucial for maintaining a competitive edge, as businesses strive for greater transparency and efficiency in their operations.
- Office equipment maintenance and returns management processes are also essential components of a well-run supply chain, as is contract lifecycle management and performance measurement dashboards. Industry growth in the office stationery and supplies sector is expected to reach 3% annually, driven by the increasing adoption of remote work solutions and business continuity planning. For instance, a leading company in the sector reported a 15% increase in sales due to the shift to remote work. The integration of warehouse management systems, sales order processing, and supplier risk management into their operations enabled them to optimize inventory levels and improve order fulfillment efficiency.
- Additionally, product catalog management, office supply consolidation, price negotiation tactics, and inventory optimization techniques are all critical strategies for staying competitive in this dynamic market.
Dive into Technavio's robust research methodology, blending expert interviews, extensive data synthesis, and validated models for unparalleled Office Stationery And Supplies B2B Market insights. See full methodology.
Market Scope
|
Report Coverage
|
Details
|
Page number
|
225
|
Base year
|
2024
|
Historic period
|
2019-2023 |
Forecast period
|
2025-2029
|
Growth momentum & CAGR
|
Accelerate at a CAGR of 3%
|
Market growth 2025-2029
|
USD 33.9 billion
|
Market structure
|
Fragmented
|
YoY growth 2024-2025(%)
|
2.9
|
Key countries
|
US, Germany, Canada, UK, China, Japan, France, India, Italy, and South Korea
|
Competitive landscape
|
Leading Companies, Market Positioning of Companies, Competitive Strategies, and Industry Risks
|
Request Free Sample
What are the Key Data Covered in this Office Stationery And Supplies B2B Market Research and Growth Report?
- CAGR of the Office Stationery And Supplies B2B industry during the forecast period
- Detailed information on factors that will drive the growth and forecasting between 2025 and 2029
- Precise estimation of the size of the market and its contribution of the industry in focus to the parent market
- Accurate predictions about upcoming growth and trends and changes in consumer behaviour
- Growth of the market across North America, Europe, APAC, South America, and Middle East and Africa
- Thorough analysis of the market's competitive landscape and detailed information about companies
- Comprehensive analysis of factors that will challenge the office stationery and supplies b2b market growth of industry companies
We can help! Our analysts can customize this office stationery and supplies b2b market research report to meet your requirements.
Get in touch
1 Executive Summary
- 1.1 Market overview
- Executive Summary - Chart on Market Overview
- Executive Summary - Data Table on Market Overview
- Executive Summary - Chart on Global Market Characteristics
- Executive Summary - Chart on Market by Geography
- Executive Summary - Chart on Market Segmentation by Distribution Channel
- Executive Summary - Chart on Market Segmentation by Type
- Executive Summary - Chart on Market Segmentation by End-user
- Executive Summary - Chart on Incremental Growth
- Executive Summary - Data Table on Incremental Growth
- Executive Summary - Chart on Company Market Positioning
2 Technavio Analysis
- 2.1 Analysis of price sensitivity, lifecycle, customer purchase basket, adoption rates, and purchase criteria
- Analysis of price sensitivity, lifecycle, customer purchase basket, adoption rates, and purchase criteria
- 2.2 Criticality of inputs and Factors of differentiation
- Overview on criticality of inputs and factors of differentiation
- 2.3 Factors of disruption
- Overview on factors of disruption
- 2.4 Impact of drivers and challenges
- Impact of drivers and challenges in 2024 and 2029
3 Market Landscape
- 3.1 Market ecosystem
- Parent Market
- Data Table on - Parent Market
- 3.2 Market characteristics
- Market characteristics analysis
4 Market Sizing
- 4.1 Market definition
- Offerings of companies included in the market definition
- 4.2 Market segment analysis
- 4.4 Market outlook: Forecast for 2024-2029
- Chart on Global - Market size and forecast 2024-2029 ($ billion)
- Data Table on Global - Market size and forecast 2024-2029 ($ billion)
- Chart on Global Market: Year-over-year growth 2024-2029 (%)
- Data Table on Global Market: Year-over-year growth 2024-2029 (%)
5 Historic Market Size
- 5.1 Global Office Stationery And Supplies B2B Market 2019 - 2023
- Historic Market Size - Data Table on Global Office Stationery And Supplies B2B Market 2019 - 2023 ($ billion)
- 5.2 Distribution Channel segment analysis 2019 - 2023
- Historic Market Size - Distribution Channel Segment 2019 - 2023 ($ billion)
- 5.3 Type segment analysis 2019 - 2023
- Historic Market Size - Type Segment 2019 - 2023 ($ billion)
- 5.4 End-user segment analysis 2019 - 2023
- Historic Market Size - End-user Segment 2019 - 2023 ($ billion)
- 5.5 Geography segment analysis 2019 - 2023
- Historic Market Size - Geography Segment 2019 - 2023 ($ billion)
- 5.6 Country segment analysis 2019 - 2023
- Historic Market Size - Country Segment 2019 - 2023 ($ billion)
6 Qualitative Analysis
- 6.1 Impact of AI on the global office stationery and supplies B2B market
7 Five Forces Analysis
- 7.1 Five forces summary
- Five forces analysis - Comparison between 2024 and 2029
- 7.2 Bargaining power of buyers
- Bargaining power of buyers - Impact of key factors 2024 and 2029
- 7.3 Bargaining power of suppliers
- Bargaining power of suppliers - Impact of key factors in 2024 and 2029
- 7.4 Threat of new entrants
- Threat of new entrants - Impact of key factors in 2024 and 2029
- 7.5 Threat of substitutes
- Threat of substitutes - Impact of key factors in 2024 and 2029
- 7.6 Threat of rivalry
- Threat of rivalry - Impact of key factors in 2024 and 2029
- 7.7 Market condition
- Chart on Market condition - Five forces 2024 and 2029
8 Market Segmentation by Distribution Channel
- 8.1 Market segments
- Chart on Distribution Channel - Market share (2024-2029) (%)
- Data Table on Distribution Channel - Market share (2024-2029) (%)
- 8.2 Comparison by Distribution Channel
- Chart on Comparison by Distribution Channel
- Data Table on Comparison by Distribution Channel
- 8.3 Offline - Market size and forecast (2024-2029)
- Chart on Offline - Market size and forecast (2024-2029) ($ billion)
- Data Table on Offline - Market size and forecast (2024-2029) ($ billion)
- Chart on Offline - Year-over-year growth (2024-2029) (%)
- Data Table on Offline - Year-over-year growth (2024-2029) (%)
- 8.4 Online - Market size and forecast (2024-2029)
- Chart on Online - Market size and forecast (2024-2029) ($ billion)
- Data Table on Online - Market size and forecast (2024-2029) ($ billion)
- Chart on Online - Year-over-year growth (2024-2029) (%)
- Data Table on Online - Year-over-year growth (2024-2029) (%)
- 8.5 Market opportunity by Distribution Channel
- Market opportunity by Distribution Channel ($ billion)
- Data Table on Market opportunity by Distribution Channel ($ billion)
9 Market Segmentation by Type
- 9.1 Market segments
- Chart on Type - Market share (2024-2029) (%)
- Data Table on Type - Market share (2024-2029) (%)
- 9.2 Comparison by Type
- Chart on Comparison by Type
- Data Table on Comparison by Type
- 9.3 Paper products - Market size and forecast (2024-2029)
- Chart on Paper products - Market size and forecast (2024-2029) ($ billion)
- Data Table on Paper products - Market size and forecast (2024-2029) ($ billion)
- Chart on Paper products - Year-over-year growth (2024-2029) (%)
- Data Table on Paper products - Year-over-year growth (2024-2029) (%)
- 9.4 Desk supplies - Market size and forecast (2024-2029)
- Chart on Desk supplies - Market size and forecast (2024-2029) ($ billion)
- Data Table on Desk supplies - Market size and forecast (2024-2029) ($ billion)
- Chart on Desk supplies - Year-over-year growth (2024-2029) (%)
- Data Table on Desk supplies - Year-over-year growth (2024-2029) (%)
- 9.5 Computer and printer supplies - Market size and forecast (2024-2029)
- Chart on Computer and printer supplies - Market size and forecast (2024-2029) ($ billion)
- Data Table on Computer and printer supplies - Market size and forecast (2024-2029) ($ billion)
- Chart on Computer and printer supplies - Year-over-year growth (2024-2029) (%)
- Data Table on Computer and printer supplies - Year-over-year growth (2024-2029) (%)
- 9.6 Stationery and mailing supplies - Market size and forecast (2024-2029)
- Chart on Stationery and mailing supplies - Market size and forecast (2024-2029) ($ billion)
- Data Table on Stationery and mailing supplies - Market size and forecast (2024-2029) ($ billion)
- Chart on Stationery and mailing supplies - Year-over-year growth (2024-2029) (%)
- Data Table on Stationery and mailing supplies - Year-over-year growth (2024-2029) (%)
- 9.7 Others - Market size and forecast (2024-2029)
- Chart on Others - Market size and forecast (2024-2029) ($ billion)
- Data Table on Others - Market size and forecast (2024-2029) ($ billion)
- Chart on Others - Year-over-year growth (2024-2029) (%)
- Data Table on Others - Year-over-year growth (2024-2029) (%)
- 9.8 Market opportunity by Type
- Market opportunity by Type ($ billion)
- Data Table on Market opportunity by Type ($ billion)
10 Market Segmentation by End-user
- 10.1 Market segments
- Chart on End-user - Market share (2024-2029) (%)
- Data Table on End-user - Market share (2024-2029) (%)
- 10.2 Comparison by End-user
- Chart on Comparison by End-user
- Data Table on Comparison by End-user
- 10.3 Commercial - Market size and forecast (2024-2029)
- Chart on Commercial - Market size and forecast (2024-2029) ($ billion)
- Data Table on Commercial - Market size and forecast (2024-2029) ($ billion)
- Chart on Commercial - Year-over-year growth (2024-2029) (%)
- Data Table on Commercial - Year-over-year growth (2024-2029) (%)
- 10.4 Education - Market size and forecast (2024-2029)
- Chart on Education - Market size and forecast (2024-2029) ($ billion)
- Data Table on Education - Market size and forecast (2024-2029) ($ billion)
- Chart on Education - Year-over-year growth (2024-2029) (%)
- Data Table on Education - Year-over-year growth (2024-2029) (%)
- 10.5 Others - Market size and forecast (2024-2029)
- Chart on Others - Market size and forecast (2024-2029) ($ billion)
- Data Table on Others - Market size and forecast (2024-2029) ($ billion)
- Chart on Others - Year-over-year growth (2024-2029) (%)
- Data Table on Others - Year-over-year growth (2024-2029) (%)
- 10.6 Market opportunity by End-user
- Market opportunity by End-user ($ billion)
- Data Table on Market opportunity by End-user ($ billion)
11 Customer Landscape
- 11.1 Customer landscape overview
- Analysis of price sensitivity, lifecycle, customer purchase basket, adoption rates, and purchase criteria
12 Geographic Landscape
- 12.1 Geographic segmentation
- Chart on Market share by geography 2024-2029 (%)
- Data Table on Market share by geography 2024-2029 (%)
- 12.2 Geographic comparison
- Chart on Geographic comparison
- Data Table on Geographic comparison
- 12.3 North America - Market size and forecast 2024-2029
- Chart on North America - Market size and forecast 2024-2029 ($ billion)
- Data Table on North America - Market size and forecast 2024-2029 ($ billion)
- Chart on North America - Year-over-year growth 2024-2029 (%)
- Data Table on North America - Year-over-year growth 2024-2029 (%)
- 12.4 Europe - Market size and forecast 2024-2029
- Chart on Europe - Market size and forecast 2024-2029 ($ billion)
- Data Table on Europe - Market size and forecast 2024-2029 ($ billion)
- Chart on Europe - Year-over-year growth 2024-2029 (%)
- Data Table on Europe - Year-over-year growth 2024-2029 (%)
- 12.5 APAC - Market size and forecast 2024-2029
- Chart on APAC - Market size and forecast 2024-2029 ($ billion)
- Data Table on APAC - Market size and forecast 2024-2029 ($ billion)
- Chart on APAC - Year-over-year growth 2024-2029 (%)
- Data Table on APAC - Year-over-year growth 2024-2029 (%)
- 12.6 South America - Market size and forecast 2024-2029
- Chart on South America - Market size and forecast 2024-2029 ($ billion)
- Data Table on South America - Market size and forecast 2024-2029 ($ billion)
- Chart on South America - Year-over-year growth 2024-2029 (%)
- Data Table on South America - Year-over-year growth 2024-2029 (%)
- 12.7 Middle East and Africa - Market size and forecast 2024-2029
- Chart on Middle East and Africa - Market size and forecast 2024-2029 ($ billion)
- Data Table on Middle East and Africa - Market size and forecast 2024-2029 ($ billion)
- Chart on Middle East and Africa - Year-over-year growth 2024-2029 (%)
- Data Table on Middle East and Africa - Year-over-year growth 2024-2029 (%)
- 12.8 US - Market size and forecast 2024-2029
- Chart on US - Market size and forecast 2024-2029 ($ billion)
- Data Table on US - Market size and forecast 2024-2029 ($ billion)
- Chart on US - Year-over-year growth 2024-2029 (%)
- Data Table on US - Year-over-year growth 2024-2029 (%)
- 12.9 Germany - Market size and forecast 2024-2029
- Chart on Germany - Market size and forecast 2024-2029 ($ billion)
- Data Table on Germany - Market size and forecast 2024-2029 ($ billion)
- Chart on Germany - Year-over-year growth 2024-2029 (%)
- Data Table on Germany - Year-over-year growth 2024-2029 (%)
- 12.10 Canada - Market size and forecast 2024-2029
- Chart on Canada - Market size and forecast 2024-2029 ($ billion)
- Data Table on Canada - Market size and forecast 2024-2029 ($ billion)
- Chart on Canada - Year-over-year growth 2024-2029 (%)
- Data Table on Canada - Year-over-year growth 2024-2029 (%)
- 12.11 UK - Market size and forecast 2024-2029
- Chart on UK - Market size and forecast 2024-2029 ($ billion)
- Data Table on UK - Market size and forecast 2024-2029 ($ billion)
- Chart on UK - Year-over-year growth 2024-2029 (%)
- Data Table on UK - Year-over-year growth 2024-2029 (%)
- 12.12 China - Market size and forecast 2024-2029
- Chart on China - Market size and forecast 2024-2029 ($ billion)
- Data Table on China - Market size and forecast 2024-2029 ($ billion)
- Chart on China - Year-over-year growth 2024-2029 (%)
- Data Table on China - Year-over-year growth 2024-2029 (%)
- 12.13 Japan - Market size and forecast 2024-2029
- Chart on Japan - Market size and forecast 2024-2029 ($ billion)
- Data Table on Japan - Market size and forecast 2024-2029 ($ billion)
- Chart on Japan - Year-over-year growth 2024-2029 (%)
- Data Table on Japan - Year-over-year growth 2024-2029 (%)
- 12.14 France - Market size and forecast 2024-2029
- Chart on France - Market size and forecast 2024-2029 ($ billion)
- Data Table on France - Market size and forecast 2024-2029 ($ billion)
- Chart on France - Year-over-year growth 2024-2029 (%)
- Data Table on France - Year-over-year growth 2024-2029 (%)
- 12.15 India - Market size and forecast 2024-2029
- Chart on India - Market size and forecast 2024-2029 ($ billion)
- Data Table on India - Market size and forecast 2024-2029 ($ billion)
- Chart on India - Year-over-year growth 2024-2029 (%)
- Data Table on India - Year-over-year growth 2024-2029 (%)
- 12.16 Italy - Market size and forecast 2024-2029
- Chart on Italy - Market size and forecast 2024-2029 ($ billion)
- Data Table on Italy - Market size and forecast 2024-2029 ($ billion)
- Chart on Italy - Year-over-year growth 2024-2029 (%)
- Data Table on Italy - Year-over-year growth 2024-2029 (%)
- 12.17 South Korea - Market size and forecast 2024-2029
- Chart on South Korea - Market size and forecast 2024-2029 ($ billion)
- Data Table on South Korea - Market size and forecast 2024-2029 ($ billion)
- Chart on South Korea - Year-over-year growth 2024-2029 (%)
- Data Table on South Korea - Year-over-year growth 2024-2029 (%)
- 12.18 Market opportunity by geography
- Market opportunity by geography ($ billion)
- Data Tables on Market opportunity by geography ($ billion)
- 12.19 Rest of World (ROW) - Market size and forecast (2024-2029)
- Chart on Rest of World (ROW) - Market size and forecast (2024-2029) ($ billion)
- Data Table on Rest of World (ROW) - Market size and forecast (2024-2029) ($ billion)
- Chart on Rest of World (ROW) - Year-over-year growth (2024-2029) (%)
- Data Table on Rest of World (ROW) - Year-over-year growth (2024-2029) (%)
13 Drivers, Challenges, and Opportunity/Restraints
- 13.3 Impact of drivers and challenges
- Impact of drivers and challenges in 2024 and 2029
- 13.4 Market opportunities/restraints
14 Competitive Landscape
- 14.2 Competitive Landscape
- Overview on criticality of inputs and factors of differentiation
- 14.3 Landscape disruption
- Overview on factors of disruption
- 14.4 Industry risks
- Impact of key risks on business
15 Competitive Analysis
- 15.2 Market positioning of companies
- Matrix on companies position and classification
- 15.3 Staples Inc.
- Staples Inc. - Overview
- Staples Inc. - Product / Service
- Staples Inc. - Key offerings
- 15.4 Office Depot Inc.
- Office Depot Inc. - Overview
- Office Depot Inc. - Product / Service
- Office Depot Inc. - Key offerings
- 15.5 Walmart Inc.
- Walmart Inc. - Overview
- Walmart Inc. - Product / Service
- Walmart Inc. - Key offerings
- 15.6 Amazon Business
- Amazon Business - Overview
- Amazon Business - Product / Service
- Amazon Business - Key offerings
- 15.7 Lyra Network
- Lyra Network - Overview
- Lyra Network - Product / Service
- Lyra Network - Key offerings
- 15.8 ACCO Brands Corporation
- ACCO Brands Corporation - Overview
- ACCO Brands Corporation - Product / Service
- ACCO Brands Corporation - Key offerings
- 3M Company
- 3M Company - Overview
- 3M Company - Product / Service
- 3M Company - Key offerings
- 15.10 Newell Brands
- Newell Brands - Overview
- Newell Brands - Product / Service
- Newell Brands - Key offerings
- 15.11 BIC Corporation
- BIC Corporation - Overview
- BIC Corporation - Product / Service
- BIC Corporation - Key offerings
- 15.12 Pilot Corporation
- Pilot Corporation - Overview
- Pilot Corporation - Product / Service
- Pilot Corporation - Key offerings
- 15.13 Kokuyo Co. Ltd.
- Kokuyo Co. Ltd. - Overview
- Kokuyo Co. Ltd. - Product / Service
- Kokuyo Co. Ltd. - Key offerings
- 15.14 Mitsubishi Pencil Co. Ltd.
- Mitsubishi Pencil Co. Ltd. - Overview
- Mitsubishi Pencil Co. Ltd. - Product / Service
- Mitsubishi Pencil Co. Ltd. - Key offerings
- 15.15 Faber-Castell
- Faber-Castell - Overview
- Faber-Castell - Product / Service
- Faber-Castell - Key offerings
- 15.16 Schwan-Stabilo Group
- Schwan-Stabilo Group - Overview
- Schwan-Stabilo Group - Product / Service
- Schwan-Stabilo Group - Key offerings
- 15.17 Pelikan International Corporation Berhad
- Pelikan International Corporation Berhad - Overview
- Pelikan International Corporation Berhad - Product / Service
- Pelikan International Corporation Berhad - Key offerings
- 15.18 Esselte Group
- Esselte Group - Overview
- Esselte Group - Product / Service
- Esselte Group - Key offerings
- 15.19 Maped
- Maped - Overview
- Maped - Product / Service
- Maped - Key offerings
- 15.20 Adel Kalemcilik
- Adel Kalemcilik - Overview
- Adel Kalemcilik - Product / Service
- Adel Kalemcilik - Key offerings
- 15.21 Kum GmbH & Co. KG
- Kum GmbH & Co. KG - Overview
- Kum GmbH & Co. KG - Product / Service
- Kum GmbH & Co. KG - Key offerings
- 15.22 Staedtler Mars GmbH & Co. KG
- Staedtler Mars GmbH & Co. KG - Overview
- Staedtler Mars GmbH & Co. KG - Product / Service
- Staedtler Mars GmbH & Co. KG - Key offerings
- 3M Co.
- 3M Co. - Overview
- 3M Co. - Product / Service
- 3M Co. - Key offerings
- 15.24 ACCO Brands Corp.
- ACCO Brands Corp. - Overview
- ACCO Brands Corp. - Product / Service
- ACCO Brands Corp. - Key offerings
- 15.25 Alibaba Group Holding Ltd.
- Alibaba Group Holding Ltd. - Overview
- Alibaba Group Holding Ltd. - Product / Service
- Alibaba Group Holding Ltd. - Key offerings
- 15.26 Amazon.com Inc.
- Amazon.com Inc. - Overview
- Amazon.com Inc. - Product / Service
- Amazon.com Inc. - Key offerings
- 15.27 ANTARK INTERNATIONAL PVT LTD
- ANTARK INTERNATIONAL PVT LTD - Overview
- ANTARK INTERNATIONAL PVT LTD - Product / Service
- ANTARK INTERNATIONAL PVT LTD - Key offerings
- 15.28 Best Buy Co. Inc.
- Best Buy Co. Inc. - Overview
- Best Buy Co. Inc. - Product / Service
- Best Buy Co. Inc. - Key offerings
- 15.29 Costco Wholesale Corp.
- Costco Wholesale Corp. - Overview
- Costco Wholesale Corp. - Product / Service
- Costco Wholesale Corp. - Key offerings
- 15.30 Exacompta Clairefontaine SA
- Exacompta Clairefontaine SA - Overview
- Exacompta Clairefontaine SA - Product / Service
- Exacompta Clairefontaine SA - Key offerings
- 15.31 Farook International Stationery
- Farook International Stationery - Overview
- Farook International Stationery - Product / Service
- Farook International Stationery - Key offerings
- 15.32 Jarir Marketing Co.
- Jarir Marketing Co. - Overview
- Jarir Marketing Co. - Product / Service
- Jarir Marketing Co. - Key offerings
- 15.33 Lyreco SAS
- Lyreco SAS - Overview
- Lyreco SAS - Product / Service
- Lyreco SAS - Key offerings
- 15.34 Middle East Stationery and Trading Co.
- Middle East Stationery and Trading Co. - Overview
- Middle East Stationery and Trading Co. - Product / Service
- Middle East Stationery and Trading Co. - Key offerings
- 15.35 PBS Holding AG
- PBS Holding AG - Overview
- PBS Holding AG - Product / Service
- PBS Holding AG - Key offerings
- 15.36 Societe BIC
- Societe BIC - Overview
- Societe BIC - Product / Service
- Societe BIC - Key offerings
- 15.37 Sycamore Partners
- Sycamore Partners - Overview
- Sycamore Partners - Product / Service
- Sycamore Partners - Key offerings
- 15.38 Target Corp.
- Target Corp. - Overview
- Target Corp. - Product / Service
- Target Corp. - Key offerings
- 15.39 The Hamelin Group Holdham
- The Hamelin Group Holdham - Overview
- The Hamelin Group Holdham - Product / Service
- The Hamelin Group Holdham - Key offerings
- 15.40 The ODP Corp.
- The ODP Corp. - Overview
- The ODP Corp. - Product / Service
- The ODP Corp. - Key offerings
- 15.41 Walmart Inc.
- Walmart Inc. - Overview
- Walmart Inc. - Product / Service
- Walmart Inc. - Key offerings
- 15.42 WH Smith PLC
- WH Smith PLC - Overview
- WH Smith PLC - Product / Service
- WH Smith PLC - Key offerings
16 Appendix
- 16.2 Inclusions and exclusions checklist
- Inclusions checklist
- Exclusions checklist
- 16.3 Currency conversion rates for US$
- Currency conversion rates for US$
- 16.4 Research methodology
- 16.7 Validation techniques employed for market sizing
- Validation techniques employed for market sizing
- 16.9 360 degree market analysis
- 360 degree market analysis
- 16.10 List of abbreviations