Oilseeds Market Size 2026-2030
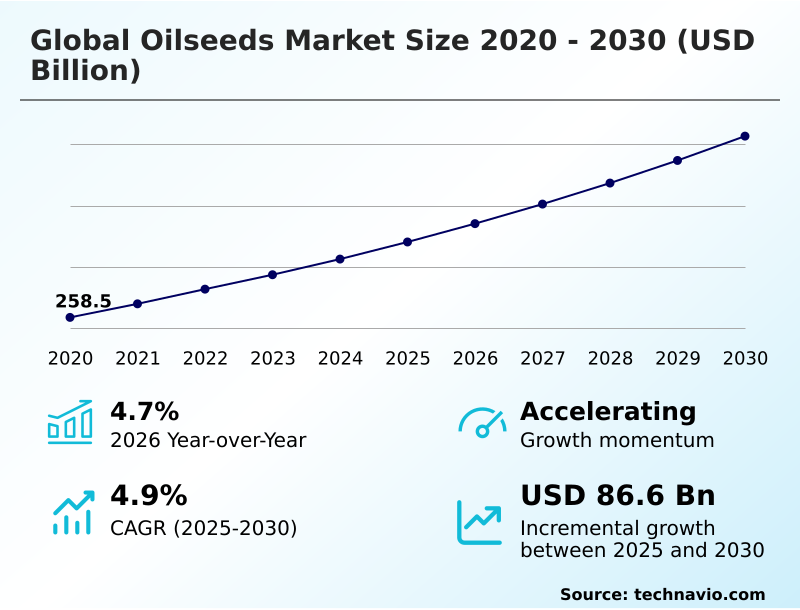
The oilseeds market size is valued to increase by USD 86.6 billion, at a CAGR of 4.9% from 2025 to 2030. Escalating demand for vegetable oils in biofuel sector will drive the oilseeds market.
Major Market Trends & Insights
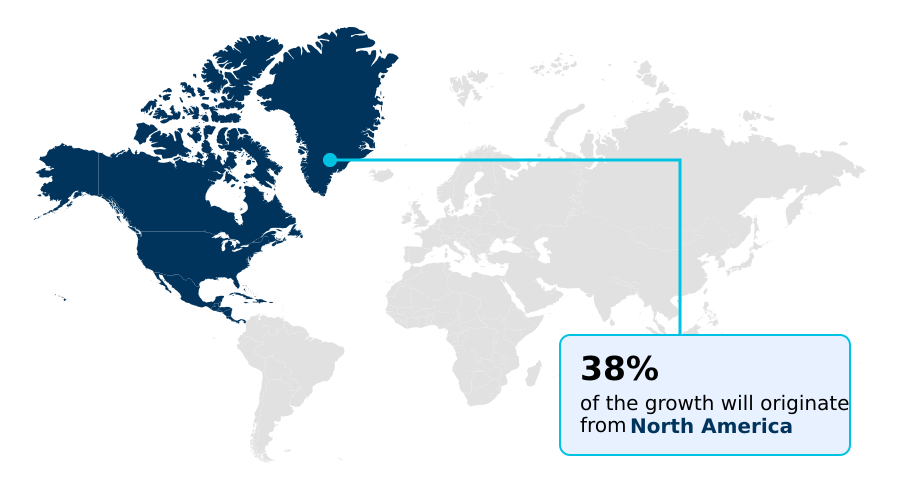
- North America dominated the market and accounted for a 38.2% growth during the forecast period.
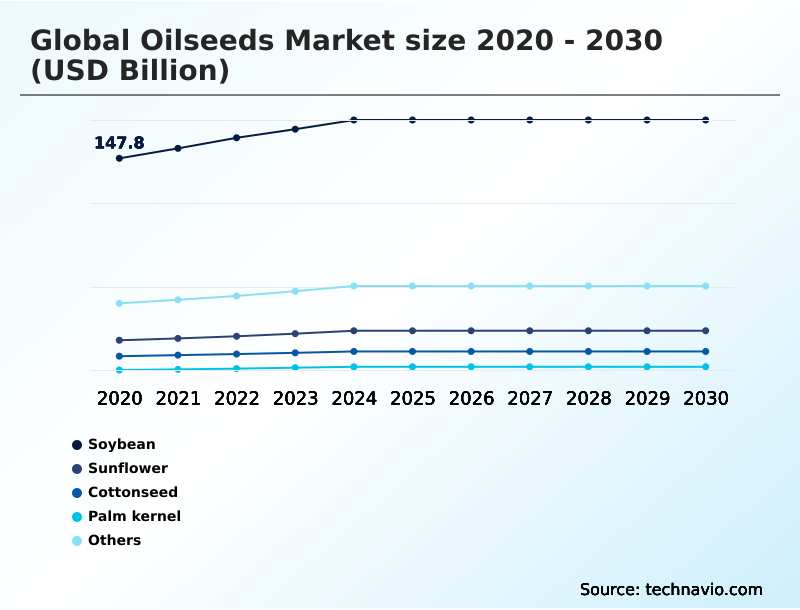
- By Type - Soybean segment was valued at USD 172.8 billion in 2024
- By Product - Animal feed segment accounted for the largest market revenue share in 2024
Market Size & Forecast
- Market Opportunities: USD 148.3 billion
- Market Future Opportunities: USD 86.6 billion
- CAGR from 2025 to 2030 : 4.9%
Market Summary
- The oilseeds market is undergoing a significant transformation, defined by the dual demand for food and fuel. Cultivated for vegetable oil extraction and protein-rich meals, crops like soybeans and canola are central to global food supply chains and the expanding plant-based protein sector.
- A primary driver is the escalating need for biofuel feedstock, which is compelling processors to increase crushing capacity and invest in agricultural biotechnology to develop high-oleic varieties. This shift creates a complex interplay between food security and energy mandates.
- For instance, a processing firm must now balance investments in new solvent extraction facilities for renewable diesel against the need to supply consistent, high-quality protein meal for the animal feed industry. This dynamic is compounded by challenges such as climate volatility, which affects production stability, and geopolitical tensions that disrupt established commodity trading routes.
- Consequently, supply chain integration and risk management have become critical for navigating price fluctuations and ensuring feedstock eligibility under evolving low-carbon fuel standards. Success depends on adapting to these interconnected pressures through technological innovation and strategic market positioning.
What will be the Size of the Oilseeds Market during the forecast period?
Get Key Insights on Market Forecast (PDF) Get Free Sample
How is the Oilseeds Market Segmented?
The oilseeds industry research report provides comprehensive data (region-wise segment analysis), with forecasts and estimates in "USD billion" for the period 2026-2030, as well as historical data from 2020-2024 for the following segments.
- Type
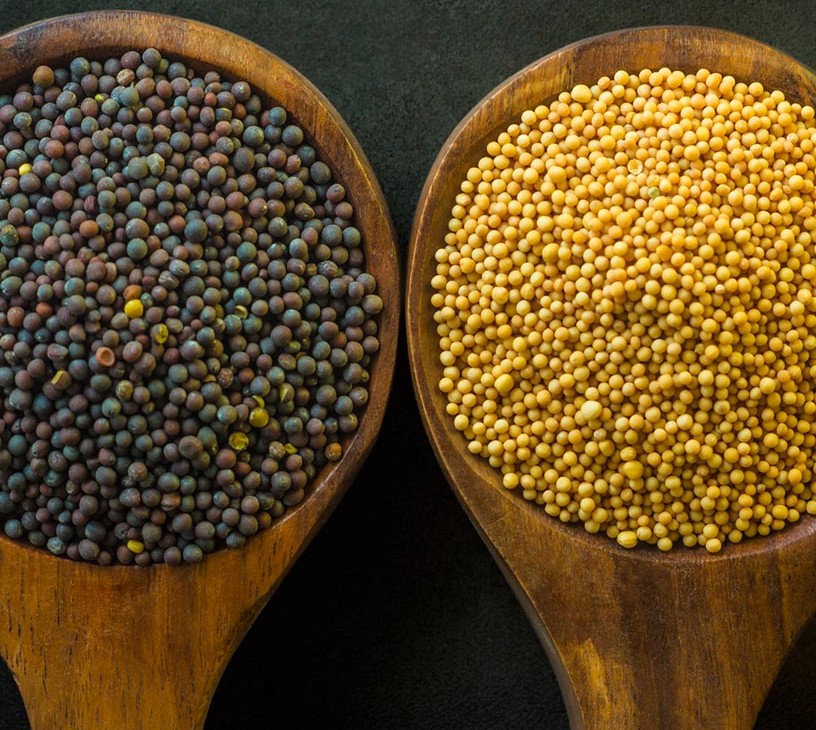
- Soybean
- Sunflower
- Cottonseed
- Palm kernel
- Others
- Product
- Animal feed
- Edible oil
- Application
- Vegetable oil
- Oilseed meal
- Geography
- North America
- US
- Canada
- Mexico
- APAC
- China
- India
- Indonesia
- Europe
- Germany
- France
- UK
- South America
- Brazil
- Argentina
- Middle East and Africa
- South Africa
- Israel
- Turkey
- Rest of World (ROW)
- North America
By Type Insights
The soybean segment is estimated to witness significant growth during the forecast period.
The soybean segment maintains its market leadership, driven by its dual utility in producing high-protein meal for livestock and premium vegetable oil for food and industrial applications.
Demand is increasingly shaped by the renewable energy sector, where soybean oil is a primary biofuel feedstock. This has spurred significant investment in crushing infrastructure to maximize oil extraction while managing the resulting protein-rich meals.
This strategic shift toward value-added processing and supply chain integration is critical, as soybeans now constitute over 56% of the total oilseeds market volume.
The segment's resilience is further enhanced by its role in plant-based protein and the ongoing development of seed varieties with improved disease resistance and specialized fatty acid profiles through agricultural biotechnology.
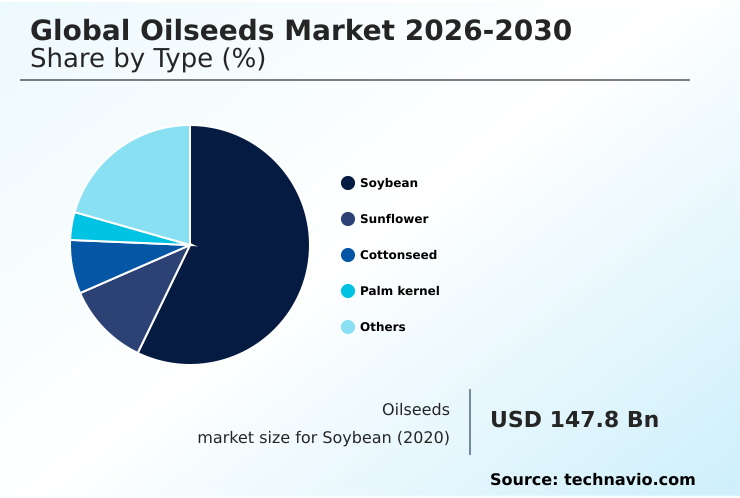
The Soybean segment was valued at USD 172.8 billion in 2024 and showed a gradual increase during the forecast period.
Regional Analysis
North America is estimated to contribute 38.2% to the growth of the global market during the forecast period.Technavio’s analysts have elaborately explained the regional trends and drivers that shape the market during the forecast period.
See How Oilseeds Market Demand is Rising in North America Get Free Sample
The global oilseeds market's geographic landscape is dominated by North America, which captures over 38% of the incremental growth opportunity, primarily due to expanding crushing infrastructure for renewable diesel.
The US and Canada are pivotal, leveraging advanced farm mechanization and precision agriculture to enhance yields.
In APAC, countries like India and China are focused on boosting domestic production to ensure food security initiatives, with the region showing significant growth potential. Europe remains a key consumer, emphasizing sustainability certification and deforestation-free certification for its imports.
Meanwhile, investments in new crushing facilities in key regions have improved processing yields by up to 5%, demonstrating a clear return on capital expenditure aimed at enhancing operational efficiency and downstream value addition across the global logistics networks.
Market Dynamics
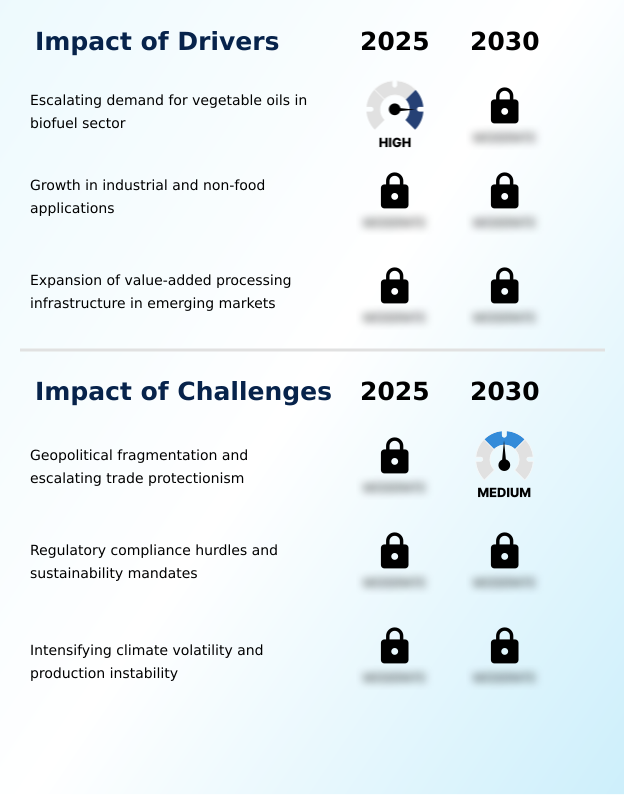
Our researchers analyzed the data with 2025 as the base year, along with the key drivers, trends, and challenges. A holistic analysis of drivers will help companies refine their marketing strategies to gain a competitive advantage.
- The global oilseeds market is navigating a complex interplay of economic and environmental factors. The impact of biofuel on oilseed prices is a central theme, as the demand for soybean oil for renewable diesel production reshapes crushing economics. This has spurred significant investment in oilseed crushing infrastructure, particularly for canola crushing for biofuel feedstock supply.
- The viability of sustainable aviation fuel from oilseed crops is also being explored, further integrating agriculture and energy supply chains. However, the geopolitical impact on oilseed trade flows, including the risk of trade protectionism affecting canola exports, introduces significant price volatility in vegetable oil markets.
- This requires sophisticated strategies for managing protein meal surplus from biofuel production and ensuring the supply chain for deforestation-free soy meets regulatory hurdles for oilseed sustainability. Processors with technology in oilseed processing plants that allows for flexible processing for different oilseeds have reported up to a twofold increase in supply chain resilience.
- Meanwhile, demand for high-oleic soybean oil market demand continues to grow, driven by consumer health trends and the expanding role of oilseeds in plant-based protein. Oilseed meal in animal feed formulation remains a foundational market, though advanced seed genetics for oil content are prioritizing oil extraction.
- Ultimately, navigating climate change effects on oilseed production and optimizing oilseed processing and value addition are critical for long-term success.
What are the key market drivers leading to the rise in the adoption of Oilseeds Industry?
- Escalating demand for vegetable oils from the biofuel sector is a key driver propelling market growth.
- Market growth is primarily driven by the escalating demand for oilseeds as a biofuel feedstock, which has established a new price floor for vegetable oil independent of food consumption.
- This has triggered substantial investment in new crushing infrastructure, with modern facilities designed to improve oil extraction rates by over 8%.
- Such investments in value-added processing allow companies to capture higher margins, increasing profitability by up to 15% compared to selling raw agricultural commodities. The development of an integrated supply chain, connecting agricultural inputs with energy sector outputs, is crucial.
- This alignment is supported by advancements in crop science and plant breeding, which deliver high-oleic varieties and specialized seed varieties tailored for both industrial and nutritional applications.
What are the market trends shaping the Oilseeds Industry?
- The expansion of renewable diesel and biofuel feedstock capacity is emerging as a significant market trend. This development is fundamentally reshaping supply chains and investment priorities within the industry.
- Key market trends are centered on the aggressive expansion of processing capabilities to meet demand from the renewable energy sector, where vegetable oil is now a primary energy commodity. Strategic market consolidation and supply chain integration are reshaping the competitive landscape, with major players acquiring assets to enhance their global logistics networks and secure feedstock supplies.
- This has improved operational efficiency by over 10% in integrated facilities. Furthermore, policy-driven food security initiatives are altering trade dynamics, compelling exporters to adapt to new regulatory compliance and sustainability certification standards. These shifts are creating a market where portfolio diversification and downstream value addition are essential for managing risk and capitalizing on emerging opportunities in both food and fuel.
What challenges does the Oilseeds Industry face during its growth?
- Geopolitical fragmentation and escalating trade protectionism represent a key challenge affecting the industry's growth trajectory.
- The market faces significant challenges from geopolitical fragmentation and escalating trade protectionism, which disrupt established trade dynamics and create intense price volatility. An anti-dumping investigation can increase sourcing costs by over 20% and force a complete realignment of supply chains.
- Furthermore, intensifying climate volatility leads to production instability, with extreme weather events causing yield variances of up to 15% in key agricultural regions. These factors undermine market access and complicate risk management. Navigating these hurdles requires resilient and flexible processing capabilities, as well as deep expertise in managing commodity prices across a fragmented global landscape.
- Failure to adapt can severely impact profitability and long-term growth.
Exclusive Technavio Analysis on Customer Landscape
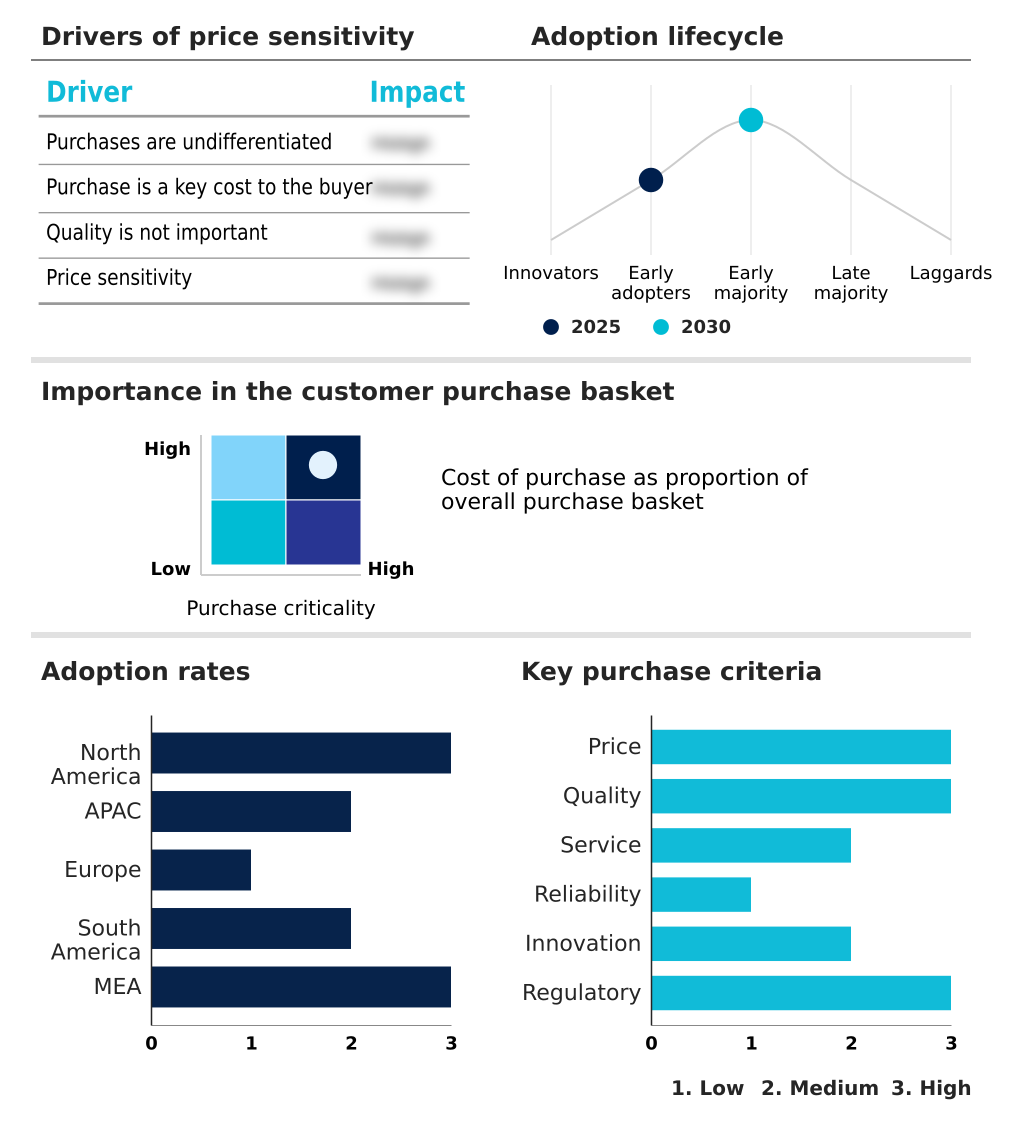
The oilseeds market forecasting report includes the adoption lifecycle of the market, covering from the innovator’s stage to the laggard’s stage. It focuses on adoption rates in different regions based on penetration. Furthermore, the oilseeds market report also includes key purchase criteria and drivers of price sensitivity to help companies evaluate and develop their market growth analysis strategies.
Customer Landscape of Oilseeds Industry
Competitive Landscape
Companies are implementing various strategies, such as strategic alliances, oilseeds market forecast, partnerships, mergers and acquisitions, geographical expansion, and product/service launches, to enhance their presence in the industry.
Archer Daniels Midland Co. - Analysis reveals a vertically integrated agribusiness focused on oilseed processing, commodity trading, and creating value-added food, feed, and fuel ingredients for global supply chains.
The industry research and growth report includes detailed analyses of the competitive landscape of the market and information about key companies, including:
- Archer Daniels Midland Co.
- Bayer AG
- Bora Foods Pvt. Ltd.
- Buhler AG
- Bunge Global SA
- Cargill Inc.
- CHS Inc.
- Corteva Inc.
- ETG Group
- Kanematsu Corp.
- KWS SAAT SE and Co. KGaA
- Louis Dreyfus Co. BV
- Mahyco Pvt. Ltd.
- Mountain States Oilseeds LLC
- Nuziveedu Seeds Ltd.
- Richardson International Ltd.
- Rowland Seeds Inc.
- Tovarna Olja Gea d.o.o.
- Wilmar International Ltd.
Qualitative and quantitative analysis of companies has been conducted to help clients understand the wider business environment as well as the strengths and weaknesses of key industry players. Data is qualitatively analyzed to categorize companies as pure play, category-focused, industry-focused, and diversified; it is quantitatively analyzed to categorize companies as dominant, leading, strong, tentative, and weak.
Recent Development and News in Oilseeds market
- In September 2024, China's Ministry of Commerce launched an anti-dumping investigation into canola imports from Canada, a move seen as a retaliatory measure that immediately impacted trade dynamics.
- In September 2024, Scoular opened a new dual-capability oilseed crushing facility in the United States, designed to process both soybeans and canola to supply the renewable fuels industry.
- In October 2024, the Union Cabinet of India approved the National Mission on Edible Oils-Oilseeds, a policy aimed at boosting domestic production and reducing reliance on imports.
- In May 2025, Louis Dreyfus Co. inaugurated a new glycerin refining plant and an edible oil packaging line in Indonesia, enhancing its downstream production of higher-margin derivatives.
Dive into Technavio’s robust research methodology, blending expert interviews, extensive data synthesis, and validated models for unparalleled Oilseeds Market insights. See full methodology.
| Market Scope | |
|---|---|
| Page number | 288 |
| Base year | 2025 |
| Historic period | 2020-2024 |
| Forecast period | 2026-2030 |
| Growth momentum & CAGR | Accelerate at a CAGR of 4.9% |
| Market growth 2026-2030 | USD 86.6 billion |
| Market structure | Fragmented |
| YoY growth 2025-2026(%) | 4.7% |
| Key countries | US, Canada, Mexico, China, India, Indonesia, Australia, Japan, South Korea, Germany, France, UK, Italy, Spain, The Netherlands, Brazil, Argentina, Chile, South Africa, Israel, Turkey, Saudi Arabia and UAE |
| Competitive landscape | Leading Companies, Market Positioning of Companies, Competitive Strategies, and Industry Risks |
Research Analyst Overview
- The oilseeds market is defined by a structural shift where value-added processing is becoming paramount. Boardroom decisions increasingly center on capital allocation for either expanding oilseed crushing infrastructure for biofuel feedstock or investing in agricultural biotechnology and advanced seed genetics.
- The push for renewable diesel and sustainable aviation fuel is fundamentally altering commodity trading dynamics, making feedstock eligibility under low-carbon fuel standards a critical determinant of profitability. This has intensified the focus on developing high-oleic varieties and other specialized seed varieties to optimize fatty acid profiles for industrial use.
- Consequently, the industry is moving beyond the simple trade of agricultural commodities toward a sophisticated model of supply chain integration. New solvent extraction technologies are enabling processors to achieve over a 15% improvement in efficiency, directly impacting margins from refined and specialty oils.
- However, this progress is tempered by risks like climate volatility, trade protectionism, and the complexities of managing protein meal outputs from food processing and milling products.
What are the Key Data Covered in this Oilseeds Market Research and Growth Report?
-
What is the expected growth of the Oilseeds Market between 2026 and 2030?
-
USD 86.6 billion, at a CAGR of 4.9%
-
-
What segmentation does the market report cover?
-
The report is segmented by Type (Soybean, Sunflower, Cottonseed, Palm kernel, and Others), Product (Animal feed, and Edible oil), Application (Vegetable oil, and Oilseed meal) and Geography (North America, APAC, Europe, South America, Middle East and Africa)
-
-
Which regions are analyzed in the report?
-
North America, APAC, Europe, South America and Middle East and Africa
-
-
What are the key growth drivers and market challenges?
-
Escalating demand for vegetable oils in biofuel sector, Geopolitical fragmentation and escalating trade protectionism
-
-
Who are the major players in the Oilseeds Market?
-
Archer Daniels Midland Co., Bayer AG, Bora Foods Pvt. Ltd., Buhler AG, Bunge Global SA, Cargill Inc., CHS Inc., Corteva Inc., ETG Group, Kanematsu Corp., KWS SAAT SE and Co. KGaA, Louis Dreyfus Co. BV, Mahyco Pvt. Ltd., Mountain States Oilseeds LLC, Nuziveedu Seeds Ltd., Richardson International Ltd., Rowland Seeds Inc., Tovarna Olja Gea d.o.o. and Wilmar International Ltd.
-
Market Research Insights
- The market's dynamics are shaped by a strategic pivot toward value-added processing, driven by the need for enhanced operational efficiency and portfolio diversification. Stakeholders are investing in flexible processing capabilities to manage fluctuating commodity prices and meet stringent regulatory compliance for sustainability certification.
- This focus on creating an integrated supply chain has yielded tangible results, with some operators reporting a 10% improvement in price discovery accuracy through advanced analytics. Furthermore, the adoption of precision agriculture and genetically modified seed technologies supports greater supply chain transparency.
- These efforts are critical as organizations navigate complex trade dynamics, where optimized origination and merchandising can reduce logistics costs by over 15%, strengthening market access and overall resilience.
We can help! Our analysts can customize this oilseeds market research report to meet your requirements.
 RIA -
RIA - 
