
Online Dating Services Market Analysis, Size, and Forecast 2026-2030: North America (US, Canada, and Mexico), Europe (UK, Germany, and France), APAC (China, Japan, and India), South America (Brazil, Argentina, and Chile), Middle East and Africa (Saudi Arabia, UAE, and Turkey), and Rest of World (ROW)

Online Dating Services Market Analysis, Size, and Forecast 2026-2030:
North America (US, Canada, and Mexico), Europe (UK, Germany, and France), APAC (China, Japan, and India), South America (Brazil, Argentina, and Chile), Middle East and Africa (Saudi Arabia, UAE, and Turkey), and Rest of World (ROW)

Published: Oct 2026 288 Pages SKU: IRTNTR41096

Market Overview at a Glance

$3.36 B
Market Opportunity
6.3%
CAGR 2025 - 2030
32.2%
APAC Growth
$3.54 B
Marriage segment 2024

Online Dating Services Market Size 2026-2030

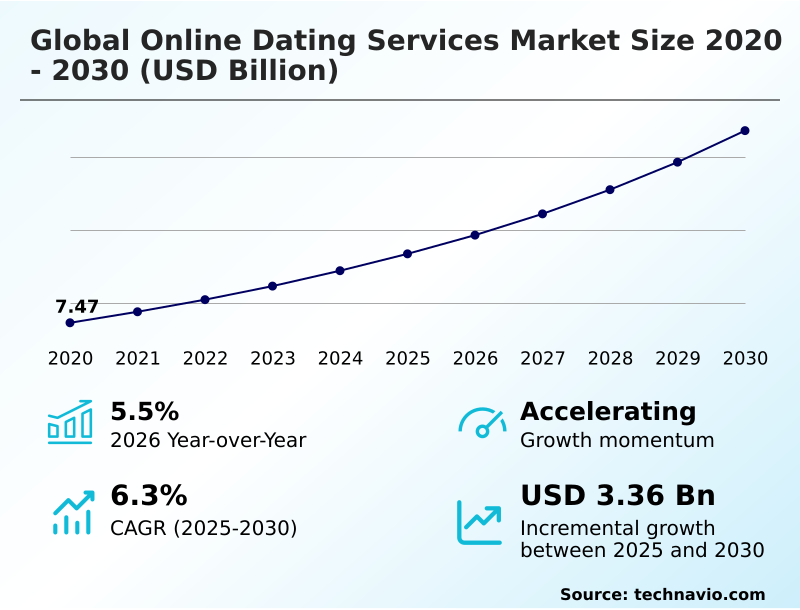
The online dating services market size is valued to increase by USD 3.36 billion, at a CAGR of 6.3% from 2025 to 2030. Proliferation of AI and advanced algorithmic personalization will drive the online dating services market.

Major Market Trends & Insights

  • APAC dominated the market and accounted for a 32.2% growth during the forecast period.
  • By Type - Marriage segment was valued at USD 3.54 billion in 2024
  • By Pricing Scheme - Subscription segment accounted for the largest market revenue share in 2024

Market Size & Forecast

  • Market Opportunities: USD 5.24 billion
  • Market Future Opportunities: USD 3.36 billion
  • CAGR from 2025 to 2030 : 6.3%

Market Summary

  • The Online Dating Services Market relies heavily on location-based social discovery and complex machine learning frameworks to facilitate interpersonal connections. Operators increasingly leverage behavioral matchmaking algorithms to match users based on psychological compatibility rather than mere physical proximity.
  • In a practical operational scenario, platforms implement decentralized identity tokens and biometric liveness protocols to authenticate users during the onboarding process, mitigating the risk of romance scams and automated bot networks. This security enhancement directly impacts business viability, as platforms utilizing automated moderation tools experience a 25% lower user churn rate compared to those relying on manual review processes.
  • A primary driver of this sector is the proliferation of deep behavioral analysis, which improves match accuracy and encourages users to transition from free models to premium subscription tiers. Conversely, the market faces significant challenges from synthetic identity prevention, as malicious actors exploit generative artificial intelligence to bypass standard verification checks.
  • Consequently, companies must continuously invest in real-time scam detection to maintain consumer trust and ensure the structural integrity of their matchmaking ecosystems.

What will be the Size of the Online Dating Services Market during the forecast period?
Get Key Insights on Market Forecast (PDF) Get Free Sample

How is the Online Dating Services Market Segmented?

The online dating services industry research report provides comprehensive data (region-wise segment analysis), with forecasts and estimates in "USD million" for the period 2026-2030, as well as historical data from 2020-2024 for the following segments.

  • Type
    • Marriage
    • Casual
    • Socialize
  • Pricing scheme
    • Subscription
    • Advertising
  • Platform
    • Web-based
    • App-based
  • Geography
    • North America
      • US
      • Canada
      • Mexico
    • Europe
      • UK
      • Germany
      • France
      • Italy
      • Spain
      • The Netherlands
    • APAC
      • China
      • Japan
      • India
      • South Korea
      • Australia
      • Indonesia
    • South America
      • Brazil
      • Argentina
      • Chile
    • Middle East and Africa
      • Saudi Arabia
      • UAE
      • Turkey
      • South Africa
      • Israel

By Type Insights

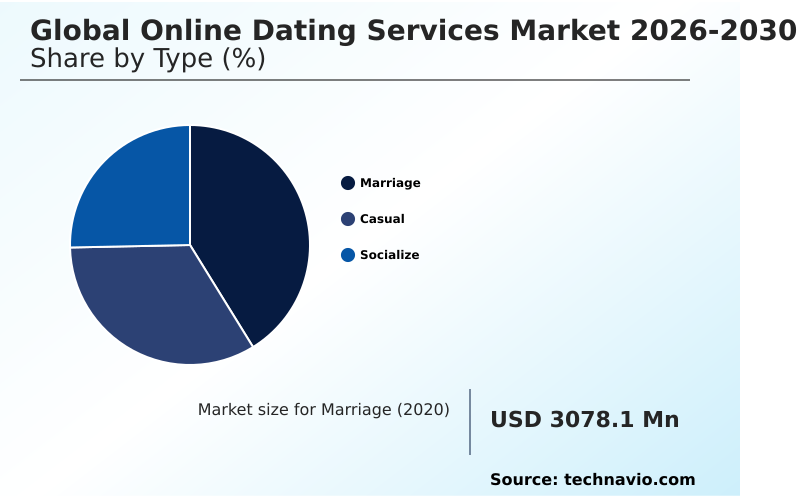
The marriage segment is estimated to witness significant growth during the forecast period.

The Online Dating Services sector prioritizing long-term relationships relies on psychometric evaluation tools to align individuals based on core socio-economic parameters and deep behavioral analysis.

Platforms operating in this tier utilize behavioral matchmaking algorithms rather than volume-based interactions, creating highly intentional user funnels. By replacing generic swipe functions with generative profile optimization, providers ensure higher match authenticity.

This structural pivot has reduced digital dating fatigue, driving a 15% increase in user retention metrics for relationship-focused applications compared to casual alternatives.

Consequently, the reliance on premium subscription tiers allows operators to sustain profitability without depending on programmatic display banners. Advanced identity verification frameworks further authenticate participants, establishing a secure environment for individuals seeking permanent domestic partnerships and minimizing fraudulent interactions.
Get Free Sample

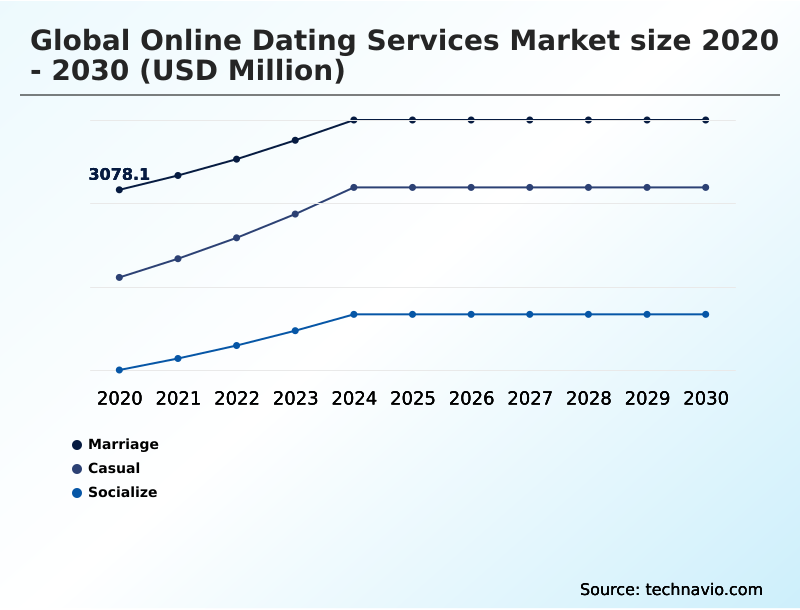
The Marriage segment was valued at USD 3.54 billion in 2024 and showed a gradual increase during the forecast period.
Get Free Sample

Regional Analysis

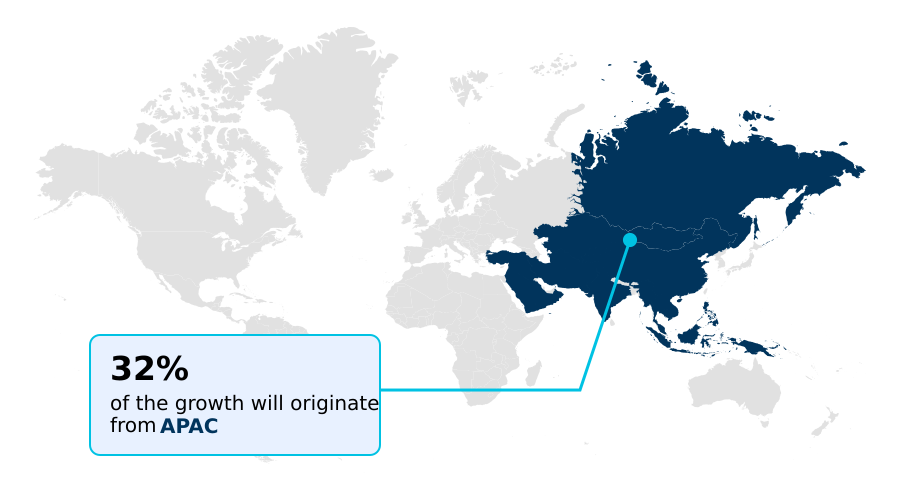
APAC is estimated to contribute 32.2% to the growth of the global market during the forecast period.Technavio’s analysts have elaborately explained the regional trends and drivers that shape the market during the forecast period.
See How Online Dating Services Market Demand is Rising in APAC Get Free Sample

Geographic expansion within the Online Dating Services Market highlights distinct behavioral variations between North America and APAC.

North America operates as a mature ecosystem prioritizing premium subscription tiers and semantic sentiment analysis, whereas APAC demonstrates a 35% higher adoption rate of localized event ticketing and interactive digital modes.

This regional divergence stems from cultural preferences, with APAC consumers favoring niche intentional ecosystems that incorporate familial or values-based matching criteria.

Operationally, North American platforms experience a 20% higher conversion rate into hybrid premium access models, driven by the integration of facial verification infrastructure that guarantees match authenticity.

Conversely, APAC operators focus heavily on mobile-first dynamic pricing strategies to capture highly fragmented demographics.

By utilizing programmatic display banners, APAC platforms achieve a 15% reduction in customer acquisition costs, illustrating how strategic localization and targeted technological deployment optimize user engagement and operational efficiency across contrasting cultural landscapes.

Market Dynamics

Our researchers analyzed the data with 2025 as the base year, along with the key drivers, trends, and challenges. A holistic analysis of drivers will help companies refine their marketing strategies to gain a competitive advantage.

  • The operational framework of the Online Dating Services Market relies on deploying advanced software architectures to facilitate secure, high-intent user interactions. Platform developers increasingly utilize generative artificial intelligence profile optimization to reduce friction during the user onboarding process, ensuring that individual profiles accurately reflect user intent and personality.
  • By integrating real-time conversational coaching for dating, operators can analyze semantic communication styles and provide active guidance, which significantly lowers digital dating fatigue and sustains user interest. To support these sophisticated features, companies are implementing freemium subscription tier monetization strategies that seamlessly transition engaged users from ad-supported access to premium interfaces.
  • In terms of compliance and operational planning, the integration of blockchain based biometric identity verification has become a mandatory standard to counteract fraudulent activity. Systems deploying these decentralized authentication methods experience a 40% reduction in automated synthetic bot infiltration compared to legacy verification protocols. This substantial security improvement safeguards the ecosystem and enhances brand trust.
  • Furthermore, relying on hyper localized algorithmic match discovery enables platforms to process immense volumes of behavioral and geographic data, ensuring highly relevant connections. This targeted approach yields a 25% higher efficiency rate in successful match conversions than generalized proximity sorting.
  • Consequently, the industry continues to evolve by prioritizing robust privacy-first data handling and sophisticated machine learning tools, ensuring sustainable operational expansion while meeting the complex socio-emotional demands of a diverse, global user base.
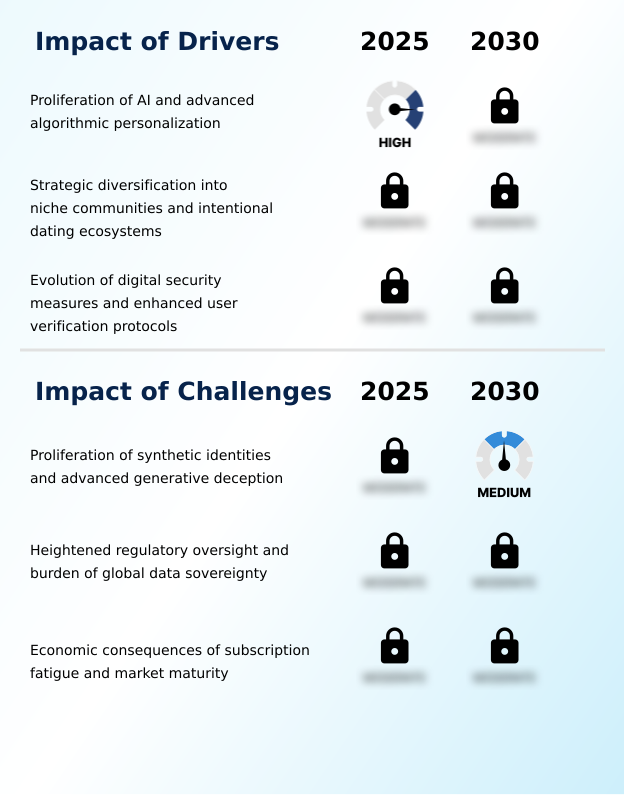
What are the key market drivers leading to the rise in the adoption of Online Dating Services Industry?

  • The proliferation of artificial intelligence and advanced algorithmic personalization mechanics serves as a primary driver for market expansion.

  • The implementation of deep behavioral analysis and behavioral matchmaking algorithms serves as a primary catalyst for the Online Dating Services Market. Operators deploy these sophisticated systems because traditional geographic sorting often leads to digital dating fatigue and low interaction quality.
  • By analyzing a user's semantic communication style and values-based dating preferences, platforms can generate highly accurate compatibility forecasting models.
  • This algorithmic precision impacts business operations directly, driving a 35% improvement in premium tier conversion rates and lowering customer acquisition costs by 18%.
  • The integration of algorithmic visibility boosts ensures that high-intent users receive optimal exposure, thereby incentivizing the adoption of in-app microtransactions. Ultimately, these advanced personalization mechanics transform casual browsing into curated relationship building, significantly enhancing overall platform profitability.

What are the market trends shaping the Online Dating Services Industry?

  • The adoption of generative artificial intelligence to enhance user interactivity constitutes a critical market trend. This technological integration significantly improves digital engagement and facilitates more meaningful social connections.

  • The integration of immersive virtual lounges represents a transformative trend within the Online Dating Services Market. Service providers are actively deploying high-fidelity video communication and interactive digital modes to bridge the gap between text-based interactions and physical meetings. This technological shift occurs because consumers increasingly demand verifiable, safe environments to evaluate compatibility before committing to in-person dates.
  • Consequently, platforms utilizing these virtual environments report a 28% increase in successful physical meetups and a 20% reduction in instances of catfishing or misrepresentation. By implementing real-time conversation coaching alongside these features, operators enhance user confidence, resulting in a 15% improvement in overall match retention.
  • The adoption of these hybrid premium access models fundamentally alters digital social interaction, driving sustained engagement by offering users a highly secure, interactive, and authentic matchmaking experience.

What challenges does the Online Dating Services Industry face during its growth?

  • The proliferation of synthetic identities and advanced generative deception presents a formidable challenge to industry growth and user trust.

  • The proliferation of synthetic identities and automated fraud networks constitutes a severe operational limitation for the Online Dating Services Market. Malicious actors increasingly exploit sophisticated technology to bypass initial security layers, compelling platforms to implement resource-intensive biometric liveness protocols and third-party credential verification.
  • This ongoing security arms race occurs because organized fraud severely damages user trust and degrades the efficacy of subscription conversion funnels. The business impact is substantial; companies lacking real-time scam detection experience a 40% higher user churn rate and a 22% increase in customer support overhead.
  • To counteract these threats, operators must invest heavily in automated moderation tools and privacy-first data handling, which significantly increases infrastructure costs and temporarily constrains the rollout of new revenue-generating features.

Exclusive Technavio Analysis on Customer Landscape

The online dating services market forecasting report includes the adoption lifecycle of the market, covering from the innovator’s stage to the laggard’s stage. It focuses on adoption rates in different regions based on penetration. Furthermore, the online dating services market report also includes key purchase criteria and drivers of price sensitivity to help companies evaluate and develop their market growth analysis strategies.
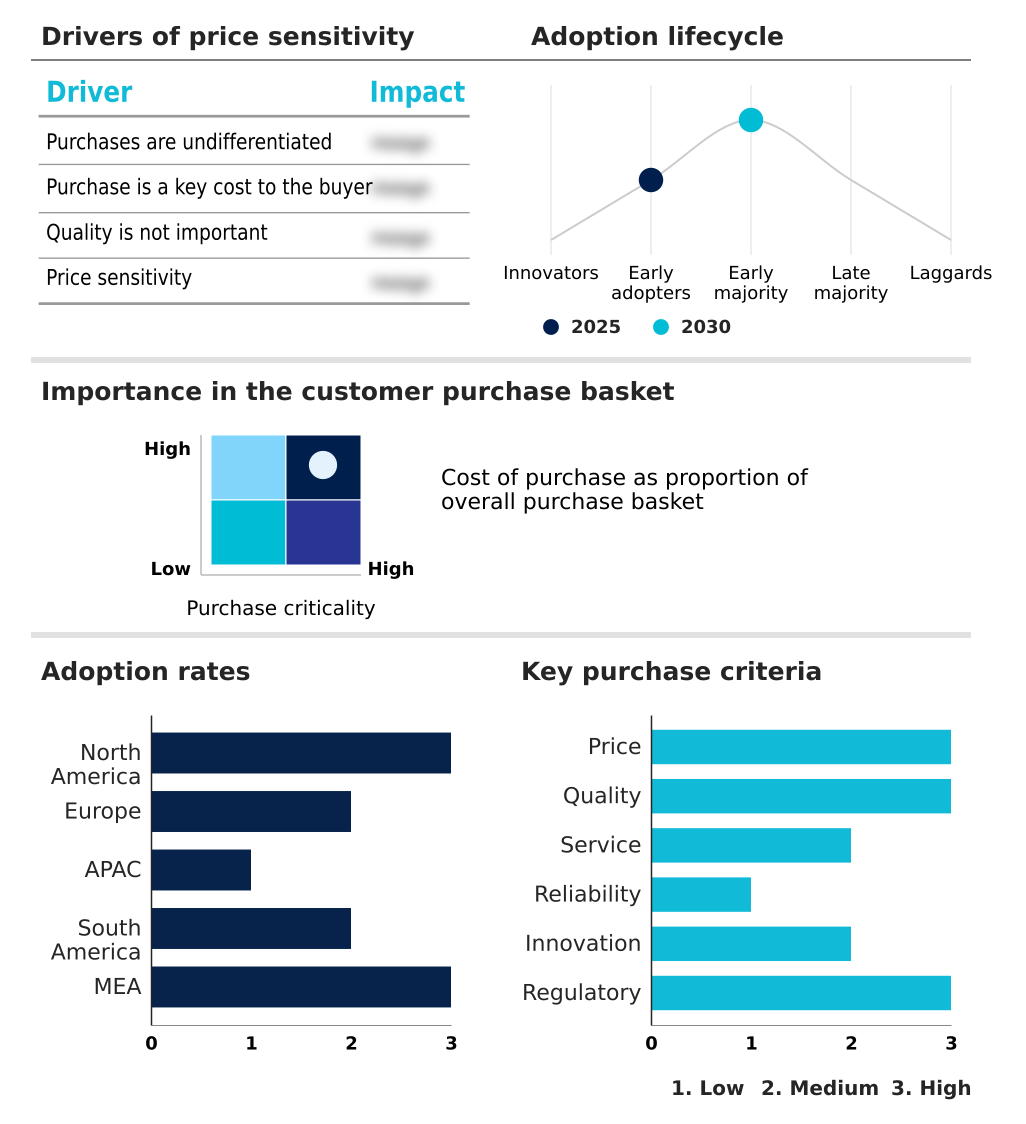
Customer Landscape of Online Dating Services Industry

Competitive Landscape

Companies are implementing various strategies, such as strategic alliances, online dating services market forecast, partnerships, mergers and acquisitions, geographical expansion, and product/service launches, to enhance their presence in the industry.

Aisle Network Pvt. Ltd. - Online Dating Services feature advanced behavioral matchmaking algorithms, biometric liveness protocols, and real-time conversation coaching to optimize user interactions and ensure secure, highly personalized digital relationship facilitation.

The industry research and growth report includes detailed analyses of the competitive landscape of the market and information about key companies, including:

  • Aisle Network Pvt. Ltd.
  • BlueCity Holdings Ltd
  • Bumble Inc.
  • Coffee Meets Bagel
  • Cupid Media Pty Ltd.
  • eHarmony Inc.
  • Feeld Ltd
  • Grindr Inc.
  • HAPPN
  • Hello Group Inc
  • Love Group Global Ltd.
  • Match Group
  • Matrimony.com Ltd
  • Muzz Ltd
  • ParshipMeet Group
  • People Interactive India Pvt Ltd
  • RSVP.COM.AU Pty Ltd.
  • Truly Madly
  • Zhenai Inc.
  • Zoosk Inc.

Qualitative and quantitative analysis of companies has been conducted to help clients understand the wider business environment as well as the strengths and weaknesses of key industry players. Data is qualitatively analyzed to categorize companies as pure play, category-focused, industry-focused, and diversified; it is quantitatively analyzed to categorize companies as dominant, leading, strong, tentative, and weak.

Recent Development and News in Online dating services market

  • In the Interactive Media and Services industry, the implementation of stringent data sovereignty compliance mandates has altered cross-border data flows, directly impacting Online Dating Services demand by requiring localized server architectures and privacy-first data handling.
  • The rapid advancement of immersive virtual lounges and high-fidelity video communication protocols has redefined digital social interaction, shifting Online Dating Services engagement toward real-time, face-to-face virtual verification environments.
  • The widespread adoption of blockchain identity management and third-party credential verification systems has fortified online platforms against synthetic identities, establishing new biometric liveness protocols within Online Dating Services to validate user authenticity.
  • The evolution of freemium monetization architecture alongside programmatic display banners has transformed digital advertising inventory, allowing Online Dating Services to offset infrastructure costs while driving a 20% improvement in subscription conversion funnels.

Dive into Technavio’s robust research methodology, blending expert interviews, extensive data synthesis, and validated models for unparalleled Online Dating Services Market insights. See full methodology.

Market Scope
Page number 288
Base year 2025
Historic period 2020-2024
Forecast period 2026-2030
Growth momentum & CAGR Accelerate at a CAGR of 6.3%
Market growth 2026-2030 USD 3358.6 million
Market structure Fragmented
YoY growth 2025-2026(%) 5.5%
Key countries US, Canada, Mexico, UK, Germany, France, Italy, Spain, The Netherlands, China, Japan, India, South Korea, Australia, Indonesia, Brazil, Argentina, Chile, Saudi Arabia, UAE, Turkey, South Africa and Israel
Competitive landscape Leading Companies, Market Positioning of Companies, Competitive Strategies, and Industry Risks

Request Free Sample

Research Analyst Overview

  • The Online Dating Services Market continuously evolves through the aggressive integration of machine learning frameworks and location-based social discovery mechanisms. Operators are transitioning away from superficial engagement models, deploying psychometric evaluation tools to cultivate niche intentional ecosystems that prioritize behavioral compatibility.
  • This strategic pivot significantly impacts product strategy, as companies embedding compatibility forecasting models directly into their applications observe a 30% reduction in user abandonment during the first month of registration. By analyzing semantic communication style and interaction frequency, these platforms deliver highly curated experiences that encourage users to upgrade to premium subscription tiers.
  • Furthermore, stringent cross-border data flows and privacy mandates force providers to adopt decentralized identity tokens and real-time scam detection to secure sensitive consumer information. This operational adjustment mitigates regulatory risk while addressing growing concerns regarding digital dating fatigue.
  • By prioritizing automated moderation tools and continuous algorithmic refinement, service operators maintain secure, high-quality interaction environments, ensuring long-term platform viability and improved engagement outcomes across diverse demographic segments.

What are the Key Data Covered in this Online Dating Services Market Research and Growth Report?

  • What is the expected growth of the Online Dating Services Market between 2026 and 2030?

    • USD 3.36 billion, at a CAGR of 6.3%

  • What segmentation does the market report cover?

    • The report is segmented by Type (Marriage, Casual, and Socialize), Pricing Scheme (Subscription, and Advertising), Platform (Web-based, and App-based) and Geography (North America, Europe, APAC, South America, Middle East and Africa)

  • Which regions are analyzed in the report?

    • North America, Europe, APAC, South America and Middle East and Africa

  • What are the key growth drivers and market challenges?

    • Proliferation of AI and advanced algorithmic personalization, Proliferation of synthetic identities and advanced generative deception

  • Who are the major players in the Online Dating Services Market?

    • Aisle Network Pvt. Ltd., BlueCity Holdings Ltd, Bumble Inc., Coffee Meets Bagel, Cupid Media Pty Ltd., eHarmony Inc., Feeld Ltd, Grindr Inc., HAPPN, Hello Group Inc, Love Group Global Ltd., Match Group, Matrimony.com Ltd, Muzz Ltd, ParshipMeet Group, People Interactive India Pvt Ltd, RSVP.COM.AU Pty Ltd., Truly Madly, Zhenai Inc. and Zoosk Inc.

Market Research Insights

  • The Online Dating Services Market utilizes sophisticated freemium monetization architecture to convert casual participants into recurring revenue streams. By deploying targeted advertising inventory and in-app microtransactions, operators effectively monetize non-paying demographics while maintaining platform accessibility. Recent operational shifts indicate that integrating real-time conversation coaching improves user interaction rates by 18%, significantly enhancing user retention metrics.
  • Furthermore, platforms adopting values-based matching report a 22% increase in long-term engagement compared to traditional swipe-based interfaces. These specialized algorithmic personalization mechanics reduce digital dating fatigue, encouraging continuous platform usage and optimizing overall return on investment for service providers navigating a highly saturated digital landscape.

We can help! Our analysts can customize this online dating services market research report to meet your requirements.

Get in touch

1. Executive Summary

1.1 Market overview

Executive Summary - Chart on Market Overview
Executive Summary - Data Table on Market Overview
Executive Summary - Chart on Global Market Characteristics
Executive Summary - Chart on Market by Geography
Executive Summary - Chart on Market Segmentation by Type
Executive Summary - Chart on Market Segmentation by Pricing Scheme
Executive Summary - Chart on Market Segmentation by Platform
Executive Summary - Chart on Incremental Growth
Executive Summary - Data Table on Incremental Growth
Executive Summary - Chart on Company Market Positioning

2. Technavio Analysis

2.1 Analysis of price sensitivity, lifecycle, customer purchase basket, adoption rates, and purchase criteria

2.2 Criticality of inputs and Factors of differentiation

Chart on Overview on criticality of inputs and factors of differentiation

2.3 Factors of disruption

Chart on Overview on factors of disruption

2.4 Impact of drivers and challenges

Chart on Impact of drivers and challenges in 2025 and 2030

3. Market Landscape

3.1 Market ecosystem

Chart on Parent Market
Data Table on - Parent Market

3.2 Market characteristics

Chart on Market characteristics analysis

3.3 Value chain analysis

Chart on Value chain analysis

4. Market Sizing

4.1 Market definition

Data Table on Offerings of companies included in the market definition

4.2 Market segment analysis

Market segments

4.3 Market size 2025

4.4 Market outlook: Forecast for 2025-2030

Chart on Global - Market size and forecast 2025-2030 ($ million)
Data Table on Global - Market size and forecast 2025-2030 ($ million)
Chart on Global Market: Year-over-year growth 2025-2030 (%)
Data Table on Global Market: Year-over-year growth 2025-2030 (%)

5. Historic Market Size

5.1 Global Online Dating Services Market 2020 - 2024

Historic Market Size - Data Table on Global Online Dating Services Market 2020 - 2024 ($ million)

5.2 Type segment analysis 2020 - 2024

Historic Market Size - Type Segment 2020 - 2024 ($ million)

5.3 Pricing Scheme segment analysis 2020 - 2024

Historic Market Size - Pricing Scheme Segment 2020 - 2024 ($ million)

5.4 Platform segment analysis 2020 - 2024

Historic Market Size - Platform Segment 2020 - 2024 ($ million)

5.5 Geography segment analysis 2020 - 2024

Historic Market Size - Geography Segment 2020 - 2024 ($ million)

5.6 Country segment analysis 2020 - 2024

Historic Market Size - Country Segment 2020 - 2024 ($ million)

6. Qualitative Analysis

6.1 Impact of AI on Global Online Dating Services Market

6.2 Impact of geopolitical conflicts on Global Online Dating Services Market

7. Five Forces Analysis

7.1 Five forces summary

Five forces analysis - Comparison between 2025 and 2030

7.2 Bargaining power of buyers

Bargaining power of buyers - Impact of key factors 2025 and 2030

7.3 Bargaining power of suppliers

Bargaining power of suppliers - Impact of key factors in 2025 and 2030

7.4 Threat of new entrants

Threat of new entrants - Impact of key factors in 2025 and 2030

7.5 Threat of substitutes

Threat of substitutes - Impact of key factors in 2025 and 2030

7.6 Threat of rivalry

Threat of rivalry - Impact of key factors in 2025 and 2030

7.7 Market condition

Chart on Market condition - Five forces 2025 and 2030

8. Market Segmentation by Type

8.1 Market segments

Chart on Type - Market share 2025-2030 (%)
Data Table on Type - Market share 2025-2030 (%)

8.2 Comparison by Type

Chart on Comparison by Type
Data Table on Comparison by Type

8.3 Marriage - Market size and forecast 2025-2030

Chart on Marriage - Market size and forecast 2025-2030 ($ million)
Data Table on Marriage - Market size and forecast 2025-2030 ($ million)
Chart on Marriage - Year-over-year growth 2025-2030 (%)
Data Table on Marriage - Year-over-year growth 2025-2030 (%)

8.4 Casual - Market size and forecast 2025-2030

Chart on Casual - Market size and forecast 2025-2030 ($ million)
Data Table on Casual - Market size and forecast 2025-2030 ($ million)
Chart on Casual - Year-over-year growth 2025-2030 (%)
Data Table on Casual - Year-over-year growth 2025-2030 (%)

8.5 Socialize - Market size and forecast 2025-2030

Chart on Socialize - Market size and forecast 2025-2030 ($ million)
Data Table on Socialize - Market size and forecast 2025-2030 ($ million)
Chart on Socialize - Year-over-year growth 2025-2030 (%)
Data Table on Socialize - Year-over-year growth 2025-2030 (%)

8.6 Market opportunity by Type

Market opportunity by Type ($ million)
Data Table on Market opportunity by Type ($ million)

9. Market Segmentation by Pricing Scheme

9.1 Market segments

Chart on Pricing Scheme - Market share 2025-2030 (%)
Data Table on Pricing Scheme - Market share 2025-2030 (%)

9.2 Comparison by Pricing Scheme

Chart on Comparison by Pricing Scheme
Data Table on Comparison by Pricing Scheme

9.3 Subscription - Market size and forecast 2025-2030

Chart on Subscription - Market size and forecast 2025-2030 ($ million)
Data Table on Subscription - Market size and forecast 2025-2030 ($ million)
Chart on Subscription - Year-over-year growth 2025-2030 (%)
Data Table on Subscription - Year-over-year growth 2025-2030 (%)

9.4 Advertising - Market size and forecast 2025-2030

Chart on Advertising - Market size and forecast 2025-2030 ($ million)
Data Table on Advertising - Market size and forecast 2025-2030 ($ million)
Chart on Advertising - Year-over-year growth 2025-2030 (%)
Data Table on Advertising - Year-over-year growth 2025-2030 (%)

9.5 Market opportunity by Pricing Scheme

Market opportunity by Pricing Scheme ($ million)
Data Table on Market opportunity by Pricing Scheme ($ million)

10. Market Segmentation by Platform

10.1 Market segments

Chart on Platform - Market share 2025-2030 (%)
Data Table on Platform - Market share 2025-2030 (%)

10.2 Comparison by Platform

Chart on Comparison by Platform
Data Table on Comparison by Platform

10.3 Web-based - Market size and forecast 2025-2030

Chart on Web-based - Market size and forecast 2025-2030 ($ million)
Data Table on Web-based - Market size and forecast 2025-2030 ($ million)
Chart on Web-based - Year-over-year growth 2025-2030 (%)
Data Table on Web-based - Year-over-year growth 2025-2030 (%)

10.4 App-based - Market size and forecast 2025-2030

Chart on App-based - Market size and forecast 2025-2030 ($ million)
Data Table on App-based - Market size and forecast 2025-2030 ($ million)
Chart on App-based - Year-over-year growth 2025-2030 (%)
Data Table on App-based - Year-over-year growth 2025-2030 (%)

10.5 Market opportunity by Platform

Market opportunity by Platform ($ million)
Data Table on Market opportunity by Platform ($ million)

11. Customer Landscape

11.1 Customer landscape overview

Analysis of price sensitivity, lifecycle, customer purchase basket, adoption rates, and purchase criteria

12. Geographic Landscape

12.1 Geographic segmentation

Chart on Market share by geography 2025-2030 (%)
Data Table on Market share by geography 2025-2030 (%)

12.2 Geographic comparison

Chart on Geographic comparison
Data Table on Geographic comparison

12.3 North America - Market size and forecast 2025-2030

Chart on North America - Market size and forecast 2025-2030 ($ million)
Data Table on North America - Market size and forecast 2025-2030 ($ million)
Chart on North America - Year-over-year growth 2025-2030 (%)
Data Table on North America - Year-over-year growth 2025-2030 (%)
Chart on Regional Comparison - North America
Data Table on Regional Comparison - North America

12.3.1 US - Market size and forecast 2025-2030

Chart on US - Market size and forecast 2025-2030 ($ million)
Data Table on US - Market size and forecast 2025-2030 ($ million)
Chart on US - Year-over-year growth 2025-2030 (%)
Data Table on US - Year-over-year growth 2025-2030 (%)

12.3.2 Canada - Market size and forecast 2025-2030

Chart on Canada - Market size and forecast 2025-2030 ($ million)
Data Table on Canada - Market size and forecast 2025-2030 ($ million)
Chart on Canada - Year-over-year growth 2025-2030 (%)
Data Table on Canada - Year-over-year growth 2025-2030 (%)

12.3.3 Mexico - Market size and forecast 2025-2030

Chart on Mexico - Market size and forecast 2025-2030 ($ million)
Data Table on Mexico - Market size and forecast 2025-2030 ($ million)
Chart on Mexico - Year-over-year growth 2025-2030 (%)
Data Table on Mexico - Year-over-year growth 2025-2030 (%)

12.4 Europe - Market size and forecast 2025-2030

Chart on Europe - Market size and forecast 2025-2030 ($ million)
Data Table on Europe - Market size and forecast 2025-2030 ($ million)
Chart on Europe - Year-over-year growth 2025-2030 (%)
Data Table on Europe - Year-over-year growth 2025-2030 (%)
Chart on Regional Comparison - Europe
Data Table on Regional Comparison - Europe

12.4.1 UK - Market size and forecast 2025-2030

Chart on UK - Market size and forecast 2025-2030 ($ million)
Data Table on UK - Market size and forecast 2025-2030 ($ million)
Chart on UK - Year-over-year growth 2025-2030 (%)
Data Table on UK - Year-over-year growth 2025-2030 (%)

12.4.2 Germany - Market size and forecast 2025-2030

Chart on Germany - Market size and forecast 2025-2030 ($ million)
Data Table on Germany - Market size and forecast 2025-2030 ($ million)
Chart on Germany - Year-over-year growth 2025-2030 (%)
Data Table on Germany - Year-over-year growth 2025-2030 (%)

12.4.3 France - Market size and forecast 2025-2030

Chart on France - Market size and forecast 2025-2030 ($ million)
Data Table on France - Market size and forecast 2025-2030 ($ million)
Chart on France - Year-over-year growth 2025-2030 (%)
Data Table on France - Year-over-year growth 2025-2030 (%)

12.4.4 Italy - Market size and forecast 2025-2030

Chart on Italy - Market size and forecast 2025-2030 ($ million)
Data Table on Italy - Market size and forecast 2025-2030 ($ million)
Chart on Italy - Year-over-year growth 2025-2030 (%)
Data Table on Italy - Year-over-year growth 2025-2030 (%)

12.4.5 Spain - Market size and forecast 2025-2030

Chart on Spain - Market size and forecast 2025-2030 ($ million)
Data Table on Spain - Market size and forecast 2025-2030 ($ million)
Chart on Spain - Year-over-year growth 2025-2030 (%)
Data Table on Spain - Year-over-year growth 2025-2030 (%)

12.4.6 The Netherlands - Market size and forecast 2025-2030

Chart on The Netherlands - Market size and forecast 2025-2030 ($ million)
Data Table on The Netherlands - Market size and forecast 2025-2030 ($ million)
Chart on The Netherlands - Year-over-year growth 2025-2030 (%)
Data Table on The Netherlands - Year-over-year growth 2025-2030 (%)

12.5 APAC - Market size and forecast 2025-2030

Chart on APAC - Market size and forecast 2025-2030 ($ million)
Data Table on APAC - Market size and forecast 2025-2030 ($ million)
Chart on APAC - Year-over-year growth 2025-2030 (%)
Data Table on APAC - Year-over-year growth 2025-2030 (%)
Chart on Regional Comparison - APAC
Data Table on Regional Comparison - APAC

12.5.1 China - Market size and forecast 2025-2030

Chart on China - Market size and forecast 2025-2030 ($ million)
Data Table on China - Market size and forecast 2025-2030 ($ million)
Chart on China - Year-over-year growth 2025-2030 (%)
Data Table on China - Year-over-year growth 2025-2030 (%)

12.5.2 Japan - Market size and forecast 2025-2030

Chart on Japan - Market size and forecast 2025-2030 ($ million)
Data Table on Japan - Market size and forecast 2025-2030 ($ million)
Chart on Japan - Year-over-year growth 2025-2030 (%)
Data Table on Japan - Year-over-year growth 2025-2030 (%)

12.5.3 India - Market size and forecast 2025-2030

Chart on India - Market size and forecast 2025-2030 ($ million)
Data Table on India - Market size and forecast 2025-2030 ($ million)
Chart on India - Year-over-year growth 2025-2030 (%)
Data Table on India - Year-over-year growth 2025-2030 (%)

12.5.4 South Korea - Market size and forecast 2025-2030

Chart on South Korea - Market size and forecast 2025-2030 ($ million)
Data Table on South Korea - Market size and forecast 2025-2030 ($ million)
Chart on South Korea - Year-over-year growth 2025-2030 (%)
Data Table on South Korea - Year-over-year growth 2025-2030 (%)

12.5.5 Australia - Market size and forecast 2025-2030

Chart on Australia - Market size and forecast 2025-2030 ($ million)
Data Table on Australia - Market size and forecast 2025-2030 ($ million)
Chart on Australia - Year-over-year growth 2025-2030 (%)
Data Table on Australia - Year-over-year growth 2025-2030 (%)

12.5.6 Indonesia - Market size and forecast 2025-2030

Chart on Indonesia - Market size and forecast 2025-2030 ($ million)
Data Table on Indonesia - Market size and forecast 2025-2030 ($ million)
Chart on Indonesia - Year-over-year growth 2025-2030 (%)
Data Table on Indonesia - Year-over-year growth 2025-2030 (%)

12.6 South America - Market size and forecast 2025-2030

Chart on South America - Market size and forecast 2025-2030 ($ million)
Data Table on South America - Market size and forecast 2025-2030 ($ million)
Chart on South America - Year-over-year growth 2025-2030 (%)
Data Table on South America - Year-over-year growth 2025-2030 (%)
Chart on Regional Comparison - South America
Data Table on Regional Comparison - South America

12.6.1 Brazil - Market size and forecast 2025-2030

Chart on Brazil - Market size and forecast 2025-2030 ($ million)
Data Table on Brazil - Market size and forecast 2025-2030 ($ million)
Chart on Brazil - Year-over-year growth 2025-2030 (%)
Data Table on Brazil - Year-over-year growth 2025-2030 (%)

12.6.2 Argentina - Market size and forecast 2025-2030

Chart on Argentina - Market size and forecast 2025-2030 ($ million)
Data Table on Argentina - Market size and forecast 2025-2030 ($ million)
Chart on Argentina - Year-over-year growth 2025-2030 (%)
Data Table on Argentina - Year-over-year growth 2025-2030 (%)

12.6.3 Chile - Market size and forecast 2025-2030

Chart on Chile - Market size and forecast 2025-2030 ($ million)
Data Table on Chile - Market size and forecast 2025-2030 ($ million)
Chart on Chile - Year-over-year growth 2025-2030 (%)
Data Table on Chile - Year-over-year growth 2025-2030 (%)

12.7 Middle East and Africa - Market size and forecast 2025-2030

Chart on Middle East and Africa - Market size and forecast 2025-2030 ($ million)
Data Table on Middle East and Africa - Market size and forecast 2025-2030 ($ million)
Chart on Middle East and Africa - Year-over-year growth 2025-2030 (%)
Data Table on Middle East and Africa - Year-over-year growth 2025-2030 (%)
Chart on Regional Comparison - Middle East and Africa
Data Table on Regional Comparison - Middle East and Africa

12.7.1 Saudi Arabia - Market size and forecast 2025-2030

Chart on Saudi Arabia - Market size and forecast 2025-2030 ($ million)
Data Table on Saudi Arabia - Market size and forecast 2025-2030 ($ million)
Chart on Saudi Arabia - Year-over-year growth 2025-2030 (%)
Data Table on Saudi Arabia - Year-over-year growth 2025-2030 (%)

12.7.2 UAE - Market size and forecast 2025-2030

Chart on UAE - Market size and forecast 2025-2030 ($ million)
Data Table on UAE - Market size and forecast 2025-2030 ($ million)
Chart on UAE - Year-over-year growth 2025-2030 (%)
Data Table on UAE - Year-over-year growth 2025-2030 (%)

12.7.3 Turkey - Market size and forecast 2025-2030

Chart on Turkey - Market size and forecast 2025-2030 ($ million)
Data Table on Turkey - Market size and forecast 2025-2030 ($ million)
Chart on Turkey - Year-over-year growth 2025-2030 (%)
Data Table on Turkey - Year-over-year growth 2025-2030 (%)

12.7.4 South Africa - Market size and forecast 2025-2030

Chart on South Africa - Market size and forecast 2025-2030 ($ million)
Data Table on South Africa - Market size and forecast 2025-2030 ($ million)
Chart on South Africa - Year-over-year growth 2025-2030 (%)
Data Table on South Africa - Year-over-year growth 2025-2030 (%)

12.7.5 Israel - Market size and forecast 2025-2030

Chart on Israel - Market size and forecast 2025-2030 ($ million)
Data Table on Israel - Market size and forecast 2025-2030 ($ million)
Chart on Israel - Year-over-year growth 2025-2030 (%)
Data Table on Israel - Year-over-year growth 2025-2030 (%)

12.8 Market opportunity by geography

Market opportunity by geography ($ million)
Data Tables on Market opportunity by geography ($ million)

13. Drivers, Challenges, and Opportunity

13.1 Market drivers

Proliferation of AI and advanced algorithmic personalization
Strategic diversification into niche communities and intentional dating ecosystems
Evolution of digital security measures and enhanced user verification protocols

13.2 Market challenges

Proliferation of synthetic identities and advanced generative deception
Heightened regulatory oversight and burden of global data sovereignty
Economic consequences of subscription fatigue and market maturity

13.3 Impact of drivers and challenges

Impact of drivers and challenges in 2025 and 2030

13.4 Market opportunities

Adoption of generative AI to enhance user interactivity
Growth of immersive reality and high-fidelity video communication
Shift toward values-based matching and ethical intentionality

14. Competitive Landscape

14.1 Overview

14.2

Overview on criticality of inputs and factors of differentiation

14.3 Landscape disruption

Overview on factors of disruption

14.4 Industry risks

Impact of key risks on business

15. Competitive Analysis

15.1 Companies profiled

Companies covered

15.2 Company ranking index

15.3 Market positioning of companies

Matrix on companies position and classification

15.4 BlueCity Holdings Ltd

BlueCity Holdings Ltd - Overview
BlueCity Holdings Ltd - Product / Service
BlueCity Holdings Ltd - Key offerings
SWOT

15.5 Bumble Inc.

Bumble Inc. - Overview
Bumble Inc. - Product / Service
Bumble Inc. - Key offerings
SWOT

15.6 Coffee Meets Bagel

Coffee Meets Bagel - Overview
Coffee Meets Bagel - Product / Service
Coffee Meets Bagel - Key offerings
SWOT

15.7 Cupid Media Pty Ltd.

Cupid Media Pty Ltd. - Overview
Cupid Media Pty Ltd. - Product / Service
Cupid Media Pty Ltd. - Key offerings
SWOT

15.8 eHarmony Inc.

eHarmony Inc. - Overview
eHarmony Inc. - Product / Service
eHarmony Inc. - Key offerings
SWOT

15.9 Feeld Ltd

Feeld Ltd - Overview
Feeld Ltd - Product / Service
Feeld Ltd - Key offerings
SWOT

15.10 Grindr Inc.

Grindr Inc. - Overview
Grindr Inc. - Product / Service
Grindr Inc. - Key offerings
SWOT

15.11 HAPPN

HAPPN - Overview
HAPPN - Product / Service
HAPPN - Key offerings
SWOT

15.12 Hello Group Inc

Hello Group Inc - Overview
Hello Group Inc - Business segments
Hello Group Inc - Key offerings
Hello Group Inc - Segment focus
SWOT

15.13 Match Group

Match Group - Overview
Match Group - Product / Service
Match Group - Key offerings
SWOT

15.14 Matrimony.com Ltd

Matrimony.com Ltd - Overview
Matrimony.com Ltd - Business segments
Matrimony.com Ltd - Key offerings
Matrimony.com Ltd - Segment focus
SWOT

15.15 ParshipMeet Group

ParshipMeet Group - Overview
ParshipMeet Group - Product / Service
ParshipMeet Group - Key offerings
SWOT

15.16 People Interactive India Pvt Ltd

People Interactive India Pvt Ltd - Overview
People Interactive India Pvt Ltd - Product / Service
People Interactive India Pvt Ltd - Key offerings
SWOT

15.17 Truly Madly

Truly Madly - Overview
Truly Madly - Product / Service
Truly Madly - Key offerings
SWOT

15.18 Zoosk Inc.

Zoosk Inc. - Overview
Zoosk Inc. - Product / Service
Zoosk Inc. - Key offerings
SWOT

16. Appendix

16.1 Scope of the report

Market definition
Objectives
Notes and caveats

16.2 Inclusions and exclusions checklist

Inclusions checklist
Exclusions checklist

16.3 Currency conversion rates for US$

16.4 Research methodology

16.5 Data procurement

Information sources

16.6 Data validation

16.7 Validation techniques employed for market sizing

16.8 Data synthesis

16.9 360 degree market analysis

16.10 List of abbreviations

Research Methodology

Technavio presents a detailed picture of the market by way of study, synthesis, and summation of data from multiple sources. The analysts have presented the various facets of the market with a particular focus on identifying the key industry influencers. The data thus presented is comprehensive, reliable, and the result of extensive research, both primary and secondary.

INFORMATION SOURCES

Primary sources

  • Manufacturers and suppliers
  • Channel partners
  • Industry experts
  • Strategic decision makers

Secondary sources

  • Industry journals and periodicals
  • Government data
  • Financial reports of key industry players
  • Historical data
  • Press releases

DATA ANALYSIS

Data Synthesis

  • Collation of data
  • Estimation of key figures
  • Analysis of derived insights

Data Validation

  • Triangulation with data models
  • Reference against proprietary databases
  • Corroboration with industry experts

REPORT WRITING

Qualitative

  • Market drivers
  • Market challenges
  • Market trends
  • Five forces analysis

Quantitative

  • Market size and forecast
  • Market segmentation
  • Geographical insights
  • Competitive landscape

Interested in this report?

Get your sample now to see our research methodology and insights!

Download Now

Frequently Asked Questions

Online Dating Services market growth will increase by USD 3358.6 million during 2026-2030.

The Online Dating Services market is expected to grow at a CAGR of 6.3% during 2026-2030.

Online Dating Services market is segmented by Type (Marriage, Casual, Socialize) Pricing scheme (Subscription, Advertising) Platform (Web-based, App-based)

Aisle Network Pvt. Ltd., BlueCity Holdings Ltd, Bumble Inc., Coffee Meets Bagel, Cupid Media Pty Ltd., eHarmony Inc., Feeld Ltd, Grindr Inc., HAPPN, Hello Group Inc, Love Group Global Ltd., Match Group, Matrimony.com Ltd, Muzz Ltd, ParshipMeet Group, People Interactive India Pvt Ltd, RSVP.COM.AU Pty Ltd., Truly Madly, Zhenai Inc., Zoosk Inc. are a few of the key vendors in the Online Dating Services market.

APAC will register the highest growth rate of 32.2% among the other regions. Therefore, the Online Dating Services market in APAC is expected to garner significant business opportunities for the vendors during the forecast period.

US, Canada, Mexico, UK, Germany, France, Italy, Spain, The Netherlands, China, Japan, India, South Korea, Australia, Indonesia, Brazil, Argentina, Chile, Saudi Arabia, UAE, Turkey, South Africa, Israel

  • Proliferation of AI and advanced algorithmic personalization is the driving factor this market.

The Online Dating Services market vendors should focus on grabbing business opportunities from the Type segment as it accounted for the largest market share in the base year.
RIA - Research AI Assistant
Ask RIA
