Overhead Cables Market Analysis, Size, and Forecast 2026-2030: APAC (China, India, and Japan), Europe (Germany, France, and UK), North America (US, Canada, and Mexico), South America (Brazil and Argentina), Middle East and Africa (Saudi Arabia, UAE, and South Africa), and Rest of World (ROW)

Overhead Cables Market Analysis, Size, and Forecast 2026-2030:
APAC (China, India, and Japan), Europe (Germany, France, and UK), North America (US, Canada, and Mexico), South America (Brazil and Argentina), Middle East and Africa (Saudi Arabia, UAE, and South Africa), and Rest of World (ROW)

Published: Dec 2025 311 Pages SKU: IRTNTR45258

Market Overview at a Glance

$20.59 B
Market Opportunity
5.4%
CAGR 2025 - 2030
31.6%
APAC Growth
$25.77 B
High voltage segment 2024

Overhead Cables Market Size 2026-2030

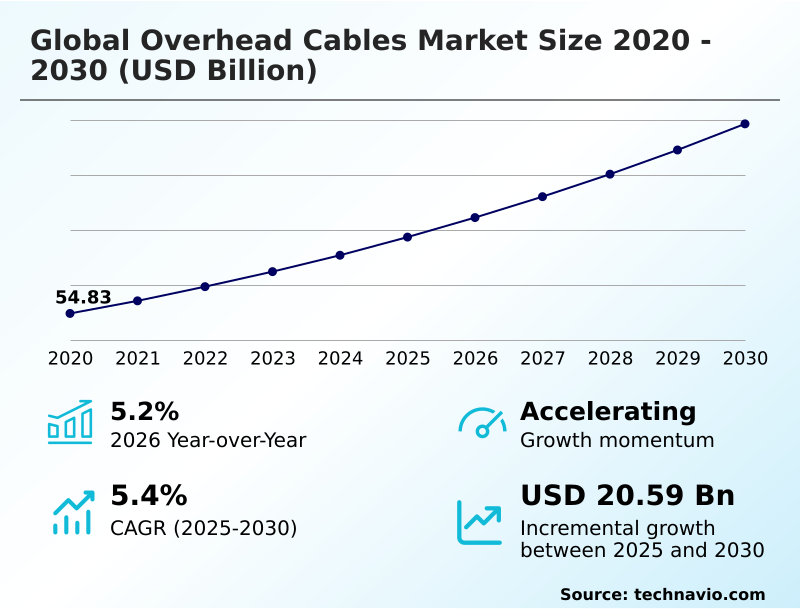
The overhead cables market size is valued to increase by USD 20.59 billion, at a CAGR of 5.4% from 2025 to 2030. Expansion and modernization of transmission and distribution grids will drive the overhead cables market.

Major Market Trends & Insights

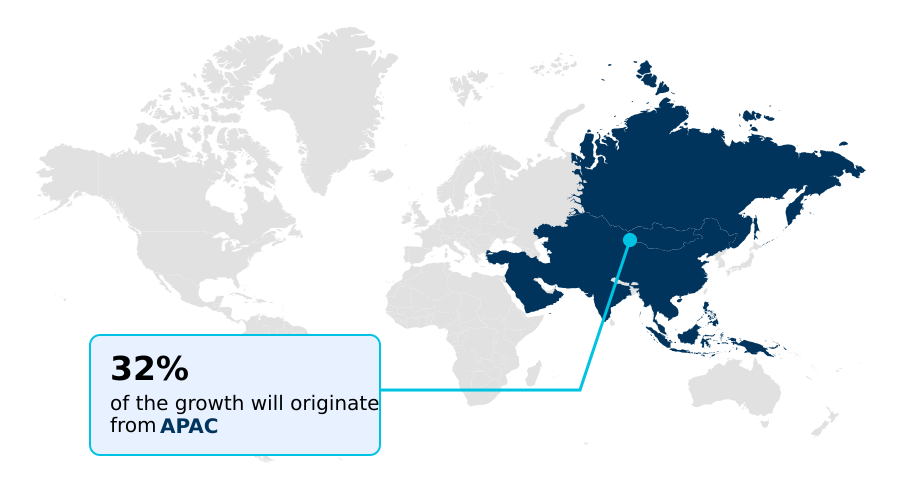
  • APAC dominated the market and accounted for a 31.6% growth during the forecast period.
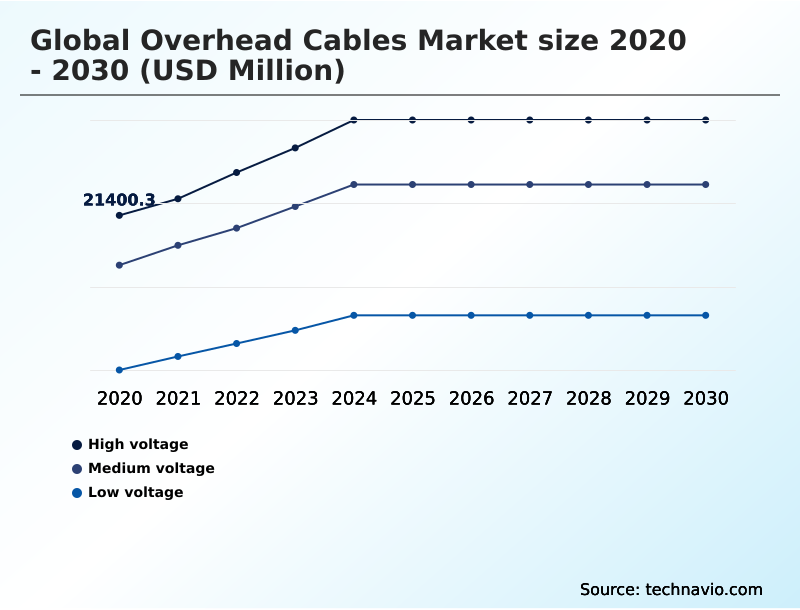
  • By Type - High voltage segment was valued at USD 25.77 billion in 2024
  • By Application - Utility segment accounted for the largest market revenue share in 2024

Market Size & Forecast

  • Market Opportunities: USD 34.47 billion
  • Market Future Opportunities: USD 20.59 billion
  • CAGR from 2025 to 2030 : 5.4%

Market Summary

  • The overhead cables market is undergoing substantial growth, driven by the critical need to modernize aging power grids and integrate a rising share of renewable energy. This transition necessitates significant investments in transmission and distribution grids, from high-voltage direct current (hvdc) systems for long-distance power transmission to low voltage distribution networks for rural electrification programs.
  • Key activities include transmission line reconductoring with advanced conductor materials to increase power transmission capacity and implementing smart grid technologies to improve electrical grid stability.
  • For instance, a utility might deploy optical ground wire (opgw) along high voltage overhead lines to establish a dual-purpose infrastructure for power delivery and high-speed data communication, enabling advanced asset management systems and predictive maintenance enablement. This strategic upgrade enhances grid resilience and reliability while optimizing operational costs.
  • The market is also shaped by industrial park electrification and widespread urban and industrial growth, which require a robust and flexible electrical distribution network capable of supporting both three-phase power systems and single-phase power distribution for diverse end-users. These factors collectively create a sustained demand for various overhead cable solutions globally.

What will be the Size of the Overhead Cables Market during the forecast period?

Get Key Insights on Market Forecast (PDF) Request Free Sample

How is the Overhead Cables Market Segmented?

The overhead cables industry research report provides comprehensive data (region-wise segment analysis), with forecasts and estimates in "USD million" for the period 2026-2030, as well as historical data from 2020-2024 for the following segments.

  • Type
    • High voltage
    • Medium voltage
    • Low voltage
  • Application
    • Utility
    • Industrial
    • Residential
    • Commercial
  • Category
    • Three cores
    • Four cores
    • Single core
    • Two cores
  • Geography
    • APAC
      • China
      • India
      • Japan
    • Europe
      • Germany
      • France
      • UK
    • North America
      • US
      • Canada
      • Mexico
    • South America
      • Brazil
      • Argentina
    • Middle East and Africa
      • Saudi Arabia
      • UAE
      • South Africa
    • Rest of World (ROW)

By Type Insights

The high voltage segment is estimated to witness significant growth during the forecast period.

The high voltage segment is central to national and international electricity grids, focusing on bulk power transmission over extensive distances.

Market dynamics are dictated by large capital investments and strategic energy planning, including the construction of new high voltage overhead lines to connect remote renewable energy sources.

The development of ultra-high-voltage (uhv) transmission corridors and cross-border interconnectors is critical for enhancing power transmission capacity and ensuring power supply stability.

A notable shift towards high-voltage direct current (hvdc) technology is underway for long-haul projects, which can improve energy transmission efficiency and reduce losses by over 3% compared to conventional AC systems.

This trend underscores the demand for advanced conductor materials and robust grid interconnection projects to build high-capacity transmission corridors for long-distance power transmission and facilitate renewable energy integration.

Request Free Sample

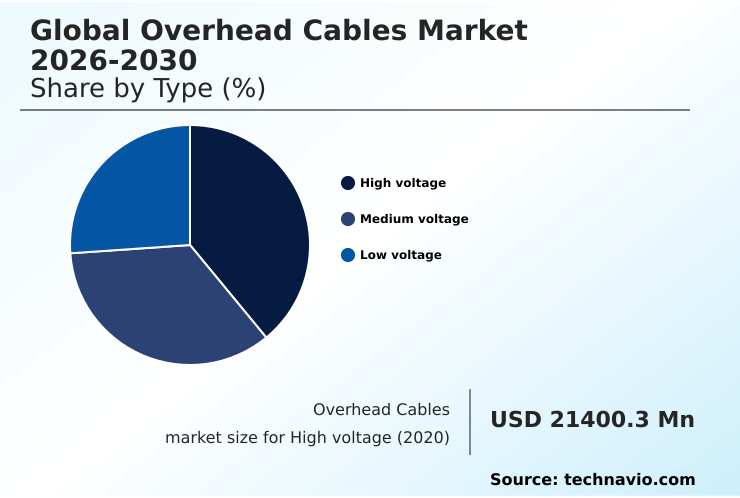
The High voltage segment was valued at USD 25.77 billion in 2024 and showed a gradual increase during the forecast period.

Request Free Sample

Regional Analysis

APAC is estimated to contribute 31.6% to the growth of the global market during the forecast period.Technavio’s analysts have elaborately explained the regional trends and drivers that shape the market during the forecast period.

See How Overhead Cables Market Demand is Rising in APAC Request Free Sample

The geographic landscape of the market is diverse, with APAC poised to contribute over 31% of the market's incremental growth, driven by major electrical grid expansion projects.

In this region, the deployment of aerial bundled cables (abc) and service drop cables for low voltage distribution is widespread.

North America focuses on power grid upgrades, with utilities adopting advanced solutions like aluminum conductor composite core (accc) and other composite core cables to enhance transmission capacity on existing rights-of-way.

The use of these advanced conductors can increase line capacity by nearly 100% with minimal structural changes.

Meanwhile, Europe is advancing grid automation and control through the integration of optical ground wire (opgw) for communication and deploying covered conductors and spacer cable systems to improve reliability in vegetated areas.

Market Dynamics

Our researchers analyzed the data with 2025 as the base year, along with the key drivers, trends, and challenges. A holistic analysis of drivers will help companies refine their marketing strategies to gain a competitive advantage.

  • Strategic decision-making in the overhead cables market requires a nuanced understanding of competing technologies and lifecycle costs. A critical evaluation involves comparing the cost-effectiveness of hvdc vs hvac transmission for new long-distance corridors, where HVDC can offer lower operational expenses over the project's lifetime.
  • The performance of htls conductors in extreme weather is a key factor in grid hardening initiatives, as these advanced materials offer greater resilience than traditional cables. For urban and suburban areas, a thorough analysis of underground vs overhead cable installation costs is essential, weighing the high upfront capital of undergrounding against long-term benefits like reduced maintenance.
  • The benefits of aerial bundled cables in urban areas, including improved safety and reliability, must be balanced against aesthetic considerations. Concurrently, the impact of der on medium voltage networks is forcing utilities to reassess grid architecture and control strategies.
  • Navigating these complexities, from the technical challenges in integrating uhv transmission lines to leveraging the role of opgw in smart grid communication, is vital. Adopting best practices in these areas can improve project ROI by up to 15% compared to conventional approaches, highlighting the value of a comprehensive, forward-looking procurement and deployment strategy.

What are the key market drivers leading to the rise in the adoption of Overhead Cables Industry?

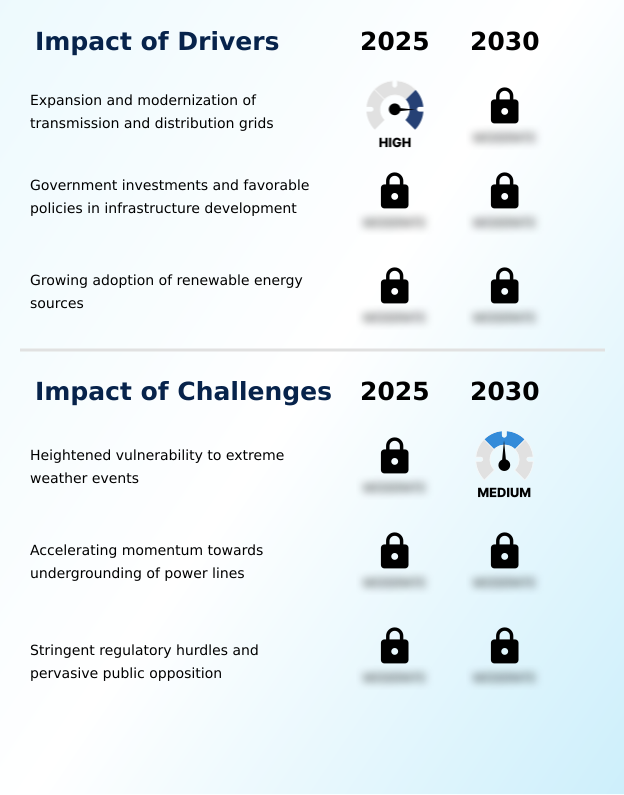
  • The expansion and modernization of transmission and distribution grids is a key driver fueling market growth.

  • The expansion of the electrical distribution network, driven by government-led infrastructure investment programs and public-private partnerships, is a major market catalyst.
  • These initiatives support the modernization of medium voltage infrastructure and the reconductoring of aging lines, often replacing traditional aluminum conductor steel-reinforced (acsr) cables.
  • Demand is further fueled by the development of utility-scale solar and wind farms, which require robust connections to the grid to ensure grid resilience and reliability. Effective load forecasting and management are becoming crucial as decentralized power generation grows.
  • Investments in modern asset management systems are shown to reduce operational costs by up to 20% through optimized maintenance schedules.
  • This sustained focus on building resilient energy infrastructure for smart city projects and commercial real estate development ensures a strong demand pipeline.

What are the market trends shaping the Overhead Cables Industry?

  • The intensified integration of renewable energy sources is a significant market trend. This necessitates substantial investments in grid infrastructure to support the ongoing energy transition.

  • A primary trend is the substantial investment in grid modernization initiatives and power grid upgrades. These efforts focus on replacing aging infrastructure within transmission and distribution grids and deploying advanced solutions like high-temperature low-sag (htls) conductors and other flexible ac transmission systems (facts).
  • The adoption of smart grid technologies is critical for managing distributed energy resources (der) and ensuring electrical grid stability, with some systems improving fault location accuracy by over 90%. These national infrastructure plans also support rural electrification programs and industrial park electrification.
  • This trend toward a more intelligent and resilient grid, which enables predictive maintenance, drives demand for advanced cables and systems that support greater automation and control, reflecting a broader pattern of urban and industrial growth.

What challenges does the Overhead Cables Industry face during its growth?

  • A key challenge affecting industry growth is the heightened vulnerability of overhead infrastructure to extreme weather events.

  • Significant challenges stem from the high costs and complexities associated with power distribution lines. The trend toward undergrounding, while improving aesthetics and resilience, presents a formidable barrier, with installation costs often being more than ten times higher than for overhead systems.
  • This pushes a focus on enhancing overhead solutions through grid hardening strategies and better right-of-way management to reduce vegetation management expenses. The use of more resilient materials like all aluminum alloy conductor (aaac) and cross-linked polyethylene (xlpe) insulation helps mitigate damage, contributing to power outage reduction.
  • However, lengthy regulatory hurdles and public opposition can delay projects for years, complicating efforts to upgrade three-phase power systems. Innovations in insulated conductors and electrical fault detection are critical to minimizing transmission loss and improving the lifecycle value of overhead assets.

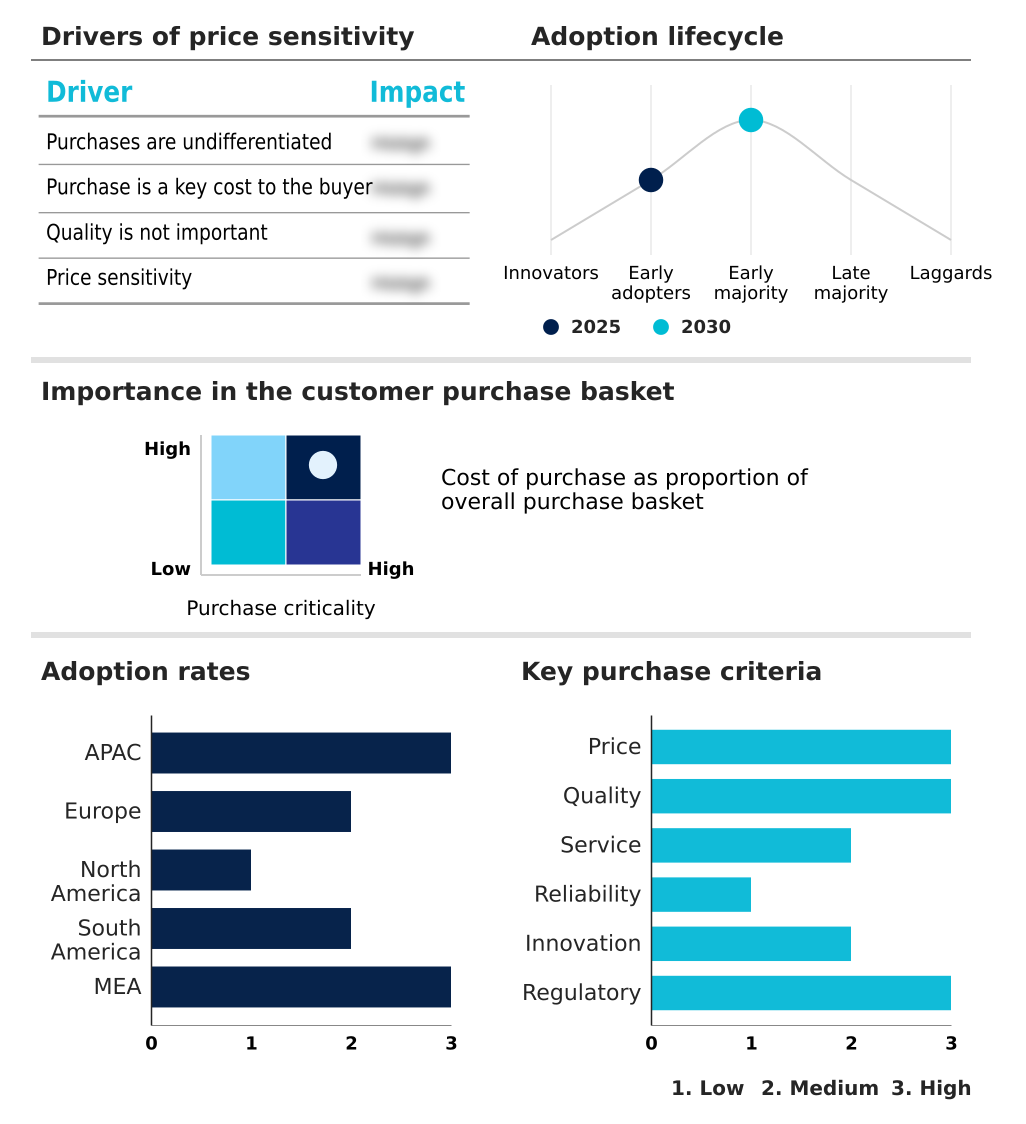
Exclusive Technavio Analysis on Customer Landscape

The overhead cables market forecasting report includes the adoption lifecycle of the market, covering from the innovator’s stage to the laggard’s stage. It focuses on adoption rates in different regions based on penetration. Furthermore, the overhead cables market report also includes key purchase criteria and drivers of price sensitivity to help companies evaluate and develop their market growth analysis strategies.

Customer Landscape of Overhead Cables Industry

Competitive Landscape

Companies are implementing various strategies, such as strategic alliances, overhead cables market forecast, partnerships, mergers and acquisitions, geographical expansion, and product/service launches, to enhance their presence in the industry.

Apar Industries Ltd. - Offers overhead cables including high-voltage transmission lines for power distribution networks, focusing on enhancing electrical infrastructure.

The industry research and growth report includes detailed analyses of the competitive landscape of the market and information about key companies, including:

  • Apar Industries Ltd.
  • Dubai Cable Company Pvt. Ltd.
  • Eland Cables
  • Furukawa Electric Co. Ltd.
  • Jiangsu Zhongtian Technology
  • KEC International Ltd.
  • KEI Industries Ltd.
  • Lamifil NV
  • LS Cable and System Ltd.
  • Nexans SA
  • NKT AS
  • Prysmian S.p.A
  • Riyadh Cables Group
  • Southwire Co. LLC
  • Tratos Cavi S.p.A.

Qualitative and quantitative analysis of companies has been conducted to help clients understand the wider business environment as well as the strengths and weaknesses of key industry players. Data is qualitatively analyzed to categorize companies as pure play, category-focused, industry-focused, and diversified; it is quantitatively analyzed to categorize companies as dominant, leading, strong, tentative, and weak.

Recent Development and News in Overhead cables market

  • In August 2024, The U.S. Department of Energy allocated an additional $2.2 billion from its Grid Resilience and Innovation Partnership (GRIP) program to fund grid enhancement projects across eighteen states, including the construction and upgrading of transmission lines.
  • In November 2024, The U.S. Department of Energy announced a $30 million investment from the Bipartisan Infrastructure Law to leverage artificial intelligence for accelerating the interconnection process for new energy generation, aiming to clear project backlogs.
  • In January 2025, Vietnam's national utility energized a 500kV transmission line, representing a $44 million investment, to connect the Monsoon wind power plant in Laos to its national grid, facilitating cross-border renewable energy trade.
  • In July 2025, the second phase of India's Green Energy Corridor project is under implementation across seven states, aiming to install approximately 10,750 circuit kilometers of transmission lines and 27,500 MVA of substation capacity to integrate 20 GW of renewable energy.

Dive into Technavio’s robust research methodology, blending expert interviews, extensive data synthesis, and validated models for unparalleled Overhead Cables Market insights. See full methodology.

Market Scope
Page number 311
Base year 2025
Historic period 2020-2024
Forecast period 2026-2030
Growth momentum & CAGR Accelerate at a CAGR of 5.4%
Market growth 2026-2030 USD 20586.0 million
Market structure Fragmented
YoY growth 2025-2026(%) 5.2%
Key countries China, India, Japan, South Korea, Australia, Indonesia, Germany, France, UK, Italy, Spain, The Netherlands, US, Canada, Mexico, Brazil, Argentina, Chile, Saudi Arabia, UAE, South Africa, Israel and Turkey
Competitive landscape Leading Companies, Market Positioning of Companies, Competitive Strategies, and Industry Risks

Request Free Sample

Research Analyst Overview

  • The overhead cables market is defined by a global push toward grid modernization and decarbonization. This evolution is driven by the need to upgrade transmission and distribution grids to enhance grid resilience and reliability and support large-scale renewable energy integration.
  • Key technologies such as high-voltage direct current (hvdc) for cross-border interconnectors and high-temperature low-sag (htls) conductors for increasing power transmission capacity are becoming standard. Grid modernization initiatives often involve deploying smart grid technologies and advanced materials like aluminum conductor composite core (accc) to support distributed energy resources (der).
  • For boardroom consideration, aligning with grid hardening strategies is now a critical compliance and risk management issue, as regulatory bodies increasingly mandate resilience against climate-related threats. Investment in grid upgrades has demonstrated a direct correlation with reduced outage times, with some utilities reporting a 30% decrease in service disruptions after modernizing key segments of their electrical distribution network.
  • The expansion of utility-scale solar and wind farms continues to fuel demand for new high voltage overhead lines, ensuring a sustained growth trajectory.

What are the Key Data Covered in this Overhead Cables Market Research and Growth Report?

  • What is the expected growth of the Overhead Cables Market between 2026 and 2030?

    • USD 20.59 billion, at a CAGR of 5.4%

  • What segmentation does the market report cover?

    • The report is segmented by Type (High voltage, Medium voltage, and Low voltage), Application (Utility, Industrial, Residential, and Commercial), Category (Three cores, Four cores, Single core, and Two cores) and Geography (APAC, Europe, North America, South America, Middle East and Africa)

  • Which regions are analyzed in the report?

    • APAC, Europe, North America, South America and Middle East and Africa

  • What are the key growth drivers and market challenges?

    • Expansion and modernization of transmission and distribution grids, Heightened vulnerability to extreme weather events

  • Who are the major players in the Overhead Cables Market?

    • Apar Industries Ltd., Dubai Cable Company Pvt. Ltd., Eland Cables, Furukawa Electric Co. Ltd., Jiangsu Zhongtian Technology, KEC International Ltd., KEI Industries Ltd., Lamifil NV, LS Cable and System Ltd., Nexans SA, NKT AS, Prysmian S.p.A, Riyadh Cables Group, Southwire Co. LLC and Tratos Cavi S.p.A.

Market Research Insights

  • The market's trajectory is shaped by a confluence of strategic initiatives and technological shifts. The development of high-capacity transmission corridors and national infrastructure plans are accelerating power grid upgrades and electrical grid expansion. Investments are driven by the need to support decentralized power generation and smart city projects, with public-private partnerships becoming instrumental in funding large-scale transmission infrastructure development.
  • Advanced asset management systems enable predictive maintenance, reducing power outage rates by over 20%. Furthermore, the adoption of modern grid solutions expands capacity on existing lines, with some projects achieving a 15% improvement in energy transmission efficiency.
  • This focus on modernization is crucial for managing the demands of commercial real estate development and ensuring power supply stability amid urban and industrial growth.

We can help! Our analysts can customize this overhead cables market research report to meet your requirements.

Get in touch

1. Executive Summary

1.1 Market overview

Executive Summary - Chart on Market Overview
Executive Summary - Data Table on Market Overview
Executive Summary - Chart on Global Market Characteristics
Executive Summary - Chart on Market by Geography
Executive Summary - Chart on Market Segmentation by Type
Executive Summary - Chart on Market Segmentation by Application
Executive Summary - Chart on Market Segmentation by Category
Executive Summary - Chart on Incremental Growth
Executive Summary - Data Table on Incremental Growth
Executive Summary - Chart on Company Market Positioning

2. Technavio Analysis

2.1 Analysis of price sensitivity, lifecycle, customer purchase basket, adoption rates, and purchase criteria

2.2 Criticality of inputs and Factors of differentiation

Chart on Overview on criticality of inputs and factors of differentiation

2.3 Factors of disruption

Chart on Overview on factors of disruption

2.4 Impact of drivers and challenges

Chart on Impact of drivers and challenges in 2025 and 2030

3. Market Landscape

3.1 Market ecosystem

Chart on Parent Market
Data Table on - Parent Market

3.2 Market characteristics

Chart on Market characteristics analysis

3.3 Value chain analysis

Chart on Value chain analysis

4. Market Sizing

4.1 Market definition

Data Table on Offerings of companies included in the market definition

4.2 Market segment analysis

Market segments

4.3 Market size 2025

4.4 Market outlook: Forecast for 2025-2030

Chart on Global - Market size and forecast 2025-2030 ($ million)
Data Table on Global - Market size and forecast 2025-2030 ($ million)
Chart on Global Market: Year-over-year growth 2025-2030 (%)
Data Table on Global Market: Year-over-year growth 2025-2030 (%)

5. Historic Market Size

5.1 Global Overhead Cables Market 2020 - 2024

Historic Market Size - Data Table on Global Overhead Cables Market 2020 - 2024 ($ million)

5.2 Type segment analysis 2020 - 2024

Historic Market Size - Type Segment 2020 - 2024 ($ million)

5.3 Application segment analysis 2020 - 2024

Historic Market Size - Application Segment 2020 - 2024 ($ million)

5.4 Category segment analysis 2020 - 2024

Historic Market Size - Category Segment 2020 - 2024 ($ million)

5.5 Geography segment analysis 2020 - 2024

Historic Market Size - Geography Segment 2020 - 2024 ($ million)

5.6 Country segment analysis 2020 - 2024

Historic Market Size - Country Segment 2020 - 2024 ($ million)

6. Qualitative Analysis

6.1 Impact of Artificial Intelligence in the Global Overhead Cables Market

7. Five Forces Analysis

7.1 Five forces summary

Five forces analysis - Comparison between 2025 and 2030

7.2 Bargaining power of buyers

Bargaining power of buyers - Impact of key factors 2025 and 2030

7.3 Bargaining power of suppliers

Bargaining power of suppliers - Impact of key factors in 2025 and 2030

7.4 Threat of new entrants

Threat of new entrants - Impact of key factors in 2025 and 2030

7.5 Threat of substitutes

Threat of substitutes - Impact of key factors in 2025 and 2030

7.6 Threat of rivalry

Threat of rivalry - Impact of key factors in 2025 and 2030

7.7 Market condition

Chart on Market condition - Five forces 2025 and 2030

8. Market Segmentation by Type

8.1 Market segments

Chart on Type - Market share 2025-2030 (%)
Data Table on Type - Market share 2025-2030 (%)

8.2 Comparison by Type

Chart on Comparison by Type
Data Table on Comparison by Type

8.3 High voltage - Market size and forecast 2025-2030

Chart on High voltage - Market size and forecast 2025-2030 ($ million)
Data Table on High voltage - Market size and forecast 2025-2030 ($ million)
Chart on High voltage - Year-over-year growth 2025-2030 (%)
Data Table on High voltage - Year-over-year growth 2025-2030 (%)

8.4 Medium voltage - Market size and forecast 2025-2030

Chart on Medium voltage - Market size and forecast 2025-2030 ($ million)
Data Table on Medium voltage - Market size and forecast 2025-2030 ($ million)
Chart on Medium voltage - Year-over-year growth 2025-2030 (%)
Data Table on Medium voltage - Year-over-year growth 2025-2030 (%)

8.5 Low voltage - Market size and forecast 2025-2030

Chart on Low voltage - Market size and forecast 2025-2030 ($ million)
Data Table on Low voltage - Market size and forecast 2025-2030 ($ million)
Chart on Low voltage - Year-over-year growth 2025-2030 (%)
Data Table on Low voltage - Year-over-year growth 2025-2030 (%)

8.6 Market opportunity by Type

Market opportunity by Type ($ million)
Data Table on Market opportunity by Type ($ million)

9. Market Segmentation by Application

9.1 Market segments

Chart on Application - Market share 2025-2030 (%)
Data Table on Application - Market share 2025-2030 (%)

9.2 Comparison by Application

Chart on Comparison by Application
Data Table on Comparison by Application

9.3 Utility - Market size and forecast 2025-2030

Chart on Utility - Market size and forecast 2025-2030 ($ million)
Data Table on Utility - Market size and forecast 2025-2030 ($ million)
Chart on Utility - Year-over-year growth 2025-2030 (%)
Data Table on Utility - Year-over-year growth 2025-2030 (%)

9.4 Industrial - Market size and forecast 2025-2030

Chart on Industrial - Market size and forecast 2025-2030 ($ million)
Data Table on Industrial - Market size and forecast 2025-2030 ($ million)
Chart on Industrial - Year-over-year growth 2025-2030 (%)
Data Table on Industrial - Year-over-year growth 2025-2030 (%)

9.5 Residential - Market size and forecast 2025-2030

Chart on Residential - Market size and forecast 2025-2030 ($ million)
Data Table on Residential - Market size and forecast 2025-2030 ($ million)
Chart on Residential - Year-over-year growth 2025-2030 (%)
Data Table on Residential - Year-over-year growth 2025-2030 (%)

9.6 Commercial - Market size and forecast 2025-2030

Chart on Commercial - Market size and forecast 2025-2030 ($ million)
Data Table on Commercial - Market size and forecast 2025-2030 ($ million)
Chart on Commercial - Year-over-year growth 2025-2030 (%)
Data Table on Commercial - Year-over-year growth 2025-2030 (%)

9.7 Market opportunity by Application

Market opportunity by Application ($ million)
Data Table on Market opportunity by Application ($ million)

10. Market Segmentation by Category

10.1 Market segments

Chart on Market Segmentation by Category - Market share 2025-2030 (%)
Data Table on Market Segmentation by Category - Market share 2025-2030 (%)

10.2 Comparison by Market Segmentation by Category

Chart on Comparison by Market Segmentation by Category
Data Table on Comparison by Market Segmentation by Category

10.3 Three cores - Market size and forecast 2025-2030

Chart on Three cores - Market size and forecast 2025-2030 ($ million)
Data Table on Three cores - Market size and forecast 2025-2030 ($ million)
Chart on Three cores - Year-over-year growth 2025-2030 (%)
Data Table on Three cores - Year-over-year growth 2025-2030 (%)

10.4 Four cores - Market size and forecast 2025-2030

Chart on Four cores - Market size and forecast 2025-2030 ($ million)
Data Table on Four cores - Market size and forecast 2025-2030 ($ million)
Chart on Four cores - Year-over-year growth 2025-2030 (%)
Data Table on Four cores - Year-over-year growth 2025-2030 (%)

10.5 Single core - Market size and forecast 2025-2030

Chart on Single core - Market size and forecast 2025-2030 ($ million)
Data Table on Single core - Market size and forecast 2025-2030 ($ million)
Chart on Single core - Year-over-year growth 2025-2030 (%)
Data Table on Single core - Year-over-year growth 2025-2030 (%)

10.6 Two cores - Market size and forecast 2025-2030

Chart on Two cores - Market size and forecast 2025-2030 ($ million)
Data Table on Two cores - Market size and forecast 2025-2030 ($ million)
Chart on Two cores - Year-over-year growth 2025-2030 (%)
Data Table on Two cores - Year-over-year growth 2025-2030 (%)

10.7 Market opportunity by Market Segmentation by Category

Market opportunity by Market Segmentation by Category ($ million)
Data Table on Market opportunity by Market Segmentation by Category ($ million)

11. Customer Landscape

11.1 Customer landscape overview

Analysis of price sensitivity, lifecycle, customer purchase basket, adoption rates, and purchase criteria

12. Geographic Landscape

12.1 Geographic segmentation

Chart on Market share by geography 2025-2030 (%)
Data Table on Market share by geography 2025-2030 (%)

12.2 Geographic comparison

Chart on Geographic comparison
Data Table on Geographic comparison

12.3 APAC - Market size and forecast 2025-2030

Chart on APAC - Market size and forecast 2025-2030 ($ million)
Data Table on APAC - Market size and forecast 2025-2030 ($ million)
Chart on APAC - Year-over-year growth 2025-2030 (%)
Data Table on APAC - Year-over-year growth 2025-2030 (%)
Chart on Regional Comparison - APAC
Data Table on Regional Comparison - APAC

12.3.1 China - Market size and forecast 2025-2030

Chart on China - Market size and forecast 2025-2030 ($ million)
Data Table on China - Market size and forecast 2025-2030 ($ million)
Chart on China - Year-over-year growth 2025-2030 (%)
Data Table on China - Year-over-year growth 2025-2030 (%)

12.3.2 India - Market size and forecast 2025-2030

Chart on India - Market size and forecast 2025-2030 ($ million)
Data Table on India - Market size and forecast 2025-2030 ($ million)
Chart on India - Year-over-year growth 2025-2030 (%)
Data Table on India - Year-over-year growth 2025-2030 (%)

12.3.3 Japan - Market size and forecast 2025-2030

Chart on Japan - Market size and forecast 2025-2030 ($ million)
Data Table on Japan - Market size and forecast 2025-2030 ($ million)
Chart on Japan - Year-over-year growth 2025-2030 (%)
Data Table on Japan - Year-over-year growth 2025-2030 (%)

12.3.4 South Korea - Market size and forecast 2025-2030

Chart on South Korea - Market size and forecast 2025-2030 ($ million)
Data Table on South Korea - Market size and forecast 2025-2030 ($ million)
Chart on South Korea - Year-over-year growth 2025-2030 (%)
Data Table on South Korea - Year-over-year growth 2025-2030 (%)

12.3.5 Australia - Market size and forecast 2025-2030

Chart on Australia - Market size and forecast 2025-2030 ($ million)
Data Table on Australia - Market size and forecast 2025-2030 ($ million)
Chart on Australia - Year-over-year growth 2025-2030 (%)
Data Table on Australia - Year-over-year growth 2025-2030 (%)

12.3.6 Indonesia - Market size and forecast 2025-2030

Chart on Indonesia - Market size and forecast 2025-2030 ($ million)
Data Table on Indonesia - Market size and forecast 2025-2030 ($ million)
Chart on Indonesia - Year-over-year growth 2025-2030 (%)
Data Table on Indonesia - Year-over-year growth 2025-2030 (%)

12.4 Europe - Market size and forecast 2025-2030

Chart on Europe - Market size and forecast 2025-2030 ($ million)
Data Table on Europe - Market size and forecast 2025-2030 ($ million)
Chart on Europe - Year-over-year growth 2025-2030 (%)
Data Table on Europe - Year-over-year growth 2025-2030 (%)
Chart on Regional Comparison - Europe
Data Table on Regional Comparison - Europe

12.4.1 Germany - Market size and forecast 2025-2030

Chart on Germany - Market size and forecast 2025-2030 ($ million)
Data Table on Germany - Market size and forecast 2025-2030 ($ million)
Chart on Germany - Year-over-year growth 2025-2030 (%)
Data Table on Germany - Year-over-year growth 2025-2030 (%)

12.4.2 France - Market size and forecast 2025-2030

Chart on France - Market size and forecast 2025-2030 ($ million)
Data Table on France - Market size and forecast 2025-2030 ($ million)
Chart on France - Year-over-year growth 2025-2030 (%)
Data Table on France - Year-over-year growth 2025-2030 (%)

12.4.3 UK - Market size and forecast 2025-2030

Chart on UK - Market size and forecast 2025-2030 ($ million)
Data Table on UK - Market size and forecast 2025-2030 ($ million)
Chart on UK - Year-over-year growth 2025-2030 (%)
Data Table on UK - Year-over-year growth 2025-2030 (%)

12.4.4 Italy - Market size and forecast 2025-2030

Chart on Italy - Market size and forecast 2025-2030 ($ million)
Data Table on Italy - Market size and forecast 2025-2030 ($ million)
Chart on Italy - Year-over-year growth 2025-2030 (%)
Data Table on Italy - Year-over-year growth 2025-2030 (%)

12.4.5 Spain - Market size and forecast 2025-2030

Chart on Spain - Market size and forecast 2025-2030 ($ million)
Data Table on Spain - Market size and forecast 2025-2030 ($ million)
Chart on Spain - Year-over-year growth 2025-2030 (%)
Data Table on Spain - Year-over-year growth 2025-2030 (%)

12.4.6 The Netherlands - Market size and forecast 2025-2030

Chart on The Netherlands - Market size and forecast 2025-2030 ($ million)
Data Table on The Netherlands - Market size and forecast 2025-2030 ($ million)
Chart on The Netherlands - Year-over-year growth 2025-2030 (%)
Data Table on The Netherlands - Year-over-year growth 2025-2030 (%)

12.5 North America - Market size and forecast 2025-2030

Chart on North America - Market size and forecast 2025-2030 ($ million)
Data Table on North America - Market size and forecast 2025-2030 ($ million)
Chart on North America - Year-over-year growth 2025-2030 (%)
Data Table on North America - Year-over-year growth 2025-2030 (%)
Chart on Regional Comparison - North America
Data Table on Regional Comparison - North America

12.5.1 US - Market size and forecast 2025-2030

Chart on US - Market size and forecast 2025-2030 ($ million)
Data Table on US - Market size and forecast 2025-2030 ($ million)
Chart on US - Year-over-year growth 2025-2030 (%)
Data Table on US - Year-over-year growth 2025-2030 (%)

12.5.2 Canada - Market size and forecast 2025-2030

Chart on Canada - Market size and forecast 2025-2030 ($ million)
Data Table on Canada - Market size and forecast 2025-2030 ($ million)
Chart on Canada - Year-over-year growth 2025-2030 (%)
Data Table on Canada - Year-over-year growth 2025-2030 (%)

12.5.3 Mexico - Market size and forecast 2025-2030

Chart on Mexico - Market size and forecast 2025-2030 ($ million)
Data Table on Mexico - Market size and forecast 2025-2030 ($ million)
Chart on Mexico - Year-over-year growth 2025-2030 (%)
Data Table on Mexico - Year-over-year growth 2025-2030 (%)

12.6 South America - Market size and forecast 2025-2030

Chart on South America - Market size and forecast 2025-2030 ($ million)
Data Table on South America - Market size and forecast 2025-2030 ($ million)
Chart on South America - Year-over-year growth 2025-2030 (%)
Data Table on South America - Year-over-year growth 2025-2030 (%)
Chart on Regional Comparison - South America
Data Table on Regional Comparison - South America

12.6.1 Brazil - Market size and forecast 2025-2030

Chart on Brazil - Market size and forecast 2025-2030 ($ million)
Data Table on Brazil - Market size and forecast 2025-2030 ($ million)
Chart on Brazil - Year-over-year growth 2025-2030 (%)
Data Table on Brazil - Year-over-year growth 2025-2030 (%)

12.6.2 Argentina - Market size and forecast 2025-2030

Chart on Argentina - Market size and forecast 2025-2030 ($ million)
Data Table on Argentina - Market size and forecast 2025-2030 ($ million)
Chart on Argentina - Year-over-year growth 2025-2030 (%)
Data Table on Argentina - Year-over-year growth 2025-2030 (%)

12.6.3 Chile - Market size and forecast 2025-2030

Chart on Chile - Market size and forecast 2025-2030 ($ million)
Data Table on Chile - Market size and forecast 2025-2030 ($ million)
Chart on Chile - Year-over-year growth 2025-2030 (%)
Data Table on Chile - Year-over-year growth 2025-2030 (%)

12.7 Middle East and Africa - Market size and forecast 2025-2030

Chart on Middle East and Africa - Market size and forecast 2025-2030 ($ million)
Data Table on Middle East and Africa - Market size and forecast 2025-2030 ($ million)
Chart on Middle East and Africa - Year-over-year growth 2025-2030 (%)
Data Table on Middle East and Africa - Year-over-year growth 2025-2030 (%)
Chart on Regional Comparison - Middle East and Africa
Data Table on Regional Comparison - Middle East and Africa

12.7.1 Saudi Arabia - Market size and forecast 2025-2030

Chart on Saudi Arabia - Market size and forecast 2025-2030 ($ million)
Data Table on Saudi Arabia - Market size and forecast 2025-2030 ($ million)
Chart on Saudi Arabia - Year-over-year growth 2025-2030 (%)
Data Table on Saudi Arabia - Year-over-year growth 2025-2030 (%)

12.7.2 UAE - Market size and forecast 2025-2030

Chart on UAE - Market size and forecast 2025-2030 ($ million)
Data Table on UAE - Market size and forecast 2025-2030 ($ million)
Chart on UAE - Year-over-year growth 2025-2030 (%)
Data Table on UAE - Year-over-year growth 2025-2030 (%)

12.7.3 South Africa - Market size and forecast 2025-2030

Chart on South Africa - Market size and forecast 2025-2030 ($ million)
Data Table on South Africa - Market size and forecast 2025-2030 ($ million)
Chart on South Africa - Year-over-year growth 2025-2030 (%)
Data Table on South Africa - Year-over-year growth 2025-2030 (%)

12.7.4 Israel - Market size and forecast 2025-2030

Chart on Israel - Market size and forecast 2025-2030 ($ million)
Data Table on Israel - Market size and forecast 2025-2030 ($ million)
Chart on Israel - Year-over-year growth 2025-2030 (%)
Data Table on Israel - Year-over-year growth 2025-2030 (%)

12.7.5 Turkey - Market size and forecast 2025-2030

Chart on Turkey - Market size and forecast 2025-2030 ($ million)
Data Table on Turkey - Market size and forecast 2025-2030 ($ million)
Chart on Turkey - Year-over-year growth 2025-2030 (%)
Data Table on Turkey - Year-over-year growth 2025-2030 (%)

12.8 Market opportunity by geography

Market opportunity by geography ($ million)
Data Tables on Market opportunity by geography ($ million)

13. Drivers, Challenges, and Opportunity

13.1 Market drivers

Expansion and modernization of transmission and distribution grids
Government investments and favorable policies in infrastructure development
Growing adoption of renewable energy sources

13.2 Market challenges

Heightened vulnerability to extreme weather events
Accelerating momentum towards undergrounding of power lines
Stringent regulatory hurdles and pervasive public opposition

13.3 Impact of drivers and challenges

Impact of drivers and challenges in 2025 and 2030

13.4 Market opportunities

Intensified integration of renewable energy sources
Government and private sector investments in grid modernization
Rapid urbanization and industrialization

14. Competitive Landscape

14.1 Overview

14.2

Overview on criticality of inputs and factors of differentiation

14.3 Landscape disruption

Overview on factors of disruption

14.4 Industry risks

Impact of key risks on business

15. Competitive Analysis

15.1 Companies profiled

Companies covered

15.2 Company ranking index

15.3 Market positioning of companies

Matrix on companies position and classification

15.4 Apar Industries Ltd.

Apar Industries Ltd. - Overview
Apar Industries Ltd. - Business segments
Apar Industries Ltd. - Key offerings
Apar Industries Ltd. - Segment focus
SWOT

15.5 Dubai Cable Company Pvt. Ltd.

Dubai Cable Company Pvt. Ltd. - Overview
Dubai Cable Company Pvt. Ltd. - Product / Service
Dubai Cable Company Pvt. Ltd. - Key offerings
SWOT

15.6 Eland Cables

Eland Cables - Overview
Eland Cables - Product / Service
Eland Cables - Key offerings
SWOT

15.7 Furukawa Electric Co. Ltd.

Furukawa Electric Co. Ltd. - Overview
Furukawa Electric Co. Ltd. - Business segments
Furukawa Electric Co. Ltd. - Key offerings
Furukawa Electric Co. Ltd. - Segment focus
SWOT

15.8 Jiangsu Zhongtian Technology

Jiangsu Zhongtian Technology - Overview
Jiangsu Zhongtian Technology - Product / Service
Jiangsu Zhongtian Technology - Key offerings
SWOT

15.9 KEC International Ltd.

KEC International Ltd. - Overview
KEC International Ltd. - Product / Service
KEC International Ltd. - Key offerings
SWOT

15.10 KEI Industries Ltd.

KEI Industries Ltd. - Overview
KEI Industries Ltd. - Product / Service
KEI Industries Ltd. - Key offerings
SWOT

15.11 Lamifil NV

Lamifil NV - Overview
Lamifil NV - Product / Service
Lamifil NV - Key offerings
SWOT

15.12 LS Cable and System Ltd.

LS Cable and System Ltd. - Overview
LS Cable and System Ltd. - Product / Service
LS Cable and System Ltd. - Key offerings
SWOT

15.13 Nexans SA

Nexans SA - Overview
Nexans SA - Business segments
Nexans SA - Key news
Nexans SA - Key offerings
Nexans SA - Segment focus
SWOT

15.14 NKT AS

NKT AS - Overview
NKT AS - Business segments
NKT AS - Key news
NKT AS - Key offerings
NKT AS - Segment focus
SWOT

15.15 Prysmian S.p.A

Prysmian S.p.A - Overview
Prysmian S.p.A - Product / Service
Prysmian S.p.A - Key offerings
SWOT

15.16 Riyadh Cables Group

Riyadh Cables Group - Overview
Riyadh Cables Group - Product / Service
Riyadh Cables Group - Key offerings
SWOT

15.17 Southwire Co. LLC

Southwire Co. LLC - Overview
Southwire Co. LLC - Product / Service
Southwire Co. LLC - Key offerings
SWOT

15.18 Tratos Cavi S.p.A.

Tratos Cavi S.p.A. - Overview
Tratos Cavi S.p.A. - Product / Service
Tratos Cavi S.p.A. - Key offerings
SWOT

16. Appendix

16.1 Scope of the report

Market definition
Objectives
Notes and caveats

16.2 Inclusions and exclusions checklist

Inclusions checklist
Exclusions checklist

16.3 Currency conversion rates for US$

16.4 Research methodology

16.5 Data procurement

Information sources

16.6 Data validation

16.7 Validation techniques employed for market sizing

16.8 Data synthesis

16.9 360 degree market analysis

16.10 List of abbreviations

Research Methodology

Technavio presents a detailed picture of the market by way of study, synthesis, and summation of data from multiple sources. The analysts have presented the various facets of the market with a particular focus on identifying the key industry influencers. The data thus presented is comprehensive, reliable, and the result of extensive research, both primary and secondary.

INFORMATION SOURCES

Primary sources

  • Manufacturers and suppliers
  • Channel partners
  • Industry experts
  • Strategic decision makers

Secondary sources

  • Industry journals and periodicals
  • Government data
  • Financial reports of key industry players
  • Historical data
  • Press releases

DATA ANALYSIS

Data Synthesis

  • Collation of data
  • Estimation of key figures
  • Analysis of derived insights

Data Validation

  • Triangulation with data models
  • Reference against proprietary databases
  • Corroboration with industry experts

REPORT WRITING

Qualitative

  • Market drivers
  • Market challenges
  • Market trends
  • Five forces analysis

Quantitative

  • Market size and forecast
  • Market segmentation
  • Geographical insights
  • Competitive landscape

Interested in this report?

Get your sample now to see our research methodology and insights!

Download Now

Frequently Asked Questions

Overhead Cables market growth will increase by USD 20586.0 million during 2026-2030.

The Overhead Cables market is expected to grow at a CAGR of 5.4% during 2026-2030.

Overhead Cables market is segmented by Type (High voltage, Medium voltage, Low voltage) Application (Utility, Industrial, Residential, Commercial) Category (Three cores, Four cores, Single core, Two cores)

Apar Industries Ltd., Dubai Cable Company Pvt. Ltd., Eland Cables, Furukawa Electric Co. Ltd., Jiangsu Zhongtian Technology, KEC International Ltd., KEI Industries Ltd., Lamifil NV, LS Cable and System Ltd., Nexans SA, NKT AS, Prysmian S.p.A, Riyadh Cables Group, Southwire Co. LLC, Tratos Cavi S.p.A. are a few of the key vendors in the Overhead Cables market.

APAC will register the highest growth rate of 31.6% among the other regions. Therefore, the Overhead Cables market in APAC is expected to garner significant business opportunities for the vendors during the forecast period.

China, India, Japan, South Korea, Australia, Indonesia, Germany, France, UK, Italy, Spain, The Netherlands, US, Canada, Mexico, Brazil, Argentina, Chile, Saudi Arabia, UAE, South Africa, Israel, Turkey

  • Expansion and modernization of transmission and distribution grids is the driving factor this market.

The Overhead Cables market vendors should focus on grabbing business opportunities from the Type segment as it accounted for the largest market share in the base year.