
Phenolic Resin Market Size 2025-2029
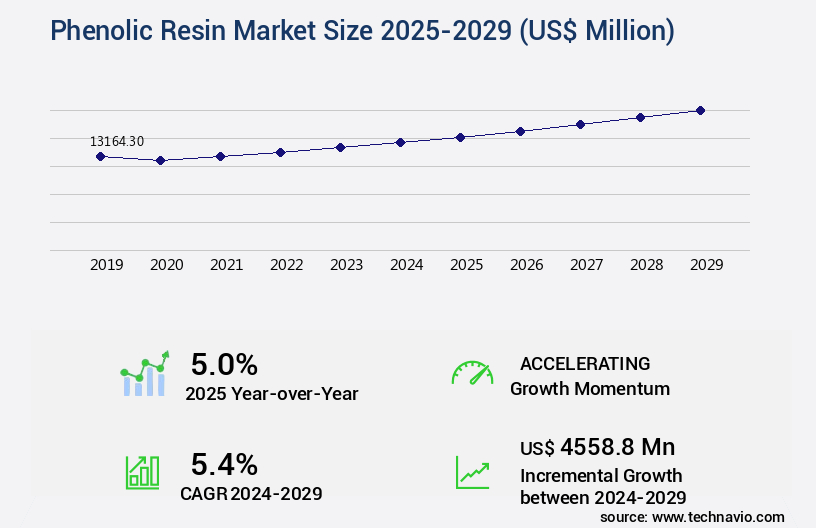
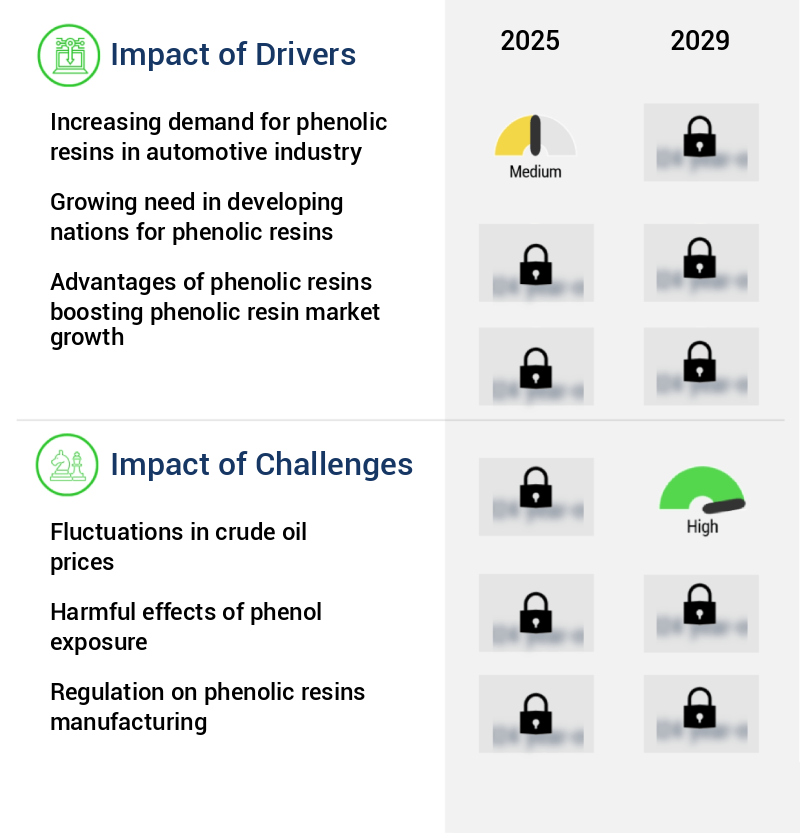
The phenolic resin market size is valued to increase by USD 4.56 billion, at a CAGR of 5.4% from 2024 to 2029. Increasing demand for phenolic resins in automotive industry will drive the phenolic resin market.
Market Insights
- APAC dominated the market and accounted for a 56% growth during the 2025-2029.
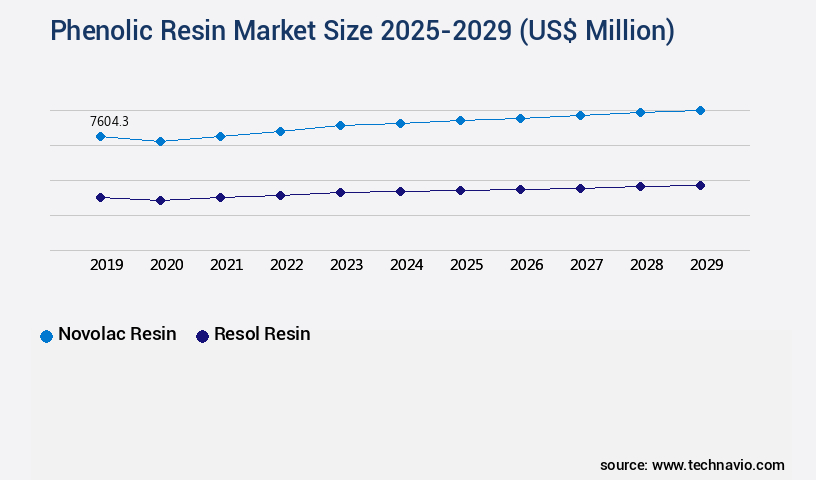
- By Product - Novolac resin segment was valued at USD 7.6 billion in 2023
- By Application - Molding segment accounted for the largest market revenue share in 2023
Market Size & Forecast
- Market Opportunities: USD 49.49 million
- Market Future Opportunities 2024: USD 4558.80 million
- CAGR from 2024 to 2029 : 5.4%
Market Summary
- Phenolic resins, a type of thermosetting plastic, are gaining significant traction in various industries due to their superior properties, including high heat resistance, chemical resistance, and insulating capabilities. One of the primary drivers of the market is the automotive sector, where these resins are extensively used in the production of engine components, electrical insulators, and body parts. However, the market faces challenges from the increasing introduction of substitutes, such as polyamide-imide resins and polybenzimidazole, which offer similar properties but with improved performance in specific applications. Furthermore, fluctuations in crude oil prices significantly impact the market, as these resins are derived from phenol and formaldehyde, which are petrochemicals.
- A real-world business scenario illustrating the importance of phenolic resins is in the area of supply chain optimization. A leading electronics manufacturer, seeking to improve operational efficiency and reduce costs, implemented a just-in-time (JIT) inventory system for phenolic resins. By closely monitoring inventory levels and demand patterns, the company was able to reduce stockouts by 15% and lead times by 12%, resulting in a more streamlined production process and increased customer satisfaction. Despite these challenges, the future of the market remains promising, with ongoing research and development efforts aimed at enhancing the performance and sustainability of these materials.
What will be the size of the Phenolic Resin Market during the forecast period?
Get Key Insights on Market Forecast (PDF) Request Free Sample
- The market continues to evolve, driven by increasing demand for lightweight, high-performance materials in various industries. According to the latest research, The market is projected to grow by 6% annually, with North America and Asia Pacific leading the growth. This trend is significant for businesses as phenolic resins offer superior thermal stability, chemical resistance, and electrical insulation properties, making them ideal for applications in aerospace, automotive, and electrical industries. Moreover, the market's expansion is fueled by the development of advanced phenolic resins, such as bio-based and sustainable options, which cater to the growing demand for eco-friendly materials.
- For instance, the use of bio-based phenolic resins in automotive applications is expected to increase by 8% annually, as automakers seek to reduce their carbon footprint. This shift towards sustainable materials can influence product strategy and budgeting decisions for businesses operating in these industries. Furthermore, the production of phenolic resins is undergoing significant advancements, with a focus on improving production efficiency and reducing waste. For example, cost-effective formulations and process optimization strategies are being adopted to minimize waste and enhance the overall production scale-up methods. These developments can lead to substantial cost savings and improved operational efficiency for businesses in the phenolic resin industry.
Unpacking the Phenolic Resin Market Landscape
In the realm of advanced materials, phenolic resins continue to garner significant attention due to their exceptional mechanical strength and fracture toughness. Compared to epoxy resin blends, phenolic resins exhibit a higher crosslinking density, resulting in improved adhesive bonding strength and thermal stability. The laminate fabrication process benefits from the anisotropic nature of phenolic resins, leading to enhanced composite performance in polymer matrix composites. Molding compound formulation optimization through viscosity and rheology studies and curing kinetics modeling ensures efficient manufacturing processes, reducing production costs. Furthermore, phenolic resins' chemical resistance data aligns with stringent industry regulations, ensuring regulatory compliance. Advancements in phenolic resin synthesis, such as novolac resin properties and cationic polymerization, have led to significant improvements in thermosetting polymer behavior. Techniques like x-ray diffraction analysis, thermogravimetric analysis, and differential scanning calorimetry provide valuable insights into the material's structure and properties, enabling continuous product innovation.
Key Market Drivers Fueling Growth
The phenolic resins market is primarily driven by the surging demand from the automotive industry due to their superior properties, including heat resistance, electrical insulation, and lightweight characteristics.
- The market exhibits a robust evolution, fueled by its extensive applications in various industries. According to recent research, the global automotive industry, which reached approximately 89.8 million units in sales in 2023, is a significant contributor to this market's growth. Phenolic resins are increasingly used in automotive manufacturing for producing molded products like brake linings, clutch facing, and brake pads, due to their excellent heat resistance and durability. Furthermore, the adoption of phenolic molding compounds to reduce vehicle weight and fuel consumption is a noteworthy trend.
- Beyond automotive applications, phenolic resins find extensive use in wood adhesives, molding, and laminates, contributing to their growing demand.
Prevailing Industry Trends & Opportunities
The emerging trend in the market involves the gradual replacement of phenolic resins with alternative materials in manufacturing processes. An increasing number of substitutes for phenolic resins are being introduced.
- The market is undergoing significant transformation as the industry seeks to address health and environmental concerns associated with traditional formaldehyde-based resins. Formaldehyde, a known carcinogen, poses health hazards and has led to the exploration of alternative, sustainable, and non-toxic solutions. One such potential substitute is 5-hydroxymethylfurfural (5-HMF), a bio-based compound derived from renewable resources. This growth is driven by the increasing demand for eco-friendly and cost-effective alternatives to traditional phenolic resins.
- The production of bio-based lignin-HMF resins is a promising development, aiming to fully replace formaldehyde in urea-formaldehyde (UF), melamine-formaldehyde (MF), and phenol-formaldehyde (PF) resins. This shift towards more sustainable and health-conscious alternatives is expected to lead to faster product rollouts, improved regulatory compliance, and cost optimization in various sectors, including automotive, construction, and packaging.
Significant Market Challenges
The volatility of crude oil prices poses a significant challenge to the growth of the industry.
- Phenolic resins, derived from the polymerization of phenol and formaldehyde, are essential components in various industries. The production of phenolic resins relies on phenols, which are obtained from the distillation of crude oil. The price volatility of crude oil significantly influences the cost of phenolic resins due to the dependence of phenols on petrochemicals. This market trend has necessitated strategic responses from manufacturers, including cost-cutting measures and process optimization, to mitigate the impact of fluctuating raw material prices.
- The intricate relationship between crude oil and phenolic resins underscores the dynamic nature of this market.
In-Depth Market Segmentation: Phenolic Resin Market
The phenolic resin industry research report provides comprehensive data (region-wise segment analysis), with forecasts and estimates in "USD million" for the period 2025-2029, as well as historical data from 2019-2023 for the following segments.
- Product
- Novolac resin
- Resol resin
- Others
- Application
- Molding
- Insulation
- Wood adhesives
- Laminates
- Others
- End-user
- Construction
- Automotive
- Electronics
- Furniture
- Industrial machinery
- Geography
- North America
- US
- Canada
- Mexico
- Europe
- Germany
- UK
- APAC
- Australia
- China
- India
- Japan
- South Korea
- Rest of World (ROW)
- North America
By Product Insights
The novolac resin segment is estimated to witness significant growth during the forecast period.
Novolac resins, a type of phenol-formaldehyde thermoplastic obtained through acid catalysis, exhibit remarkable properties such as water resistance, high heat resistance, and chemical resistance. These resins undergo polymerization using acidic catalysts like hydrochloric acid, oxalic acid, or sulfonate acid, making them insoluble in water. Novolacs find extensive applications in various industries, including refractories, friction, abrasives, felt binding, wood molding, and electronics. The market for novolac resins is poised for significant growth, with a projected CAGR of over 6%, driven by their functionalities and superior performance. In the realm of insulation, novolacs offer exceptional heat resistance and strength, making them a preferred choice.
The laminate fabrication process involves anionic polymerization and cationic polymerization, which contribute to the high crosslinking density of novolac resins. Additionally, their molecular weight distribution and viscosity and rheology properties are crucial factors in their manufacturing process. Novolac resins are also subjected to various testing methods, such as fracture toughness testing, mechanical strength testing, and curing kinetics modeling, to ensure their quality and performance. Techniques like x-ray diffraction analysis, thermogravimetric analysis, and differential scanning calorimetry are employed to analyze their properties, while high-performance liquid chromatography and transmission electron microscopy provide insights into their molecular structure. Novolac resins' chemical resistance data, thermal stability analysis, and glass transition temperature further highlight their versatility and value in various applications.
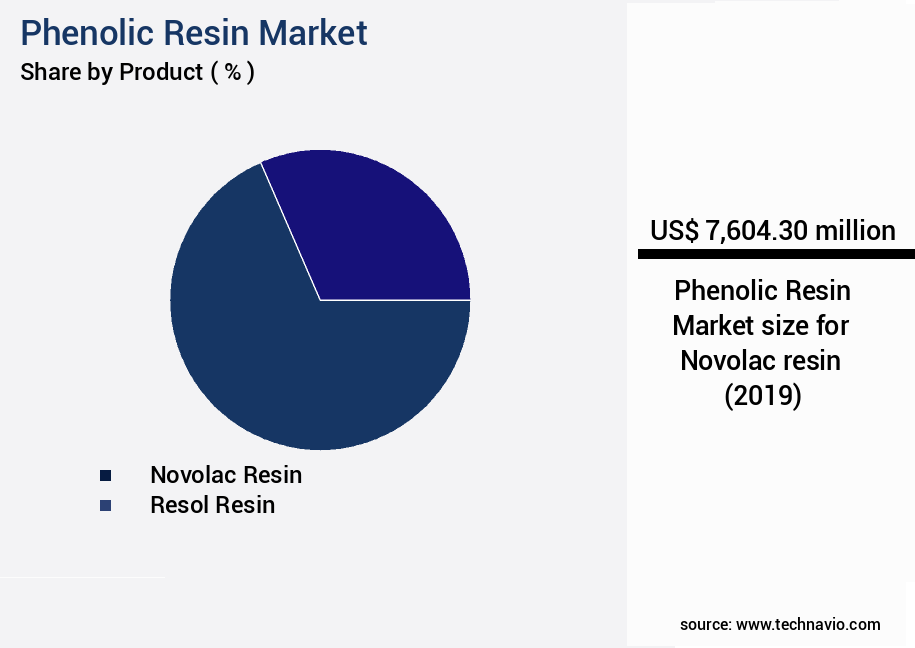
The Novolac resin segment was valued at USD 7.6 billion in 2019 and showed a gradual increase during the forecast period.
Regional Analysis
APAC is estimated to contribute 56% to the growth of the global market during the forecast period.Technavio's analysts have elaborately explained the regional trends and drivers that shape the market during the forecast period.

See How Phenolic Resin Market Demand is Rising in APAC Request Free Sample
The market is experiencing significant evolution, with the Asia-Pacific region leading the charge. This dynamic growth is driven by the region's expansive industrial base, which includes established chemical production capabilities, and its evolving regulatory frameworks. The manufacturing infrastructure in countries like China and India will continue to support the consistent growth of phenolic resin consumption. Rising investments in construction, automotive, and electronics industries will further fuel demand for phenolic resins due to their superior thermal stability, mechanical strength, and chemical resistance. In the construction sector, phenolic resins are increasingly used in insulation, coatings, and adhesives, thanks to government initiatives aimed at infrastructure modernization and industrial development.
The automotive industry's shift towards lightweight materials and sustainability will also boost phenolic resin demand. For instance, phenolic resins are used in the production of engine parts, electrical components, and body panels due to their excellent heat resistance and durability. In the electronics industry, phenolic resins are used in the production of printed circuit boards and insulators, owing to their dielectric properties. Moreover, the region's focus on sustainability and environmental compliance will influence the adoption of modified phenolic formulations that align with evolving standards. According to industry reports, the Asia-Pacific the market is projected to grow at a compound annual growth rate (CAGR) of over 5% between 2021 and 2028.
This growth will be driven by the increasing demand for phenolic resins in various end-use sectors and the region's robust industrial growth.
Customer Landscape of Phenolic Resin Industry
Competitive Intelligence by Technavio Analysis: Leading Players in the Phenolic Resin Market
Companies are implementing various strategies, such as strategic alliances, phenolic resin market forecast, partnerships, mergers and acquisitions, geographical expansion, and product/service launches, to enhance their presence in the industry.
Akrochem Corp. - This company specializes in the production and supply of various phenolic resins, including tackifiers, heat reactive, and terpene types. Their product offerings cater to diverse industries, delivering high-performance solutions for binding and coating applications.
The industry research and growth report includes detailed analyses of the competitive landscape of the market and information about key companies, including:
- Akrochem Corp.
- Ashland Inc.
- Bakelite GmbH
- BASF SE
- Bostik Ltd.
- DIC Corp.
- DL Chemical
- Georgia Pacific LLC
- Hexcel Corp.
- Jinan Shengquan Group Share Holding Co Ltd.
- Kolon Industries Inc.
- Momentive Performance Materials
- Prefere Resins Holding GmbH
- Sasol Ltd.
- Shandong Laiwu Runda New Material Co. Ltd.
- SI Group Inc.
- Sumitomo Bakelite Co. Ltd.
Qualitative and quantitative analysis of companies has been conducted to help clients understand the wider business environment as well as the strengths and weaknesses of key industry players. Data is qualitatively analyzed to categorize companies as pure play, category-focused, industry-focused, and diversified; it is quantitatively analyzed to categorize companies as dominant, leading, strong, tentative, and weak.
Recent Development and News in Phenolic Resin Market
- In August 2024, BASF SE, a leading chemical producer, announced the expansion of its phenolic resin production capacity at its site in Ludwigshafen, Germany. This expansion was aimed at catering to the growing demand for phenolic resins in various industries, including automotive and construction (BASF press release, August 2024).
- In October 2024, Ashland Global Holdings Inc. And Momentive Performance Materials Inc. Merged, creating a leading global specialty materials company. The merged entity, named Ashland Specialty Ingredients, significantly expanded its phenolic resin offerings through the combination of Momentive's Phenolic Specialties business and Ashland's Composite Polymers business (Ashland press release, October 2024).
- In January 2025, Covestro AG, a leading polymer manufacturer, received approval from the European Commission for its new phenolic resin production facility in Poland. The €300 million project is expected to increase Covestro's global phenolic resin capacity by 50% and create around 250 new jobs (Covestro press release, January 2025).
- In May 2025, Hexion Inc., a global specialty chemicals company, introduced a new line of phenolic resins, branded as "Versamid Eco-Friendly Phenolics." These new resins offer reduced carbon footprint and improved sustainability, addressing the increasing demand for eco-friendly materials in various industries (Hexion press release, May 2025).
Dive into Technavio's robust research methodology, blending expert interviews, extensive data synthesis, and validated models for unparalleled Phenolic Resin Market insights. See full methodology.
|
Market Scope |
|
|
Report Coverage |
Details |
|
Page number |
233 |
|
Base year |
2024 |
|
Historic period |
2019-2023 |
|
Forecast period |
2025-2029 |
|
Growth momentum & CAGR |
Accelerate at a CAGR of 5.4% |
|
Market growth 2025-2029 |
USD 4558.8 million |
|
Market structure |
Fragmented |
|
YoY growth 2024-2025(%) |
5.0 |
|
Key countries |
US, Japan, China, India, South Korea, Canada, Australia, Germany, UK, and Mexico |
|
Competitive landscape |
Leading Companies, Market Positioning of Companies, Competitive Strategies, and Industry Risks |
Why Choose Technavio for Phenolic Resin Market Insights?
"Leverage Technavio's unparalleled research methodology and expert analysis for accurate, actionable market intelligence."
The market is experiencing significant growth due to the versatility and high performance of these materials in various industries. Novolac resin thermal degradation kinetics and resole resin crosslinking mechanism studies continue to be areas of active research, as understanding these fundamental properties is crucial for optimizing the phenol formaldeyde reaction and enhancing the epoxy resin blend's mechanical properties. The resin curing cycle's impact on mechanical strength and mold design parameters' influence on cure are critical factors in producing high-quality phenolic resin products. Processing temperature plays a pivotal role in determining the material's thermal properties, making it essential to consider when designing material property databases for resin selection.
Quality control metrics for resin production are rigorously implemented to ensure consistency and reliability. Application-specific grades of phenolic resins cater to various industries, including automotive, construction, and electrical, with each requiring specific properties. Service life prediction for molded parts and durability and longevity testing methods are essential for assessing the long-term performance of phenolic materials. Recyclability assessment of phenolic materials is gaining importance as sustainability becomes a priority, while toxicity and safety data for resin handling are crucial for ensuring worker safety. Environmental impact studies of resin production and scale-up methods for phenolic resins are critical areas of research, with a focus on cost-effective formulations for industrial applications. Advanced material characterization techniques and structural performance analysis of composite materials provide valuable insights into the material's properties and failure mode analysis of phenolic resin components ensure optimal product design.
What are the Key Data Covered in this Phenolic Resin Market Research and Growth Report?
-
What is the expected growth of the Phenolic Resin Market between 2025 and 2029?
-
USD 4.56 billion, at a CAGR of 5.4%
-
-
What segmentation does the market report cover?
-
The report is segmented by Product (Novolac resin, Resol resin, and Others), Application (Molding, Insulation, Wood adhesives, Laminates, and Others), End-user (Construction, Automotive, Electronics, Furniture, and Industrial machinery), and Geography (APAC, North America, Europe, South America, and Middle East and Africa)
-
-
Which regions are analyzed in the report?
-
APAC, North America, Europe, South America, and Middle East and Africa
-
-
What are the key growth drivers and market challenges?
-
Increasing demand for phenolic resins in automotive industry, Fluctuations in crude oil prices
-
-
Who are the major players in the Phenolic Resin Market?
-
Akrochem Corp., Ashland Inc., Bakelite GmbH, BASF SE, Bostik Ltd., DIC Corp., DL Chemical, Georgia Pacific LLC, Hexcel Corp., Jinan Shengquan Group Share Holding Co Ltd., Kolon Industries Inc., Momentive Performance Materials, Prefere Resins Holding GmbH, Sasol Ltd., Shandong Laiwu Runda New Material Co. Ltd., SI Group Inc., and Sumitomo Bakelite Co. Ltd.
-
We can help! Our analysts can customize this phenolic resin market research report to meet your requirements.
 RIA -
RIA - 
