Global Plastic Fillers Market by Application, Type and Geography - Forecast and Analysis 2022-2026

Global Plastic Fillers Market by Application, Type and Geography - Forecast and Analysis 2022-2026

Published: Aug 2022 163 Pages SKU: IRTNTR44444

Market Overview at a Glance

$5571.52 thousand t
Market Opportunity
4.78%
CAGR
4.3
YoY growth 2021-2022(%)

Plastic Fillers Market Size 2022 - 2026

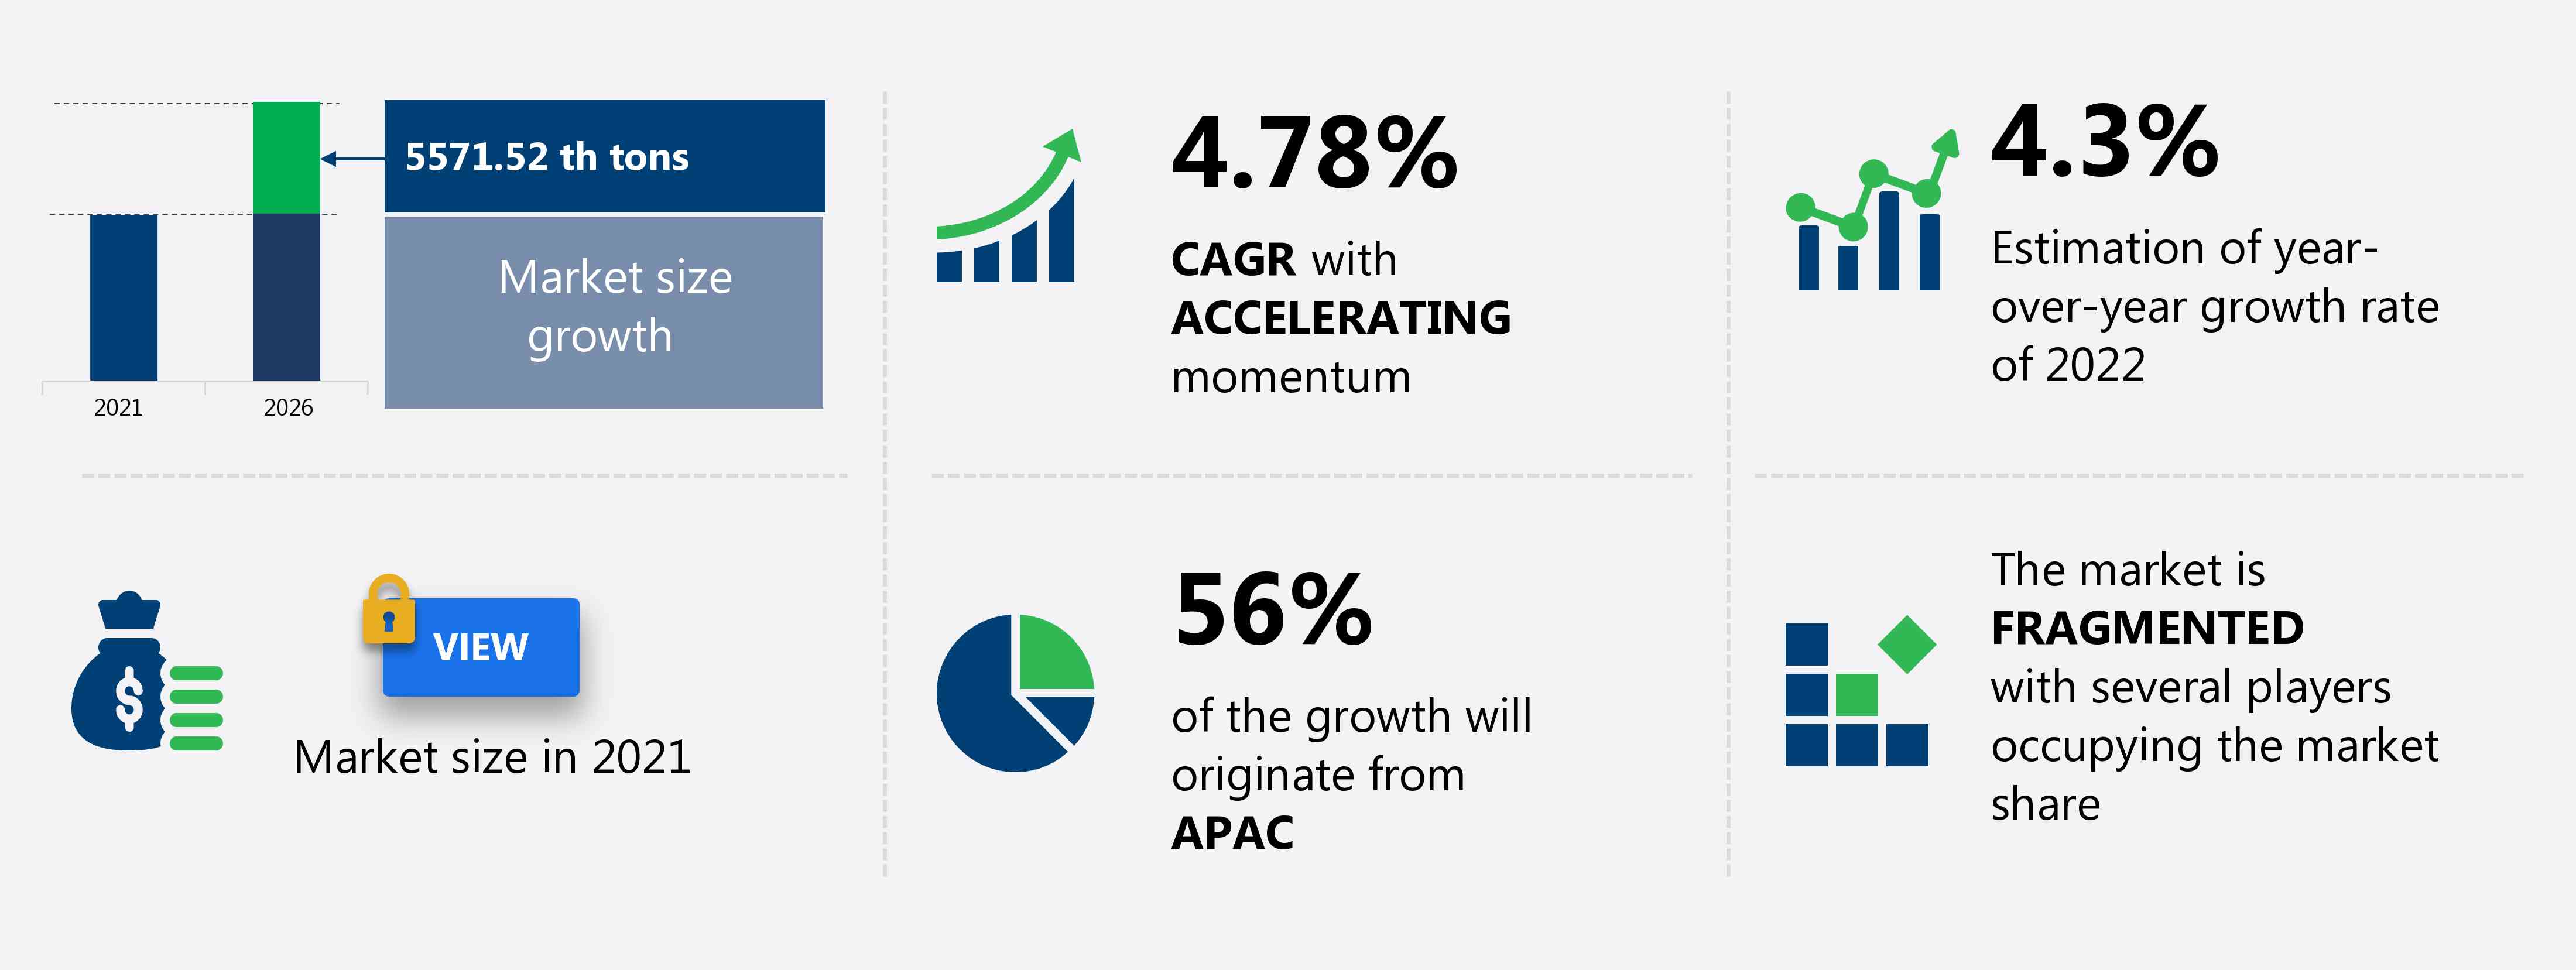
The plastic fillers market share is expected to increase by 5571.52 thousand tons from 2021 to 2026, and the market's growth momentum will accelerate at a CAGR of 4.78%. The plastic fillers market is evolving rapidly as industries seek more cost-effective solutions and sustainable alternatives to traditional materials. Plastic filler manufacturers are increasingly focusing on plastic material innovation, offering a variety of plastic fillers that enhance the properties of plastic composites used in a wide range of applications, from automotive lightweighting to sustainable construction. These plastic fillers serve to improve the mechanical properties, thermal properties, and chemical resistance of plastics, making them ideal for high-performance applications in sectors like aerospace, automotive, and green building materials.

One of the major trends in the plastic filler market is the growing demand for sustainable plastic materials. As industries push toward environmental sustainability, the use of biodegradable plastic fillers, bio-based fillers, and recycled plastic fillers has gained prominence. These fillers, derived from renewable resources, not only reduce plastic waste but also contribute to a circular economy by repurposing plastic waste into valuable materials. Plastic filler research is also focused on the development of eco-friendly composites that can be used in green construction and green technology applications. By utilizing bio-based polymers and biopolymer composites, manufacturers are able to create lightweight construction materials with improved corrosion resistance and thermal insulation properties.

What will the Plastic Fillers Market Size be During the Forecast Period?

Plastic Fillers Market Size

Download Report Sample

The development of plastic filler technology has also opened new doors for the plastic material engineering field. The integration of advanced fillers improves the performance of materials in energy-efficient applications, such as in electric vehicle materials and sustainable transportation. The automotive industry, for instance, is leveraging these fillers to create lightweight vehicles that reduce fuel consumption and emissions reduction. Plastic reinforcement with fillers also enhances the structural integrity of materials, making them ideal for high-performance composites and structural composites in industries like aerospace, construction, and durable flooring.

Plastic filler suppliers are also driving the market's growth by offering a variety of plastic filler benefits, such as improved thermal properties, chemical resistance, and increased durability. The increasing demand for green building materials and eco-friendly fillers in construction, especially in sustainable building materials, has contributed to the growth of the market. Sustainable construction methods, which incorporate plastic material selection and lightweight construction techniques, are being adopted worldwide as part of broader environmental impact reduction strategies.

Plastic Fillers Market Dynamic

The stringent environmental regulations are notably driving the plastic fillers market growth, although factors such as concerns related to plastic disposal may impede the market growth. Our research analysts have studied the historical data and deduced the key market drivers and the COVID-19 pandemic impact on the plastic fillers industry. The holistic analysis of the drivers will help in deducing end goals and refining marketing strategies to gain a competitive edge.

One of the biggest drivers of the market is the increasing focus on sustainability and the reduction of microplastics in the environment. Recycled microplastic fillers are becoming more popular as they offer a low-cost, readily available solution for creating durable materials without contributing to plastic waste. By using recycled microplastic fillers, manufacturers can help reduce the accumulation of plastic disposals in landfills and oceans, addressing environmental concerns about microplastics and their impact on ecosystems. Moreover, plastic filler suppliers are working to meet regulatory parameters and government requirements by offering more biodegradable and sustainable plastic fillers that comply with strict environmental guidelines.The use of polyurethane-based and epoxy-based fillers is also gaining ground in industries requiring materials with high-performance properties. These fillers enhance chemical resistance, electrical conductivity, and thermal stability, making them ideal for aerospace materials, aircraft interiors, marine industry applications, and even automotive lightweighting. Polyurethane particles and epoxy-based fillers improve the strength, durability, and resistance to chemicals, making them ideal for demanding applications where high strength and durable materials are needed. These fillers also contribute to fuel economy and carbon emissions reduction, aligning with the growing push for green technology and sustainable transportation.

Key Plastic Fillers Market Driver

The stringent environmental regulations is one of the major drivers impacting the plastic fillers market growth. Automotive manufacturers in the US and Europe use lightweight materials to adhere to stringent regulations about vehicular pollution. Automotive vehicles generally emit volatile organic compounds (VOCs) and semi-volatile organic compounds (SVOCs), which are harmful to the environment. Regulatory bodies such as the US Environmental Protection Agency (EPA) have directed automotive OEMs in the US to reduce VOC and SVOC emissions. In China and Europe, there are strict guidelines for controlling VOCs and SVOCs. Lightweight plastics are used as substitutes for metals in automotive parts as they reduce the overall weight of the vehicle and control emissions, along with increasing fuel efficiency. American and European OEMs are improvising automotive interiors to comply with emission standards. Automobile companies use polypropylene composites (both mineral and glass filled) to adhere to standard emissions. Base polypropylenes, additives, and compounding technology must adhere to standard emissions.

Key Plastic Fillers Market Trend

The growing interest in bioplastics is one of the major trends influencing the plastic fillers market growth. Bio-plastics consist of bio-based content, which is biodegradable. Polymers such as polylactic acid (PLA), polyhydroxyalkanoates (PHA), bio poly trimethyl terephthalate (bio PTT), and bio propanediol (bio PDO) are some of the popular bioplastics. These plastics are developed from renewable materials such as biomass and save up to 40% energy during production in comparison to their petrochemical counterparts. Bioplastics play a crucial role in the development of the plastic industry. An increase in environmental awareness, government support and funding, growing vendor interest, and their R&D spending on bioplastics are leading to the increased use of organic fillers in plastics and bioplastics, which will result in the growth of the plastic fillers market during the forecast period.

Key Plastic Fillers Market Challenge

Concerns related to plastic disposal is one of the major challenges impeding the plastic fillers market growth. As most plastics are derived from oil and are non-biodegradable, disposal can be a serious challenge. Unlike organic wastes, plastics do not decompose and last for centuries. Manufacturers and end-users discard various types of plastics, which must be collected, transported, sorted, degreased, and washed. Lack of proper recycling has a severe impact on the environment. Plastics are often used to produce disposable packaging products and several other items, which are discarded in less than a year of manufacture. Globally, these polymers accumulate as waste in landfills and natural habitats because of their exceptional durability. Challenges associated with plastic disposal can reduce the demand for plastic fillers and thereby hamper the growth of the market during the forecast period.

This plastic fillers market analysis report also provides detailed information on other upcoming trends and challenges that will have a far-reaching effect on the market growth. The actionable insights on the trends and challenges will help companies evaluate and develop growth strategies for 2022-2026.

Parent Market Analysis

Technavio categorizes the global plastic fillers market as a part of the global commodity chemicals market. Our research report has extensively covered external factors influencing the parent market growth potential in the coming years, which will determine the levels of growth of the plastic fillers market during the forecast period.

Who are the Major Plastic Fillers Market Vendors?

The report analyzes the market's competitive landscape and offers information on several market vendors, including:

  • BASF SE
  • Cabot Corp.
  • Calcinor SA
  • Elementis Plc
  • Evonik Industries AG
  • Exxon Mobil Corp.
  • GCR Group
  • Gustav Grolman GmbH and Co. KG
  • Hoffmann Mineral GmbH
  • Imerys S.A.
  • J M Huber Corp.
  • Lhoist Group
  • MAHAVEER CERAMIC INDUSTRIES
  • Minerals Technologies Inc.
  • Omya International AG
  • Pigmentum s.r.o.
  • Quartz Works GmbH
  • SCR Sibelco NV
  • Standridge Color Corp
  • Thiele Kaolin Co.

This statistical study of the plastic fillers market encompasses successful business strategies deployed by the key vendors. The plastic fillers market is fragmented and the vendors are deploying organic and inorganic growth strategies to compete in the market.

Product Insights and News

  • Basf - The company offers plastic fillers product brands such as VALERAS

To make the most of the opportunities and recover from the post-COVID-19 impact, market vendors should focus more on the growth prospects in the fast-growing segments, while maintaining their positions in the slow-growing segments.

The plastic fillers market forecast report offers in-depth insights into key vendor profiles. The profiles include information on the production, sustainability, and prospects of the leading companies.

Plastic Fillers Market Value Chain Analysis

Our report provides extensive information on the value chain analysis for the plastic fillers market, which vendors can leverage to gain a competitive advantage during the forecast period. The end-to-end understanding of the value chain is essential in profit margin optimization and evaluation of business strategies. The data available in our value chain analysis segment can help vendors drive costs and enhance customer services during the forecast period.

Which are the Key Regions for the Plastic Fillers Market?

Plastic Fillers Market Share by Geography

For more insights on the market share of various regions Request PDF Sample now!

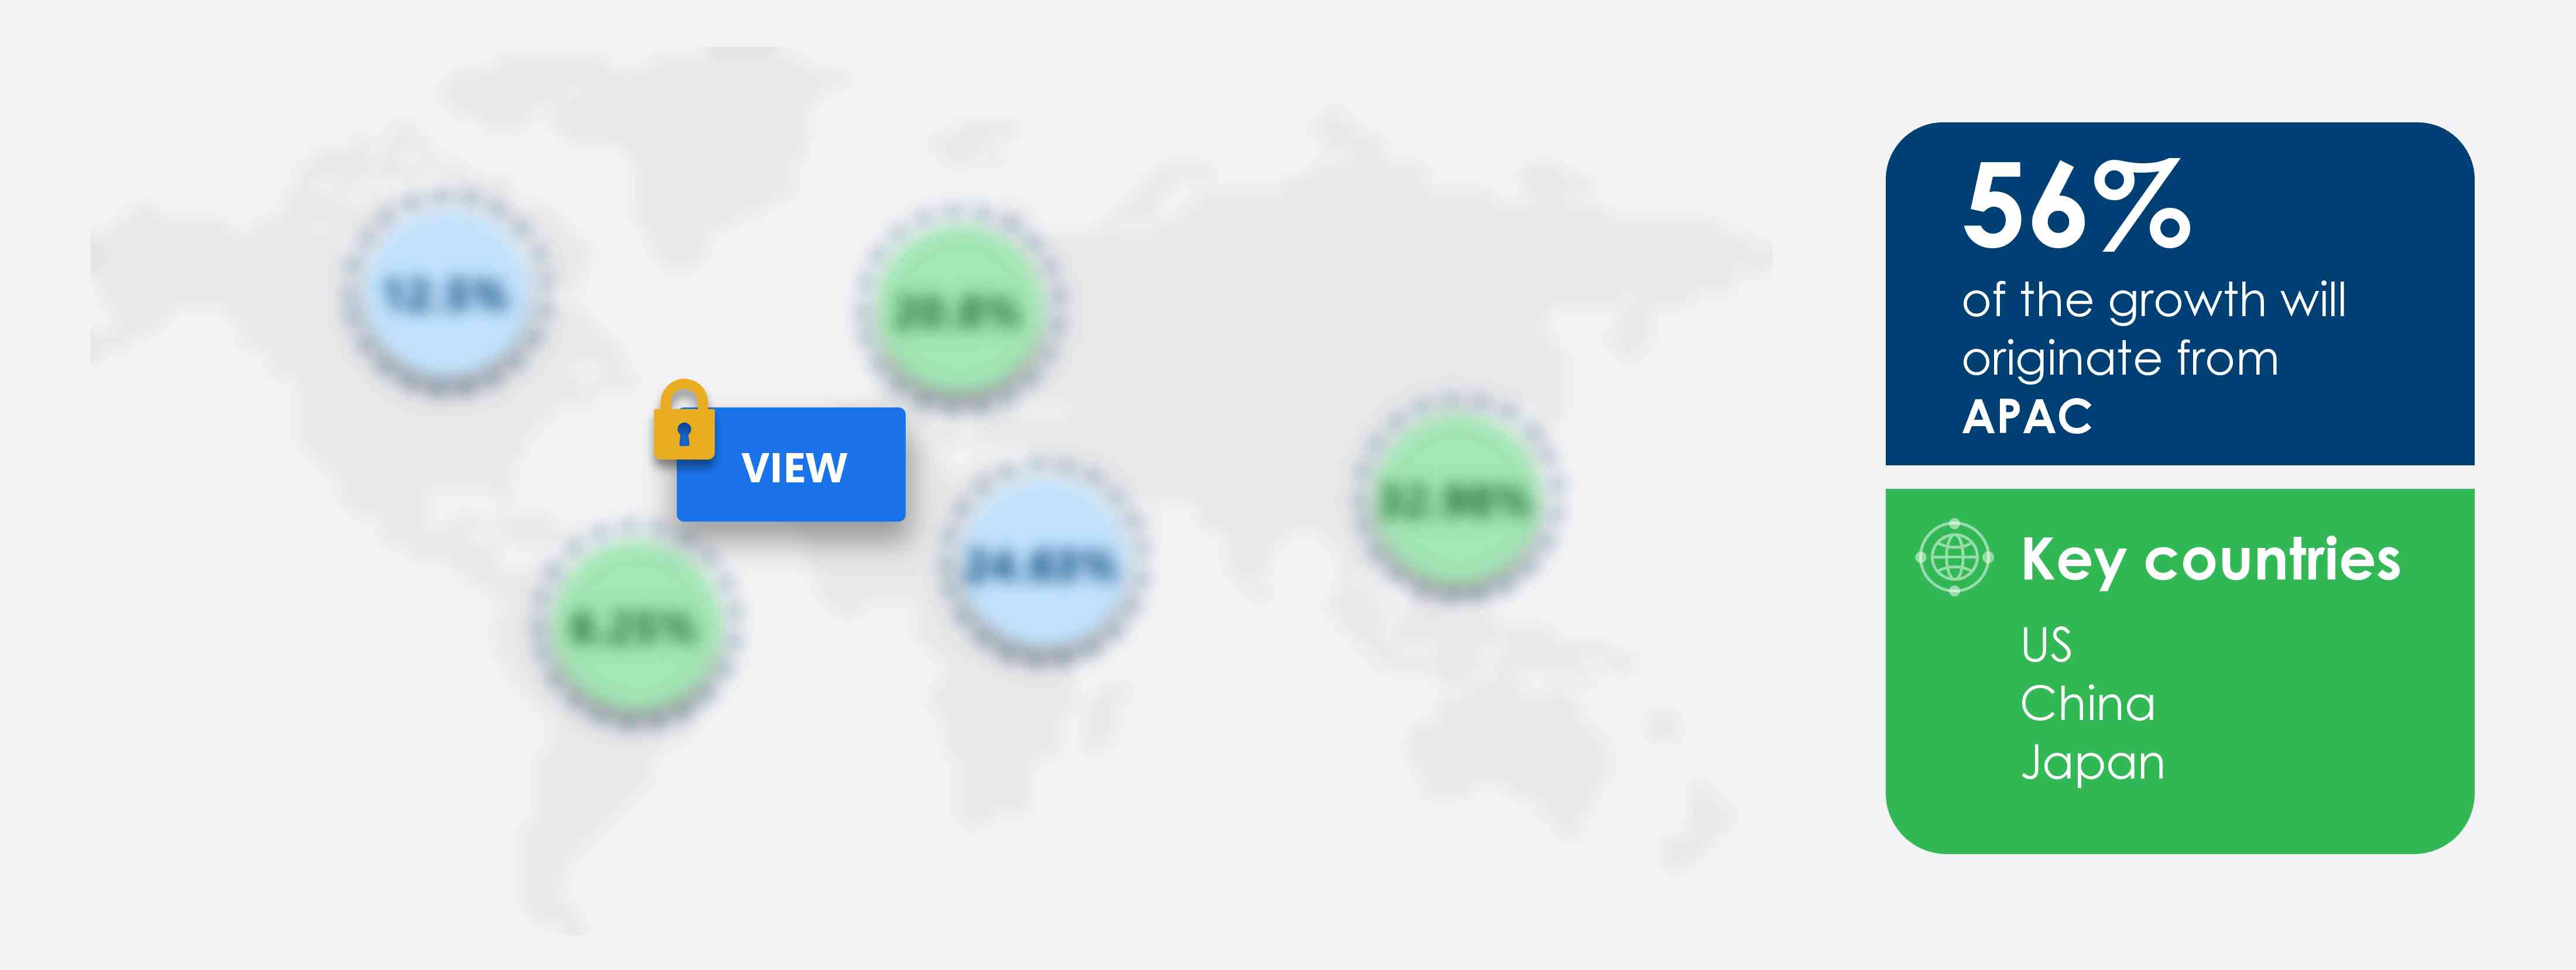
56% of the market's growth will originate from APAC during the forecast period. China is one of the key markets for plastic fillers in APAC. Market growth in this region will be faster than the growth of the market in other regions.

The growth in end-use industries such as automotive, manufacturing, industrial, packaging, and others will facilitate the plastic fillers market growth in APAC over the forecast period. This market research report entails detailed information on the competitive intelligence, marketing gaps, and regional opportunities in store for vendors, which will assist in creating efficient business plans.

COVID Impact and Recovery Analysis

The lockdowns and other restrictions in various countries, such as India, China, Japan, Bangladesh, Australia, and Vietnam, were lifted in the second half of 2020 due to the initiation of vaccination programs. The operations in various industries, such as building and construction, automobiles, electronics, and other industries, resumed, which increased the demand for plastic fillers in the second half of 2021. Additionally, with the increasing urbanization and development in the region, industrial and construction activities have also been growing significantly. Thus all these factors will drive the growth of the regional plastic fillers market in APAC during the forecast period.

What are the Revenue-generating Application Segments in the Plastic Fillers Market?

Plastic Fillers Market Share

To gain further insights on the market contribution of various segments Request a PDF Sample

The plastic fillers market share growth in the inorganic fillers segment will be significant during the forecast period. Inorganic plastic fillers have been traditionally used because of their easy availability and superior properties. However, the plastic fillers market share growth by the inorganic fillers segment will be slower than the growth of the market by the organic fillers segment.

This report provides an accurate prediction of the contribution of all the segments to the growth of the plastic fillers market size and actionable market insights on the post-COVID-19 impact on each segment.

You may be interested in:

Polymer Fillers market - The market size has the potential to grow by USD 11.70 billion during 2021-2025, and the market's growth momentum will accelerate at a CAGR of 4.13%. 

Dermal Facial Fillers market - The market size is expected to grow by USD 1.45 billion, at a CAGR of 9.14%, during 2020-2025. 

Reserach Analyst Overview

Plastic fillers are crucial in the development of plastic material applications in multiple industries. Whether used in plastic product design, plastic material research, or for specific uses like fire retardant materials or durable flooring, the versatility of fillers makes them essential to a wide array of sectors. The plastic industry trends are shifting toward innovation in materials that are not only high-performance but also environmentally conscious. This is evident in the growing popularity of bio-based composites, polymer modification, and plastic material science research that focus on creating more energy-efficient and environmentally friendly solutions.

The future of the plastic fillers market lies in further research and development to create advanced materials that meet the evolving demands of industries aiming for sustainable plastic materials. As plastic waste reduction becomes a key priority, plastic filler development will continue to play a critical role in creating high-performance composites for green transportation, sustainable construction, and other environmentally conscious sectors. The use of renewable resources, coupled with plastic filler technology, will help foster the shift toward a more sustainable and eco-friendly future, aligning with global goals for environmental impact reduction and emissions reduction. In conclusion, the plastic fillers market is poised for continued growth as plastic material science advances and industries focus on creating sustainable, cost-effective, and eco-friendly composites. With increasing demand for biodegradable plastics, plastic reinforcement, and lightweight construction materials, the market is positioned to drive the future of manufacturing and design in sectors like automotive, aerospace, and green construction.

Plastic Fillers Market Scope

Report Coverage

Details

Page number

120

Base year

2021

Forecast period

2022-2026

Growth momentum & CAGR

Accelerate at a CAGR of 4.78%

Market growth 2022-2026

5571.52 thousand tons

Market structure

Fragmented

YoY growth (%)

4.3

Regional analysis

APAC, Europe, North America, Middle East and Africa, and South America

Performing market contribution

APAC at 56%

Key consumer countries

US, China, Japan, India, Germany, and UK

Competitive landscape

Leading companies, Competitive strategies, Consumer engagement scope

Key companies profiled

BASF SE, Cabot Corp., Calcinor SA, Elementis Plc, Evonik Industries AG, Exxon Mobil Corp., GCR Group, Gustav Grolman GmbH, and Co. KG, Hoffmann Mineral GmbH, Imerys S.A., J M Huber Corp., Lhoist Group, MAHAVEER CERAMIC INDUSTRIES, Minerals Technologies Inc., Omya International AG, Pigmentum s.r.o., Quartz Works GmbH, SCR Sibelco NV, Standridge Color Corp, and Thiele Kaolin Co. 

Market dynamics

Parent market analysis, Market growth inducers and obstacles, Fast-growing and slow-growing segment analysis, COVID-19 impact and recovery analysis and future consumer dynamics, and Market condition analysis for the forecast period.

Customization purview

If our report has not included the data that you are looking for, you can reach out to our analysts and get segments customized.

Request PDF sample

What are the Key Data Covered in this Plastic Fillers Market Report?

  • CAGR of the market during the forecast period 2022-2026
  • Detailed information on factors that will drive plastic fillers market growth during the next five years
  • Precise estimation of the plastic fillers market size and its contribution to the parent market
  • Accurate predictions on upcoming trends and changes in consumer behavior
  • The growth of the plastic fillers industry across APAC, Europe, North America, Middle East, Africa, and South America
  • A thorough analysis of the market's competitive landscape and detailed information on vendors
  • Comprehensive details of factors that will challenge the growth of plastic fillers market vendors

We can help! Our analysts can customize this report to meet your requirements. Get in touch

1 Executive Summary

  • 1.1 Market overview
    • Exhibit 01: Executive Summary – Chart on Market Overview
    • Exhibit 02: Executive Summary – Data Table on Market Overview
    • Exhibit 03: Executive Summary – Chart on Global Market Characteristics
    • Exhibit 04: Executive Summary – Chart on Market by Geography
    • Exhibit 05: Executive Summary – Chart on Market Segmentation by Application
    • Exhibit 06: Executive Summary – Chart on Market Segmentation by Type
    • Exhibit 07: Executive Summary – Chart on Incremental Growth
    • Exhibit 08: Executive Summary – Data Table on Incremental Growth
    • Exhibit 09: Executive Summary – Chart on Vendor Market Positioning

2 Market Landscape

  • 2.1 Market ecosystem
    • Exhibit 10: Parent market
    • Exhibit 11: Market Characteristics

3 Market Sizing

  • 3.1 Market definition
    • Exhibit 12: Offerings of vendors included in the market definition
  • 3.2 Market segment analysis
    • Exhibit 13: Market segments
  • 3.3 Market size 2021
    • 3.4 Market outlook: Forecast for 2021-2026
      • Exhibit 14: Chart on Global - Market size and forecast 2021-2026 (thousand t)
      • Exhibit 15: Data Table on Global - Market size and forecast 2021-2026 (thousand t)
      • Exhibit 16: Chart on Global Market- Year-over-year growth 2021-2026 (%)
      • Exhibit 17: Data Table on Global Market- Year-over-year growth 2021-2026 (%)

    4 Five Forces Analysis

    • 4.1 Five forces summary
      • Exhibit 18: Five forces analysis - Comparison between 2021 and 2026
    • 4.2 Bargaining power of buyers
      • Exhibit 19: Chart on Bargaining power of buyers – Impact of key factors 2021 and 2026
    • 4.3 Bargaining power of suppliers
      • Exhibit 20: Bargaining power of suppliers – Impact of key factors in 2021 and 2026
    • 4.4 Threat of new entrants
      • Exhibit 21: Threat of new entrants – Impact of key factors in 2021 and 2026
    • 4.5 Threat of substitutes
      • Exhibit 22: Threat of substitutes – Impact of key factors in 2021 and 2026
    • 4.6 Threat of rivalry
      • Exhibit 23: Threat of rivalry – Impact of key factors in 2021 and 2026
    • 4.7 Market condition
      • Exhibit 24: Chart on Market condition - Five forces 2021 and 2026

    5 Market Segmentation by Application

    • 5.1 Market segments
      • Exhibit 25: Chart on Application - Market share 2021-2026 (%)
      • Exhibit 26: Data Table on Application - Market share 2021-2026 (%)
    • 5.2 Comparison by Application
      • Exhibit 27: Chart on Comparison by Application
      • Exhibit 28: Data Table on Comparison by Application
    • 5.3 Automotive - Market size and forecast 2021-2026
      • Exhibit 29: Chart on Automotive - Market size and forecast 2021-2026 (thousand t)
      • Exhibit 30: Data Table on Automotive - Market size and forecast 2021-2026 (thousand t)
      • Exhibit 31: Chart on Automotive - Year-over-year growth 2021-2026 (%)
      • Exhibit 32: Data Table on Automotive - Year-over-year growth 2021-2026 (%)
    • 5.4 Electrical and electronics - Market size and forecast 2021-2026
      • Exhibit 33: Chart on Electrical and electronics - Market size and forecast 2021-2026 (thousand t)
      • Exhibit 34: Data Table on Electrical and electronics - Market size and forecast 2021-2026 (thousand t)
      • Exhibit 35: Chart on Electrical and electronics - Year-over-year growth 2021-2026 (%)
      • Exhibit 36: Data Table on Electrical and electronics - Year-over-year growth 2021-2026 (%)
    • 5.5 Building and construction - Market size and forecast 2021-2026
      • Exhibit 37: Chart on Building and construction - Market size and forecast 2021-2026 (thousand t)
      • Exhibit 38: Data Table on Building and construction - Market size and forecast 2021-2026 (thousand t)
      • Exhibit 39: Chart on Building and construction - Year-over-year growth 2021-2026 (%)
      • Exhibit 40: Data Table on Building and construction - Year-over-year growth 2021-2026 (%)
    • 5.6 Packaging - Market size and forecast 2021-2026
      • Exhibit 41: Chart on Packaging - Market size and forecast 2021-2026 (thousand t)
      • Exhibit 42: Data Table on Packaging - Market size and forecast 2021-2026 (thousand t)
      • Exhibit 43: Chart on Packaging - Year-over-year growth 2021-2026 (%)
      • Exhibit 44: Data Table on Packaging - Year-over-year growth 2021-2026 (%)
    • 5.7 Others - Market size and forecast 2021-2026
      • Exhibit 45: Chart on Others - Market size and forecast 2021-2026 (thousand t)
      • Exhibit 46: Data Table on Others - Market size and forecast 2021-2026 (thousand t)
      • Exhibit 47: Chart on Others - Year-over-year growth 2021-2026 (%)
      • Exhibit 48: Data Table on Others - Year-over-year growth 2021-2026 (%)
    • 5.8 Market opportunity by Application
      • Exhibit 49: Market opportunity by Application (thousand t)

    6 Market Segmentation by Type

    • 6.1 Market segments
      • Exhibit 50: Chart on Type - Market share 2021-2026 (%)
      • Exhibit 51: Data Table on Type - Market share 2021-2026 (%)
    • 6.2 Comparison by Type
      • Exhibit 52: Chart on Comparison by Type
      • Exhibit 53: Data Table on Comparison by Type
    • 6.3 Inorganic fillers - Market size and forecast 2021-2026
      • Exhibit 54: Chart on Inorganic fillers - Market size and forecast 2021-2026 (thousand t)
      • Exhibit 55: Data Table on Inorganic fillers - Market size and forecast 2021-2026 (thousand t)
      • Exhibit 56: Chart on Inorganic fillers - Year-over-year growth 2021-2026 (%)
      • Exhibit 57: Data Table on Inorganic fillers - Year-over-year growth 2021-2026 (%)
    • 6.4 Organic fillers - Market size and forecast 2021-2026
      • Exhibit 58: Chart on Organic fillers - Market size and forecast 2021-2026 (thousand t)
      • Exhibit 59: Data Table on Organic fillers - Market size and forecast 2021-2026 (thousand t)
      • Exhibit 60: Chart on Organic fillers - Year-over-year growth 2021-2026 (%)
      • Exhibit 61: Data Table on Organic fillers - Year-over-year growth 2021-2026 (%)
    • 6.5 Market opportunity by Type
      • Exhibit 62: Market opportunity by Type (thousand t)

    7 Customer Landscape

    • 7.1 Customer landscape overview
      • Exhibit 63: Analysis of price sensitivity, lifecycle, customer purchase basket, adoption rates, and purchase criteria

    8 Geographic Landscape

    • 8.1 Geographic segmentation
      • Exhibit 64: Chart on Market share by geography 2021-2026 (%)
      • Exhibit 65: Data Table on Market share by geography 2021-2026 (%)
    • 8.2 Geographic comparison
      • Exhibit 66: Chart on Geographic comparison
      • Exhibit 67: Data Table on Geographic comparison
    • 8.3 APAC - Market size and forecast 2021-2026
      • Exhibit 68: Chart on APAC - Market size and forecast 2021-2026 (thousand t)
      • Exhibit 69: Data Table on APAC - Market size and forecast 2021-2026 (thousand t)
      • Exhibit 70: Chart on APAC - Year-over-year growth 2021-2026 (%)
      • Exhibit 71: Data Table on APAC - Year-over-year growth 2021-2026 (%)
    • 8.4 Europe - Market size and forecast 2021-2026
      • Exhibit 72: Chart on Europe - Market size and forecast 2021-2026 (thousand t)
      • Exhibit 73: Data Table on Europe - Market size and forecast 2021-2026 (thousand t)
      • Exhibit 74: Chart on Europe - Year-over-year growth 2021-2026 (%)
      • Exhibit 75: Data Table on Europe - Year-over-year growth 2021-2026 (%)
    • 8.5 North America - Market size and forecast 2021-2026
      • Exhibit 76: Chart on North America - Market size and forecast 2021-2026 (thousand t)
      • Exhibit 77: Data Table on North America - Market size and forecast 2021-2026 (thousand t)
      • Exhibit 78: Chart on North America - Year-over-year growth 2021-2026 (%)
      • Exhibit 79: Data Table on North America - Year-over-year growth 2021-2026 (%)
    • 8.6 Middle East and Africa - Market size and forecast 2021-2026
      • Exhibit 80: Chart on Middle East and Africa - Market size and forecast 2021-2026 (thousand t)
      • Exhibit 81: Data Table on Middle East and Africa - Market size and forecast 2021-2026 (thousand t)
      • Exhibit 82: Chart on Middle East and Africa - Year-over-year growth 2021-2026 (%)
      • Exhibit 83: Data Table on Middle East and Africa - Year-over-year growth 2021-2026 (%)
    • 8.7 South America - Market size and forecast 2021-2026
      • Exhibit 84: Chart on South America - Market size and forecast 2021-2026 (thousand t)
      • Exhibit 85: Data Table on South America - Market size and forecast 2021-2026 (thousand t)
      • Exhibit 86: Chart on South America - Year-over-year growth 2021-2026 (%)
      • Exhibit 87: Data Table on South America - Year-over-year growth 2021-2026 (%)
    • 8.8 China - Market size and forecast 2021-2026
      • Exhibit 88: Chart on China - Market size and forecast 2021-2026 (thousand t)
      • Exhibit 89: Data Table on China - Market size and forecast 2021-2026 (thousand t)
      • Exhibit 90: Chart on China - Year-over-year growth 2021-2026 (%)
      • Exhibit 91: Data Table on China - Year-over-year growth 2021-2026 (%)
    • 8.9 US - Market size and forecast 2021-2026
      • Exhibit 92: Chart on US - Market size and forecast 2021-2026 (thousand t)
      • Exhibit 93: Data Table on US - Market size and forecast 2021-2026 (thousand t)
      • Exhibit 94: Chart on US - Year-over-year growth 2021-2026 (%)
      • Exhibit 95: Data Table on US - Year-over-year growth 2021-2026 (%)
    • 8.10 Germany - Market size and forecast 2021-2026
      • Exhibit 96: Chart on Germany - Market size and forecast 2021-2026 (thousand t)
      • Exhibit 97: Data Table on Germany - Market size and forecast 2021-2026 (thousand t)
      • Exhibit 98: Chart on Germany - Year-over-year growth 2021-2026 (%)
      • Exhibit 99: Data Table on Germany - Year-over-year growth 2021-2026 (%)
    • 8.11 Japan - Market size and forecast 2021-2026
      • Exhibit 100: Chart on Japan - Market size and forecast 2021-2026 (thousand t)
      • Exhibit 101: Data Table on Japan - Market size and forecast 2021-2026 (thousand t)
      • Exhibit 102: Chart on Japan - Year-over-year growth 2021-2026 (%)
      • Exhibit 103: Data Table on Japan - Year-over-year growth 2021-2026 (%)
    • 8.12 UK - Market size and forecast 2021-2026
      • Exhibit 104: Chart on UK - Market size and forecast 2021-2026 (thousand t)
      • Exhibit 105: Data Table on UK - Market size and forecast 2021-2026 (thousand t)
      • Exhibit 106: Chart on UK - Year-over-year growth 2021-2026 (%)
      • Exhibit 107: Data Table on UK - Year-over-year growth 2021-2026 (%)
    • 8.13 India - Market size and forecast 2021-2026
      • Exhibit 108: Chart on India - Market size and forecast 2021-2026 (thousand t)
      • Exhibit 109: Data Table on India - Market size and forecast 2021-2026 (thousand t)
      • Exhibit 110: Chart on India - Year-over-year growth 2021-2026 (%)
      • Exhibit 111: Data Table on India - Year-over-year growth 2021-2026 (%)
    • 8.14 Market opportunity by geography
      • Exhibit 112: Market opportunity by geography (thousand t)

    9 Drivers, Challenges, and Trends

    • 9.1 Market drivers
      • 9.2 Market challenges
        • 9.3 Impact of drivers and challenges
          • Exhibit 113: Impact of drivers and challenges in 2021 and 2026
        • 9.4 Market trends

          10 Vendor Landscape

          • 10.1 Overview
            • 10.2 Vendor landscape
              • Exhibit 114: Overview on Criticality of inputs and Factors of differentiation
            • 10.3 Landscape disruption
              • Exhibit 115: Overview on factors of disruption
            • 10.4 Industry risks
              • Exhibit 116: Impact of key risks on business

            11 Vendor Analysis

            • 11.1 Vendors covered
              • Exhibit 117: Vendors covered
            • 11.2 Market positioning of vendors
              • Exhibit 118: Matrix on vendor position and classification
            • 11.3 BASF SE
              • Exhibit 119: BASF SE - Overview
              • Exhibit 120: BASF SE - Business segments
              • Exhibit 121: BASF SE - Key news
              • Exhibit 122: BASF SE - Key offerings
              • Exhibit 123: BASF SE - Segment focus
            • 11.4 Cabot Corp.
              • Exhibit 124: Cabot Corp. - Overview
              • Exhibit 125: Cabot Corp. - Business segments
              • Exhibit 126: Cabot Corp. - Key offerings
              • Exhibit 127: Cabot Corp. - Segment focus
            • 11.5 Calcinor SA
              • Exhibit 128: Calcinor SA - Overview
              • Exhibit 129: Calcinor SA - Product / Service
              • Exhibit 130: Calcinor SA - Key offerings
            • 11.6 Elementis Plc
              • Exhibit 131: Elementis Plc - Overview
              • Exhibit 132: Elementis Plc - Business segments
              • Exhibit 133: Elementis Plc - Key news
              • Exhibit 134: Elementis Plc - Key offerings
              • Exhibit 135: Elementis Plc - Segment focus
            • 11.7 Evonik Industries AG
              • Exhibit 136: Evonik Industries AG - Overview
              • Exhibit 137: Evonik Industries AG - Business segments
              • Exhibit 138: Evonik Industries AG - Key news
              • Exhibit 139: Evonik Industries AG - Key offerings
              • Exhibit 140: Evonik Industries AG - Segment focus
            • 11.8 Exxon Mobil Corp.
              • Exhibit 141: Exxon Mobil Corp. - Overview
              • Exhibit 142: Exxon Mobil Corp. - Business segments
              • Exhibit 143: Exxon Mobil Corp. - Key offerings
              • Exhibit 144: Exxon Mobil Corp. - Segment focus
            • 11.9 Hoffmann Mineral GmbH
              • Exhibit 145: Hoffmann Mineral GmbH - Overview
              • Exhibit 146: Hoffmann Mineral GmbH - Product / Service
              • Exhibit 147: Hoffmann Mineral GmbH - Key offerings
            • 11.10 Imerys S.A.
              • Exhibit 148: Imerys S.A. - Overview
              • Exhibit 149: Imerys S.A. - Business segments
              • Exhibit 150: Imerys S.A. - Key offerings
              • Exhibit 151: Imerys S.A. - Segment focus
            • 11.11 Minerals Technologies Inc.
              • Exhibit 152: Minerals Technologies Inc. - Overview
              • Exhibit 153: Minerals Technologies Inc. - Business segments
              • Exhibit 154: Minerals Technologies Inc. - Key news
              • Exhibit 155: Minerals Technologies Inc. - Key offerings
              • Exhibit 156: Minerals Technologies Inc. - Segment focus
            • 11.12 Omya International AG
              • Exhibit 157: Omya International AG - Overview
              • Exhibit 158: Omya International AG - Product / Service
              • Exhibit 159: Omya International AG - Key offerings

            12 Appendix

            • 12.1 Scope of the report
              • 12.2 Inclusions and exclusions checklist
                • Exhibit 160: Inclusions checklist
                • Exhibit 161: Exclusions checklist
              • 12.3 Currency conversion rates for US$
                • Exhibit 162: Currency conversion rates for US$
              • 12.4 Research methodology
                • Exhibit 163: Research methodology
                • Exhibit 164: Validation techniques employed for market sizing
                • Exhibit 165: Information sources
              • 12.5 List of abbreviations
                • Exhibit 166: List of abbreviations
              • in crude oil prices: The volatility of crude oil prices is one of the key challenges in the global commodity chemicals market. The volatility of crude oil prices impacts the pricing strategies and margins of adhesives, sealants, lubricants, oilfield cleaners, polymers, as well as plastic additives. The margins of the commodity chemicals are inherently dependent on the global prices of crude oil, which is one of the key raw materials. Any volatility in the prices of crude oil causes uncertainty in end-use markets and eventually influences the margins of all the key stakeholders, including the vendors in the global commodity chemicals market. These fluctuations adversely affect the profitability, cost of sales, and the ability of vendors to effectively address the demands of consumers.

                Research Methodology

                Technavio presents a detailed picture of the market by way of study, synthesis, and summation of data from multiple sources. The analysts have presented the various facets of the market with a particular focus on identifying the key industry influencers. The data thus presented is comprehensive, reliable, and the result of extensive research, both primary and secondary.

                INFORMATION SOURCES

                Primary sources

                • Manufacturers and suppliers
                • Channel partners
                • Industry experts
                • Strategic decision makers

                Secondary sources

                • Industry journals and periodicals
                • Government data
                • Financial reports of key industry players
                • Historical data
                • Press releases

                DATA ANALYSIS

                Data Synthesis

                • Collation of data
                • Estimation of key figures
                • Analysis of derived insights

                Data Validation

                • Triangulation with data models
                • Reference against proprietary databases
                • Corroboration with industry experts

                REPORT WRITING

                Qualitative

                • Market drivers
                • Market challenges
                • Market trends
                • Five forces analysis

                Quantitative

                • Market size and forecast
                • Market segmentation
                • Geographical insights
                • Competitive landscape

                Interested in this report?

                Get your sample now to see our research methodology and insights!

                Download Now

                Frequently Asked Questions

                Plastic Fillers market growth will increase by 5571.52 thousand t during 2022-2026 .

                The Plastic Fillers market is expected to grow at a CAGR of 4.78% during 2022-2026 .

                Plastic Fillers market is segmented by Application( Inorganic fillers, Organic fillers) Type( Automotive, Electrical and electronics, Building and construction, Packaging, Others) Geographic( APAC, Europe, North America, Middle East and Africa, South America)

                BASF SE, Cabot Corp., Calcinor SA, Elementis Plc, Evonik Industries AG, Exxon Mobil Corp., GCR Group, Gustav Grolman GmbH and Co. KG, Hoffmann Mineral GmbH, Imerys S.A., J M Huber Corp., Lhoist Group, MAHAVEER CERAMIC INDUSTRIES, Minerals Technologies Inc., Omya International AG, Pigmentum s.r.o., Quartz Works GmbH, SCR Sibelco NV, Standridge Color Corp, Thiele Kaolin Co. are a few of the key vendors in the Plastic Fillers market.

                APAC will register the highest growth rate of 55.91% among the other regions. Therefore, the Plastic Fillers market in APAC is expected to garner significant business opportunities for the vendors during the forecast period.

                US, China, Japan, India, Germany, UK

                • Increasing demand for plastic in APACThe ever-rising demand for plastic in APAC can be attributed to factors such as the rise in building construction and the use of lightweight plastic in the automotive and packaging industries. Industrialization and growth in the manufacturing sector fuel the consumption of plastic fillers in the region. In developing countries such as India and China is the driving factor this market.
                • the demand for plastic is proliferating is the driving factor this market.
                • primarily because of the thriving manufacturing sectors. The emerging economies in APAC dominate the plastic market in the region due to their large population and high GDP rate. For instance is the driving factor this market.
                • according to the World Bank Group (WBG) is the driving factor this market.
                • the annual GDP growth rate of India was 7.107% in 2016. It is expected that with an increase in disposable incomes is the driving factor this market.
                • the GDP of India will also increase during the forecast period. In 2016 is the driving factor this market.
                • the GDP of China was 6.70% is the driving factor this market.
                • which is expected to increase during the forecast period. In building and construction applications is the driving factor this market.
                • plastics are used in pipes and fittings is the driving factor this market.
                • foundations is the driving factor this market.
                • roofing is the driving factor this market.
                • flooring is the driving factor this market.
                • paneling is the driving factor this market.
                • roads is the driving factor this market.
                • insulation is the driving factor this market.
                • cable sheathing is the driving factor this market.
                • and ducting. In APAC is the driving factor this market.
                • the building and construction sector is the largest. Significant growth in the construction sector will accelerate the consumption of plastic in APAC. In India is the driving factor this market.
                • few government initiatives is the driving factor this market.
                • including projects for smart cities and the Housing for All by 2022 plan is the driving factor this market.
                • will drive the construction industry during the forecast period. is the driving factor this market.

                The Plastic Fillers market vendors should focus on grabbing business opportunities from the Inorganic fillers segment as it accounted for the largest market share in the base year.