Portable Printer Market Size 2024-2028
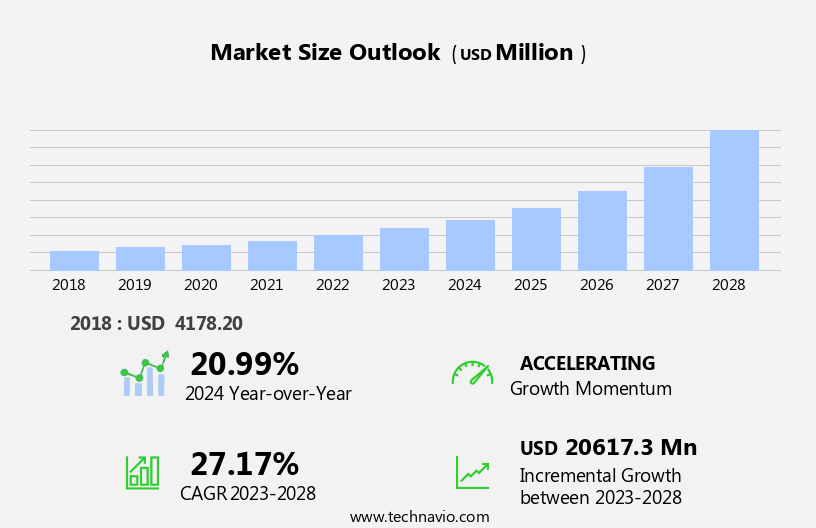
The portable printer market size is forecast to increase by USD 20.62 billion at a CAGR of 27.17% between 2023 and 2028.
- The market is experiencing significant growth due to the increasing demand for mobility and document solutions. This trend is driven by the need for flexibility and efficiency in business operations, particularly in industries such as healthcare, retail, and logistics. Another key factor fueling market growth is the introduction of advanced security solutions in portable printers, addressing concerns around data privacy and security. However, the market is not without challenges. The growing focus of enterprises toward paperless work and digital document management systems poses a significant threat to the market's growth. To capitalize on the opportunities presented by this market, companies must prioritize innovation, offering portable printers with advanced features such as cloud connectivity, wireless printing capabilities, and high print quality.
- Additionally, investing in research and development to address the security concerns and integrate with digital document management systems can help companies gain a competitive edge. Overall, the market presents significant opportunities for growth, particularly for those companies that can effectively address the market's challenges and offer innovative solutions to meet the evolving needs of businesses.
What will be the Size of the Portable Printer Market during the forecast period?
- In today's business landscape, the demand for portable printing solutions is on the rise, driven by the increasing trend of remote work and high internet penetration. Mobile printers cater to the needs of business travelers and mobile users, enabling them to print documents on-the-go. IoT devices and thermal printing technology have revolutionized the market, allowing for easy paper loading and seamless integration with smart devices. The market dynamics are influenced by factors such as the growing demand for superior customer experience, the proliferation of e-commerce, and the digitization of industries like healthcare, logistics, manufacturing, transportation, hospitality, and more.
- Mobile printers support various document formats, including barcode printing, and offer wireless connectivity via Bluetooth. High-speed printing, compact size, and impact technology are essential features that cater to the needs of businesses, ensuring efficient and effective printing solutions. The market is expected to continue growing as businesses prioritize digital infrastructure and the integration of smart devices into their operations.
How is this Portable Printer Industry segmented?
The portable printer industry research report provides comprehensive data (region-wise segment analysis), with forecasts and estimates in "USD million" for the period 2024-2028, as well as historical data from 2018-2022 for the following segments.
- Type
- Thermal
- Inkjet
- Application
- Transportation and logistics
- Retail
- Manufacturing
- Healthcare
- Others
- Geography
- APAC
- China
- Japan
- North America
- US
- Europe
- Germany
- UK
- South America
- Middle East and Africa
- APAC
By Type Insights
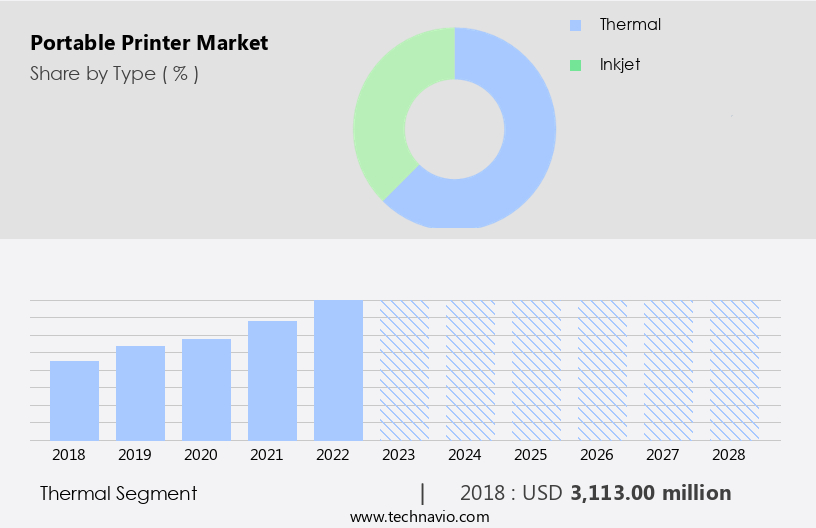
The thermal segment is estimated to witness significant growth during the forecast period.
Thermal technology printers have gained popularity in the market due to their suitability for mobile printing. These printers offer several advantages, including flexibility, low maintenance, high print quality output, and durability. Thermal printers are particularly reliable, as they can function effectively in extreme heat and cold conditions. Moreover, they do not require toners, ribbons, or ink cartridges for operation, making them easy to use and maintain. With the increasing adoption of wireless technologies like Bluetooth in portable printers, these devices offer faster print speeds and minimal noise. These printers are compatible with various devices, such as smartphones and tablets, making them convenient for mobile users.
The hospitality industry, for instance, uses thermal printers for generating pick-up notices, bill receipts, and other documentation. In the transportation sector, they are used for printing barcode labels and other essential documents. Businesses are expanding their digital infrastructure to cater to the growing demand for contactless transactions and remote working. Thermal printers' compatibility with IoT devices and ease of integration with digital infrastructures make them an ideal choice for businesses looking to modernize their operations. Companies like Seiko Instruments, Fujifilm Holdings, and Canon offer a range of thermal printers to cater to various industries' needs. The use of thermal printers is not limited to large businesses; compact, lightweight models are suitable for individual use, such as printing receipts at petrol pumps or generating pick-up notices for e-commerce deliveries.
In the healthcare sector, these printers are used for generating patient labels, prescription labels, and other documentation. In , thermal technology printers offer several advantages, including flexibility, reliability, ease of use, and compatibility with various devices. Their growing popularity can be attributed to the increasing demand for contactless transactions, remote working, and digitization across various industries.
Get a glance at the market report of share of various segments Request Free Sample
The Thermal segment was valued at USD 3.11 billion in 2018 and showed a gradual increase during the forecast period.
Regional Analysis
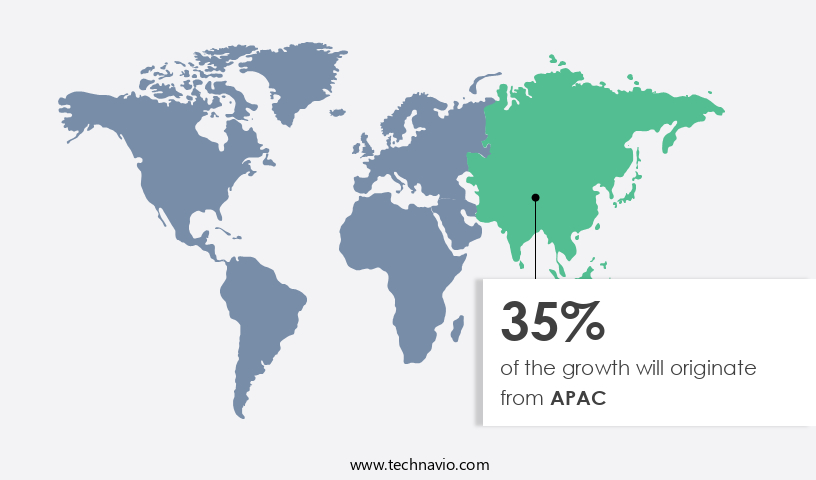
APAC is estimated to contribute 35% to the growth of the global market during the forecast period.Technavio’s analysts have elaborately explained the regional trends and drivers that shape the market during the forecast period.
For more insights on the market size of various regions, Request Free Sample
In the dynamic business landscape of the market, two significant drivers are shaping its growth trajectory. Firstly, the widespread adoption of automation in various industries, including transportation and hospitality, is fueling the demand for portable printers. This trend is particularly noticeable in the transportation sector, where the rise of e-commerce is leading to an increased need for efficient logistics and delivery processes. In APAC, countries like China and India, which are at the forefront of the global e-commerce market, are creating substantial opportunities for market expansion. Secondly, the integration of wireless technology and IoT devices into portable printers is enabling seamless connectivity and data sharing between devices.
This is crucial for businesses that require real-time documentation and communication, such as those in healthcare and manufacturing. Strategic alliances between companies are also contributing to the market's growth, as they facilitate the development of innovative product offerings and enhance the customer experience. Moreover, the compact size and lightweight design of portable printers make them an essential peripheral device for businesses that require flexibility and mobility, such as those that cater to business travelers or have remote working teams. The advancements in thermal technology, high-speed printing, and easy paper loading are further enhancing the productivity of these devices.
In , the market is experiencing significant growth due to the increasing demand for operational efficiency, automation, and wireless connectivity across various industries and verticals. With the ongoing modernization of digital infrastructures and the expanding internet penetration, the market is poised for continued growth in the coming years.
Market Dynamics
Our researchers analyzed the data with 2023 as the base year, along with the key drivers, trends, and challenges. A holistic analysis of drivers will help companies refine their marketing strategies to gain a competitive advantage.
What are the key market drivers leading to the rise in the adoption of Portable Printer Industry?
- Growing demand for combining mobility and document solutions is the key driver of the market.
- The market is witnessing significant growth due to the increasing demand for mobility in document solutions. With the rise of remote work culture, organizations are increasingly adopting mobile devices such as smartphones and laptops to enable their employees to work from anywhere. These employees, especially those in warehouses and logistics, require the ability to print labels on the go. As a result, companies are offering solutions that allow these employees to connect their mobile devices, such as laptops, with portable printers.
- This connectivity enhances productivity and efficiency, making portable printers an essential tool for businesses. The compatibility of portable printers with various applications and devices further adds to their appeal. Overall, the market is driven by the need for flexibility and mobility in document printing solutions.
What are the market trends shaping the Portable Printer Industry?
- Introduction of advanced security solutions in portable printers is the upcoming market trend.
- Organizations increasingly rely on networked printers for their printing needs, with some devices featuring internal data storage for efficient print job execution. However, this connectivity exposes these devices to cybersecurity risks. Hackers can exploit unprotected printers to launch attacks, such as denial-of-service (DoS) or gain access to sensitive information. Stolen data may include customer details, employee records, and confidential company information. The threat landscape is growing, with the number of printer-targeted cyberattacks on the rise.
- These vulnerabilities underscore the importance of cybersecurity measures for networked printers to protect valuable organizational data.
What challenges does the Portable Printer Industry face during its growth?
- Growing focus of enterprises toward paperless work is a key challenge affecting the industry growth.
- The market is experiencing shifts due to technological advancements in cloud-based solutions and display technology. With the rise of cloud storage services like Google Drive and Dropbox, users can access their documents remotely via mobile devices, diminishing the need for printing among consumer segments. Consequently, the market may witness a decrease in demand from this significant end-user group. On the enterprise front, innovations in digital signage and large-format displays are increasingly replacing paper or pamphlet-based promotions.
- This trend is expected to impact the market negatively in terms of unit shipments.
Exclusive Customer Landscape
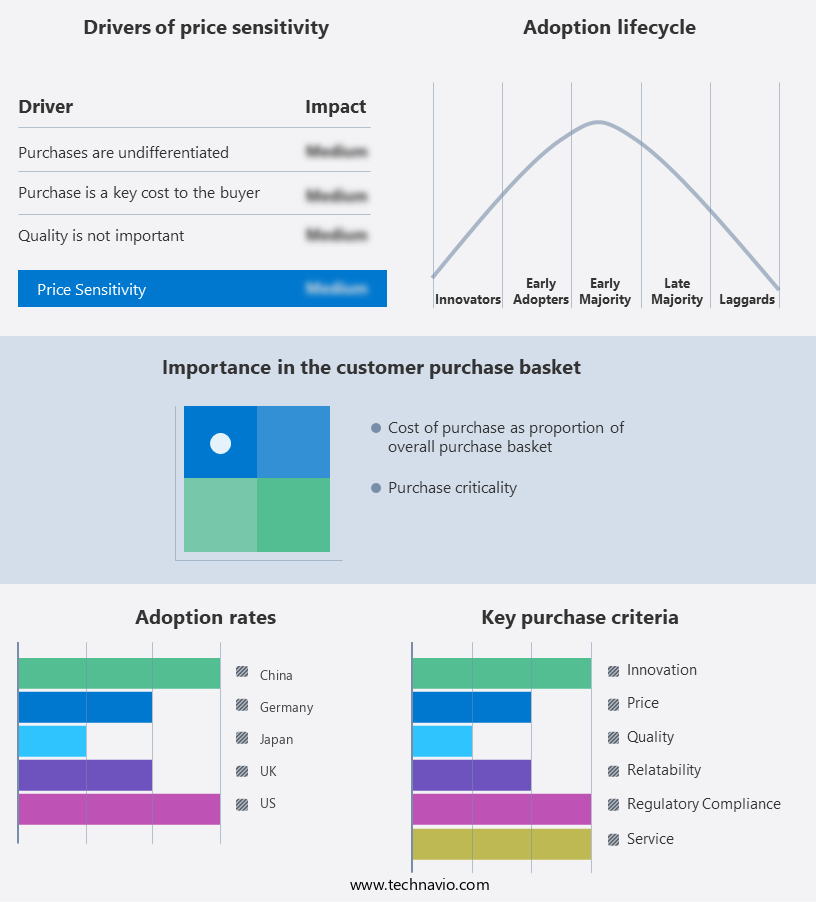
The portable printer market forecasting report includes the adoption lifecycle of the market, covering from the innovator’s stage to the laggard’s stage. It focuses on adoption rates in different regions based on penetration. Furthermore, the portable printer market report also includes key purchase criteria and drivers of price sensitivity to help companies evaluate and develop their market growth analysis strategies.
Customer Landscape
Key Companies & Market Insights
Companies are implementing various strategies, such as strategic alliances, portable printer market forecast, partnerships, mergers and acquisitions, geographical expansion, and product/service launches, to enhance their presence in the industry.
BIXOLON CO., LTD. - The company provides a range of portable label printers, including the SOHO series, catering to small businesses and home offices. These printers offer versatility and convenience, enabling users to produce high-quality labels on-demand. With wireless connectivity options and user-friendly interfaces, these devices streamline labeling processes and boost productivity. The compact design ensures portability, making them an ideal solution for businesses on the go.
The industry research and growth report includes detailed analyses of the competitive landscape of the market and information about key companies, including:
- BIXOLON CO., LTD.
- Brother Industries Ltd.
- Canon Inc.
- Citizen Watch Co. Ltd.
- CognitiveTPG
- Fujitsu Ltd.
- HiTi Digital Inc.
- Honeywell International Inc.
- HP Inc.
- Lexmark International Inc.
- Oki Electric Industry Co. Ltd.
- Oracle Corp.
- C and A Marketing Inc
- Primera Technology Inc.
- Printek LLC
- SATO Holdings Corp.
- Seiko Epson Corp.
- STAR MICRONICS Co.
- Toshiba Corp.
- Zebra Technologies Corp.
Qualitative and quantitative analysis of companies has been conducted to help clients understand the wider business environment as well as the strengths and weaknesses of key industry players. Data is qualitatively analyzed to categorize companies as pure play, category-focused, industry-focused, and diversified; it is quantitatively analyzed to categorize companies as dominant, leading, strong, tentative, and weak.
Research Analyst Overview
The market has witnessed significant growth in recent years, driven by the increasing demand for compact and wireless printing solutions in various industries. The transportation sector and hospitality industry, in particular, have shown a strong affinity towards mobile printers due to their flexibility and ability to provide instant printouts of documents on the go. Strategic alliances between key players and mobile device manufacturers have played a pivotal role in expanding the market reach of portable printers. With the rise of mobile users and the proliferation of smartphones and tablets, there has been a growing need for peripheral devices that can seamlessly integrate with these devices to enable on-demand printing.
Manufacturers have responded to this demand by introducing a wide range of product offerings that cater to different industries and use cases. For instance, Seiko Instruments and Fujifilm Holdings have focused on developing thermal technology-based portable printers that offer high accuracy and fast printing speeds. Canon and other competitors have introduced inkjet technology-based printers that offer high-speed printing and easy paper loading. The logistics and delivery industries have also been early adopters of portable printers for generating bill receipts and pick-up notices. The digitization of business processes has further boosted the demand for mobile printers, as businesses look to streamline their documentation process and enhance the customer experience.
The manufacturing industry has also seen a in the adoption of portable printers, especially in the context of e-commerce and remote working. With the increasing popularity of online shopping, there is a growing need for compact and lightweight mobile printers that can be used at petrol pumps and other delivery locations to generate receipts and invoices. Moreover, the advent of IoT devices and wireless connectivity technologies such as Bluetooth and optical fiber installations have made it easier for businesses to integrate portable printers into their digital infrastructures. This has led to increased revenue contribution from the market and has also enabled businesses to modernize their operations and improve productivity.
The healthcare industry is another area where portable printers have gained traction, as they enable healthcare professionals to generate and print documents such as prescription forms and patient records on the go. The ability to generate accurate and timely documentation has become increasingly important in the context of remote patient monitoring and telemedicine. In , the market is poised for continued growth, driven by the increasing demand for compact and wireless printing solutions across various industries. The ability to integrate with mobile devices, thermal and inkjet printing technologies, and wireless connectivity options are key factors that are driving the adoption of portable printers.
The market is expected to see further innovation and investment in the coming years, as businesses look to enhance their digital infrastructure and improve their customer experience.
|
Market Scope |
|
|
Report Coverage |
Details |
|
Page number |
186 |
|
Base year |
2023 |
|
Historic period |
2018-2022 |
|
Forecast period |
2024-2028 |
|
Growth momentum & CAGR |
Accelerate at a CAGR of 27.17% |
|
Market growth 2024-2028 |
USD 20617.3 million |
|
Market structure |
Fragmented |
|
YoY growth 2023-2024(%) |
20.99 |
|
Key countries |
US, China, Germany, UK, and Japan |
|
Competitive landscape |
Leading Companies, Market Positioning of Companies, Competitive Strategies, and Industry Risks |
What are the Key Data Covered in this Portable Printer Market Research and Growth Report?
- CAGR of the Portable Printer industry during the forecast period
- Detailed information on factors that will drive the growth and forecasting between 2024 and 2028
- Precise estimation of the size of the market and its contribution of the industry in focus to the parent market
- Accurate predictions about upcoming growth and trends and changes in consumer behaviour
- Growth of the market across APAC, North America, Europe, South America, and Middle East and Africa
- Thorough analysis of the market’s competitive landscape and detailed information about companies
- Comprehensive analysis of factors that will challenge the portable printer market growth of industry companies
We can help! Our analysts can customize this portable printer market research report to meet your requirements.
 RIA -
RIA - 
