
Power Electronics Market Size 2025-2029
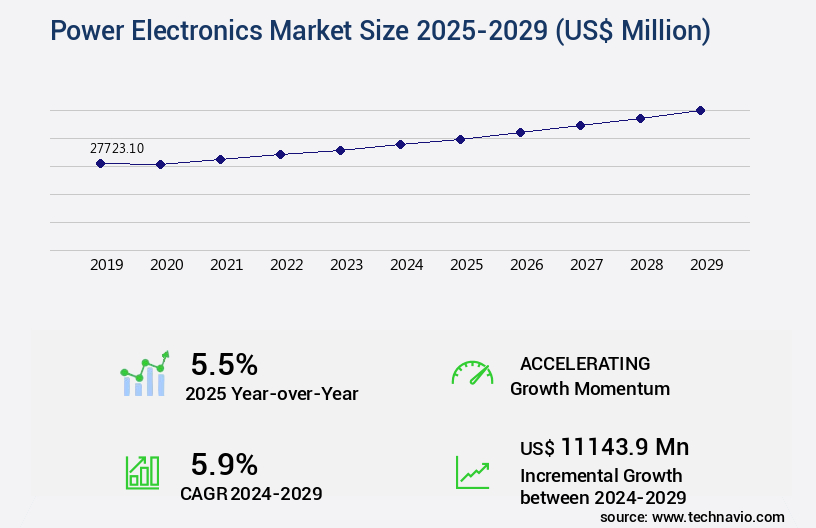
The power electronics market size is valued to increase USD 11.14 billion, at a CAGR of 5.9% from 2024 to 2029. Increased adoption of renewable energy will drive the power electronics market.
Major Market Trends & Insights
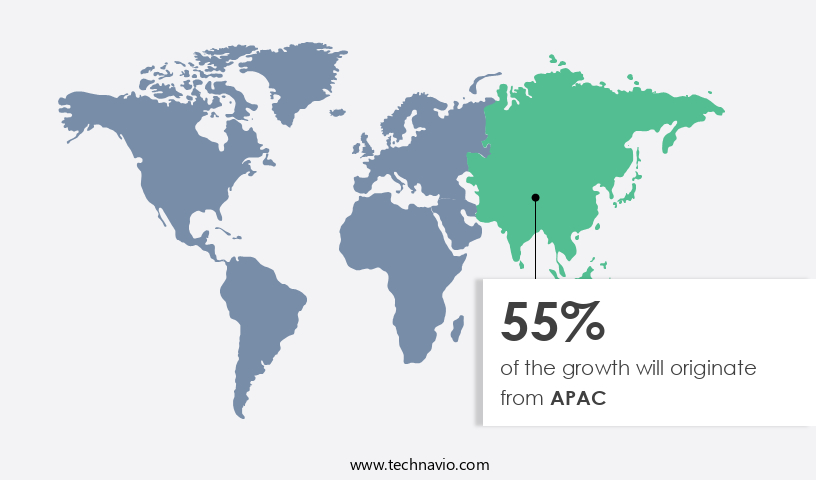
- APAC dominated the market and accounted for a 55% growth during the forecast period.
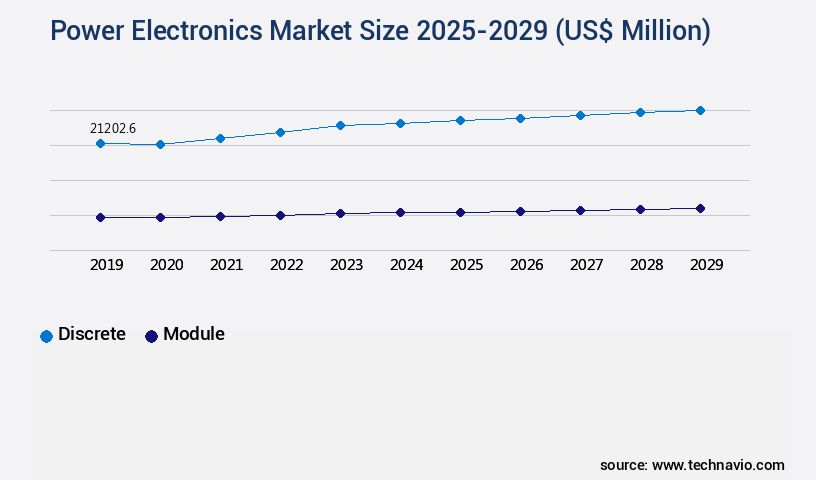
- By Product - Discrete segment was valued at USD 21.2 billion in 2023
- By Material - Silicon segment accounted for the largest market revenue share in 2023
Market Size & Forecast
- Market Opportunities: USD 61.80 million
- Market Future Opportunities: USD 11143.90 million
- CAGR from 2024 to 2029 : 5.9%
Market Summary
- The market is experiencing significant growth, driven by the increasing adoption of renewable energy sources and the rise in implementation of smart grids. According to a recent report, The market was valued at USD120.5 billion in 2020 and is projected to reach USD181.5 billion by 2026, growing at a steady rate of 6.5% per annum. This expansion is fueled by the need for efficient energy conversion and management in various industries, including transportation, industrial, consumer electronics, and renewable energy. Despite this progress, challenges persist, particularly in the realm of power electronics components.
- For instance, the technological limitations of metal-oxide-semiconductor field-effect transistors (MOSFETs) continue to hinder their widespread adoption. Efforts are underway to address these challenges through advancements in wide bandgap semiconductors, such as gallium nitride (GaN) and silicon carbide (SiC), which offer improved power handling capabilities and efficiency. As the market evolves, it is essential for businesses to stay informed about the latest trends and developments. This includes the increasing integration of power electronics in renewable energy systems, the growing popularity of smart grids, and the ongoing research and innovation in power semiconductor technology. By staying abreast of these advancements, businesses can capitalize on the opportunities presented by this dynamic and ever-evolving market.
What will be the Size of the Power Electronics Market during the forecast period?
Get Key Insights on Market Forecast (PDF) Request Free Sample
How is the Power Electronics Market Segmented ?
The power electronics industry research report provides comprehensive data (region-wise segment analysis), with forecasts and estimates in "USD million" for the period 2025-2029, as well as historical data from 2019-2023 for the following segments.
- Product
- Discrete
- Module
- Material
- Silicon
- Silicon carbide
- Gallium nitride
- End-user
- Consumer electronics
- Industrial
- Automotive
- Biomedical and healthcare
- Others
- Geography
- North America
- US
- Canada
- Europe
- France
- Germany
- Italy
- UK
- APAC
- China
- India
- Japan
- South Korea
- Rest of World (ROW)
- North America
By Product Insights
The discrete segment is estimated to witness significant growth during the forecast period.
The market continues to evolve, driven by the increasing demand for energy-efficient technologies and the integration of renewable energy sources. Power electronic systems, including ac-dc converters, dc-dc converters, and inverter technology, are at the heart of this transformation. These systems utilize advanced components such as power semiconductors, like insulated gate bipolar transistors (IGBTs) and metal-oxide-semiconductor field-effect transistors (MOSFETs), and high-frequency converters. Thermal management, through heat sinks and cooling systems, is crucial for maintaining power system stability. Key applications include motor drive systems, battery management systems, and electric vehicle chargers. Renewable energy integration necessitates power converters to ensure power quality and meet energy efficiency standards.
Advanced control methods, such as analog power control, digital power control, and soft switching techniques, are employed to optimize power density and improve power factor correction. Harmonic and RFI suppression are essential for maintaining power quality. The market for power electronic components, like resonant converters, IGBT modules, and thyristor control, is projected to reach USD130.5 billion by 2028, growing at a CAGR of 11.2% from 2021 to 2028. This growth is attributed to the increasing demand for power electronic systems in various industries, including transportation, industrial, and consumer electronics. By procuring modules instead of discrete components, engineers can save time and resources, reducing time-to-market.
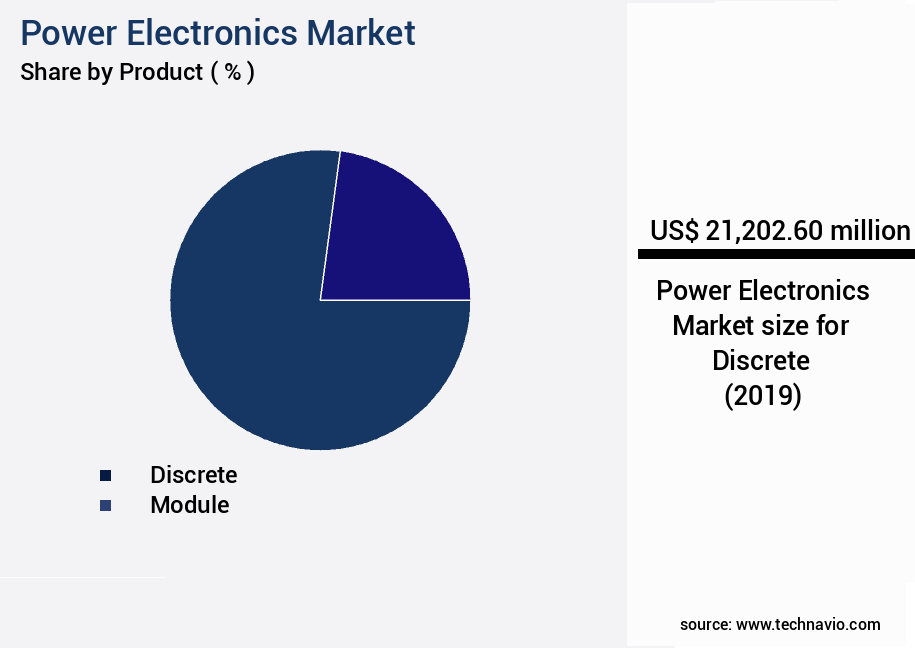
The Discrete segment was valued at USD 21.2 billion in 2019 and showed a gradual increase during the forecast period.
Regional Analysis
APAC is estimated to contribute 55% to the growth of the global market during the forecast period.Technavio's analysts have elaborately explained the regional trends and drivers that shape the market during the forecast period.
See How Power Electronics Market Demand is Rising in APAC Request Free Sample
The market in APAC is experiencing significant growth due to the increasing energy demand in developing nations within the region. By 2026, energy consumption is projected to rise by 50% compared to the levels recorded five years prior. Renewable energy sources are set to meet a substantial portion of this demand, as countries in APAC continue to prioritize sustainable energy targets. Japan, China, South Korea, and India are the primary contributors to the revenues generated in the regional the market.
Japan, South Korea, and Hong Kong lead the way in research expenditures. Government initiatives, particularly manufacturing-focused policies in China and India, are propelling the growth of the market in APAC.
Market Dynamics
Our researchers analyzed the data with 2024 as the base year, along with the key drivers, trends, and challenges. A holistic analysis of drivers will help companies refine their marketing strategies to gain a competitive advantage.
The market is experiencing significant growth due to the increasing demand for high-efficiency energy conversion and management solutions. One of the key trends driving this growth is the adoption of high-frequency resonant converter designs, which offer improved power factor correction and harmonic mitigation in power systems. These converters are increasingly being used in applications such as electric vehicles and renewable energy systems, where efficient charging and grid integration are crucial. Advanced power converter control strategies, including optimal control for DC-DC converters and improved power factor correction techniques, are also gaining popularity in the market. Wide bandgap semiconductor technology, such as silicon carbide MOSFETs and gallium nitride power transistors, is revolutionizing the industry with their ability to handle high voltages and temperatures, leading to high-power density converter designs and power loss minimization techniques. In the electric vehicle sector, efficient charging systems are essential to ensure long range and fast charging times. Advanced power semiconductor devices and thermal management solutions are key components in achieving this goal. Renewable energy grid integration poses challenges due to the intermittent nature of these sources, and power electronic packaging optimization and advanced power system protection are necessary to ensure reliability and power quality improvement. Furthermore, EMI reduction techniques in power converters are becoming increasingly important to minimize electromagnetic interference and ensure compatibility with other electronic systems. Fault diagnosis for power electronic systems and power system reliability enhancement are also critical to maintaining the stability and efficiency of power electronics applications. Overall, the market is continuously evolving to meet the demands of various industries and applications, with a focus on high-performance, efficient, and reliable power conversion and management solutions.
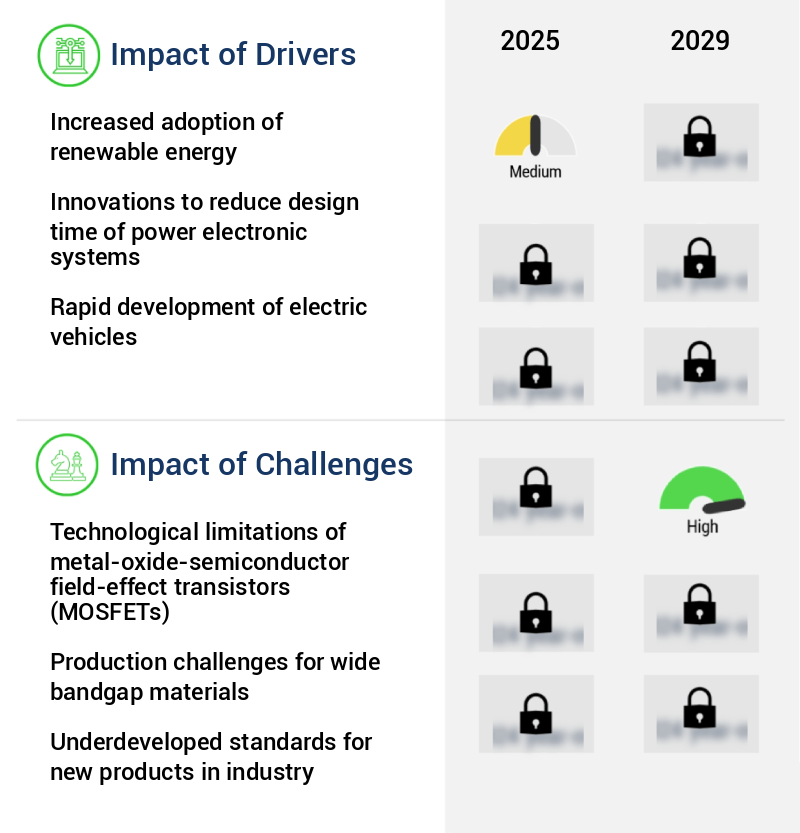
What are the key market drivers leading to the rise in the adoption of Power Electronics Industry?
- The significant expansion of renewable energy adoption serves as the primary market catalyst.
- The market is experiencing significant growth and diversification, driven by the increasing adoption of renewable energy sources and advancements in technology. For instance, the US Department of Energy's Renewable Energy Growth Program, which aims to produce 40 megawatts (MW) of renewable energy annually until 2029, presents substantial opportunities for market participants. This initiative encompasses solar, wind, hydropower, and anaerobic digestion projects, categorized as small, medium, or large based on power output. Institutions, including commercial, government, non-profit entities, can join this program and receive incentives to meet their respective power production targets.
- Consequently, The market benefits, with manufacturers supplying essential equipment to program participants. This trend underscores the evolving nature of the market and its pivotal role in supporting the transition towards renewable energy.
What are the market trends shaping the Power Electronics Industry?
- The adoption of smart grids is gaining momentum as the next market trend. Smart grids, which utilize advanced technologies for efficient energy management, are increasingly being adopted by utilities and consumers alike.
- Smart grids represent the evolution of power networks, integrating communication capabilities to enhance operability and efficiency. Countries like the US, Germany, Japan, and the European Union are investing in renewable energy resources, leveraging smart grids for improved power management. A smart grid encompasses all assets within a power network, including generation, transmission, distribution, and consumption. One significant feature is its capacity to generate substantial data volumes. The integration of automation devices, sensors, and other smart devices expands opportunities for utilities to handle multiple databases and synchronize them effectively.
- The market plays a crucial role in this transformation, providing components for efficient energy conversion and management. With the increasing adoption of renewable energy sources and smart grids, the market is poised for robust growth.
What challenges does the Power Electronics Industry face during its growth?
- The advancement of the semiconductor industry faces significant limitations due to the technological constraints of metal-oxide-semiconductor field-effect transistors (MOSFETs). These constraints pose a substantial challenge to industry growth.
- Power electronics, a critical segment of the electronics industry, is characterized by its extensive application in various sectors, including industrial, automotive, renewable energy, and consumer electronics. Power semiconductor devices, primarily based on silicon wafers, are the cornerstone of power electronics. IGBTs (Insulated Gate Bipolar Transistors), power MOSFETs (Metal-Oxide-Semiconductor Field-Effect Transistors), and super-junction power MOSFETs are among the most commonly used devices. IGBTs, with their configuration, are suitable for high-voltage applications exceeding 400V, while power MOSFETs cater to applications below 500V.
- Super-junction power MOSFETs operate in the voltage range between 500 and 900V. At higher voltages, IGBTs exhibit slower switching times, and super-junction power MOSFETs incur higher losses. To address the efficiency challenges in applications requiring operations in kilovolts, materials like wide bandgap and ultra-wide bandgap materials are being adopted. These materials help reduce losses at higher voltages, thereby enhancing the overall performance of power electronics systems.
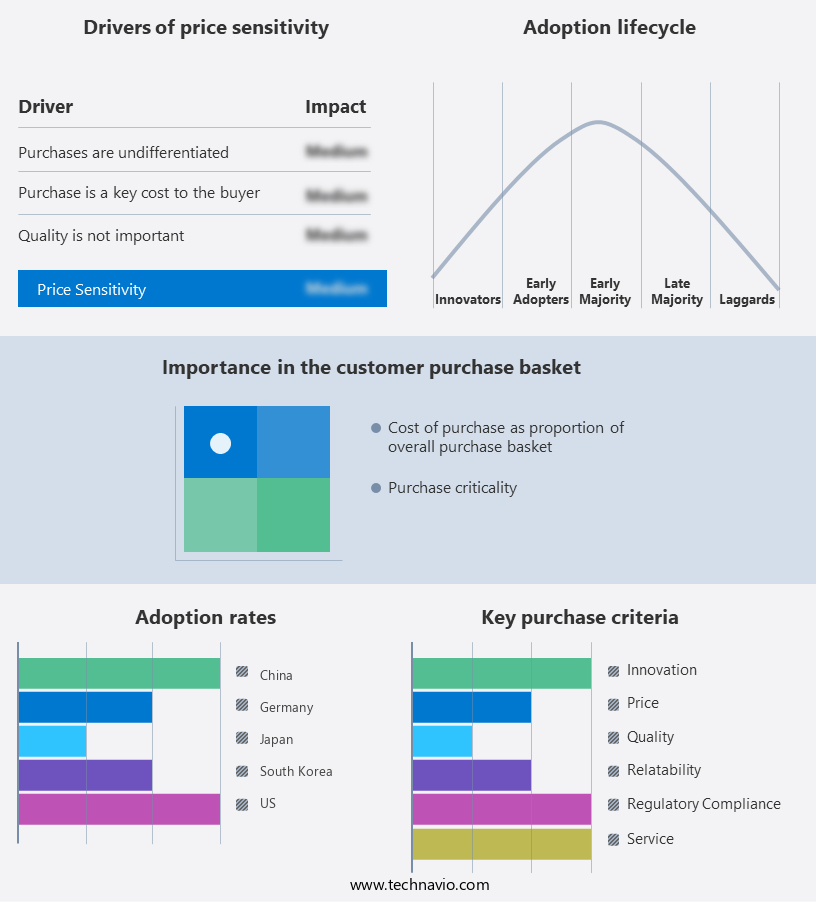
Exclusive Technavio Analysis on Customer Landscape
The power electronics market forecasting report includes the adoption lifecycle of the market, covering from the innovator's stage to the laggard's stage. It focuses on adoption rates in different regions based on penetration. Furthermore, the power electronics market report also includes key purchase criteria and drivers of price sensitivity to help companies evaluate and develop their market growth analysis strategies.
Customer Landscape of Power Electronics Industry
Competitive Landscape
Companies are implementing various strategies, such as strategic alliances, power electronics market forecast, partnerships, mergers and acquisitions, geographical expansion, and product/service launches, to enhance their presence in the industry.
ABB Ltd. - This company specializes in power electronics technology, providing converters, inverters, and drives for various industries, including automation and power grids, as well as electric mobility solutions. Their product offerings cater to diverse applications, enhancing efficiency and reliability.
The industry research and growth report includes detailed analyses of the competitive landscape of the market and information about key companies, including:
- ABB Ltd.
- Analog Devices Inc.
- Arete and Cocchi Technology
- Danfoss AS
- Fuji Electric Co. Ltd.
- General Electric Co.
- Infineon Technologies AG
- Magna Power Electronics Inc.
- Mitsubishi Electric Corp.
- NXP Semiconductors NV
- ON Semiconductor Corp.
- Power Electronics
- Renesas Electronics Corp.
- Schneider Electric SE
- STMicroelectronics NV
- Texas Instruments Inc.
- Toshiba Corp.
Qualitative and quantitative analysis of companies has been conducted to help clients understand the wider business environment as well as the strengths and weaknesses of key industry players. Data is qualitatively analyzed to categorize companies as pure play, category-focused, industry-focused, and diversified; it is quantitatively analyzed to categorize companies as dominant, leading, strong, tentative, and weak.
Recent Development and News in Power Electronics Market
- In January 2024, Infineon Technologies AG, a leading player in power electronics, announced the launch of its new 1200V IGBT650F3 power semiconductor, aiming to enhance efficiency and reduce system costs in various industrial applications (Infineon Technologies AG, 2024).
- In March 2024, Texas Instruments Inc. And ON Semiconductor Corporation entered into a strategic collaboration to develop and manufacture power management and power conversion solutions, combining their expertise and resources to cater to the growing demand for power electronics in the automotive and industrial sectors (Texas Instruments Inc., 2024).
- In May 2024, Vicor Corporation raised USD200 million in a senior secured term loan facility to support the growth of its power components business, including the expansion of its manufacturing capabilities and the development of new technologies (Vicor Corporation, 2024).
- In February 2025, the European Union passed the new Regulation on Energy Union and Climate Action, which includes provisions to promote the adoption of power electronics in various sectors, such as renewable energy, transportation, and Energy storage, to reduce greenhouse gas emissions and improve energy efficiency (European Parliament and Council of the European Union, 2025).
Dive into Technavio's robust research methodology, blending expert interviews, extensive data synthesis, and validated models for unparalleled Power Electronics Market insights. See full methodology.
|
Market Scope |
|
|
Report Coverage |
Details |
|
Page number |
230 |
|
Base year |
2024 |
|
Historic period |
2019-2023 |
|
Forecast period |
2025-2029 |
|
Growth momentum & CAGR |
Accelerate at a CAGR of 5.9% |
|
Market growth 2025-2029 |
USD 11143.9 million |
|
Market structure |
Fragmented |
|
YoY growth 2024-2025(%) |
5.5 |
|
Key countries |
China, US, Japan, South Korea, Germany, India, UK, France, Canada, and Italy |
|
Competitive landscape |
Leading Companies, Market Positioning of Companies, Competitive Strategies, and Industry Risks |
Research Analyst Overview
- The market continues to evolve, driven by advancements in technology and the growing demand for energy-efficient solutions across various sectors. Resonant converters and IGBT modules are increasingly being adopted for their high power density and efficiency, while heat sinks remain essential for managing the thermal challenges of power semiconductors. Analog and digital power control systems are optimizing power system stability, with high-frequency converters and thyristor control playing crucial roles. Inverter technology, including AC-DC converters and grid-tied inverters, is a key focus for renewable energy integration. The power electronics industry is expected to grow by over 7% annually, with a significant portion attributed to the increasing adoption of power electronic systems in electric vehicle chargers and motor drive systems.
- For instance, a leading automotive manufacturer reported a 30% increase in sales for their electric vehicle charging stations, thanks to the integration of high-performance power converters and advanced thermal management solutions. Power management ICs and rectifier circuits are also essential components, ensuring power factor correction and energy efficiency standards are met. Soft switching techniques and power quality monitoring are critical for RFI suppression and harmonic filtering in switching power supplies. As power density optimization remains a top priority, the market is witnessing continuous innovation in low-voltage power supplies and battery management systems.
What are the Key Data Covered in this Power Electronics Market Research and Growth Report?
-
What is the expected growth of the Power Electronics Market between 2025 and 2029?
-
USD 11.14 billion, at a CAGR of 5.9%
-
-
What segmentation does the market report cover?
-
The report is segmented by Product (Discrete and Module), Material (Silicon, Silicon carbide, and Gallium nitride), End-user (Consumer electronics, Industrial, Automotive, Biomedical and healthcare, and Others), and Geography (APAC, Europe, North America, South America, and Middle East and Africa)
-
-
Which regions are analyzed in the report?
-
APAC, Europe, North America, South America, and Middle East and Africa
-
-
What are the key growth drivers and market challenges?
-
Increased adoption of renewable energy, Technological limitations of metal-oxide-semiconductor field-effect transistors (MOSFETs)
-
-
Who are the major players in the Power Electronics Market?
-
ABB Ltd., Analog Devices Inc., Arete and Cocchi Technology, Danfoss AS, Fuji Electric Co. Ltd., General Electric Co., Infineon Technologies AG, Magna Power Electronics Inc., Mitsubishi Electric Corp., NXP Semiconductors NV, ON Semiconductor Corp., Power Electronics, Renesas Electronics Corp., Schneider Electric SE, STMicroelectronics NV, Texas Instruments Inc., and Toshiba Corp.
-
Market Research Insights
- The market is a dynamic and continuously evolving industry, encompassing various technologies such as digital signal processing, pulse width modulation, and power loss reduction. Power conversion efficiency and design simulation play crucial roles in the development of power electronic systems. Magnetic components and electromagnetic modeling are essential for optimizing circuit topology and ensuring fault tolerance. Two significant data points illustrate the market's growth and trends. First, power electronic systems have achieved a remarkable increase in power conversion efficiency, with some applications reaching over 98%. Second, industry experts anticipate that the market will expand at a rate of approximately 10% per year due to the increasing demand for energy-efficient technologies and the growing adoption of renewable energy sources.
- An example of market dynamics comes from the automotive sector, where the implementation of power electronics in electric vehicles has led to a significant sales increase. In this context, power semiconductor devices, control algorithms, and voltage regulation have been instrumental in enhancing the performance and efficiency of electric vehicle powertrains. Overall, the market is characterized by its focus on improving power conversion efficiency, reducing power loss, and ensuring reliability through advanced design techniques, component selection, and system integration.
We can help! Our analysts can customize this power electronics market research report to meet your requirements.
 RIA -
RIA - 
