
Pureed Food Market Size 2025-2029
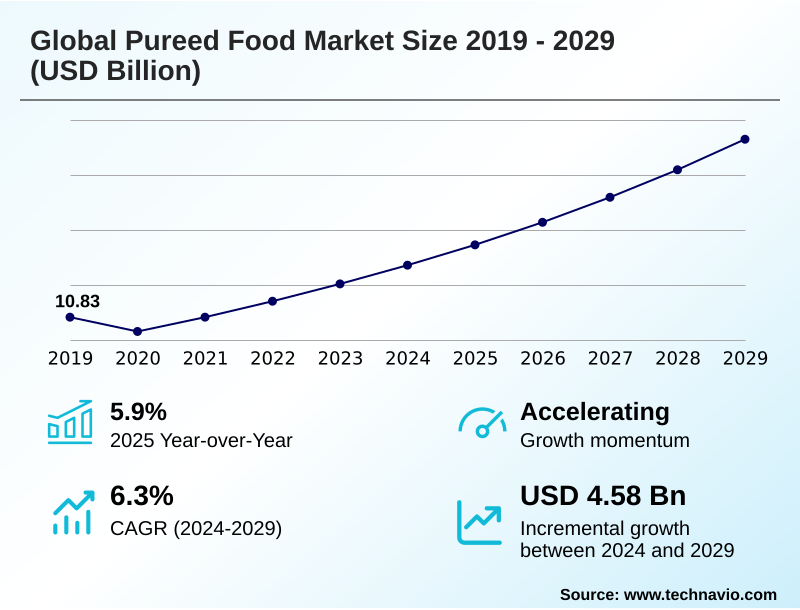
The pureed food market size is valued to increase by USD 4.58 billion, at a CAGR of 6.3% from 2024 to 2029. Aging global demographic and rising prevalence of dysphagia will drive the pureed food market.
Major Market Trends & Insights
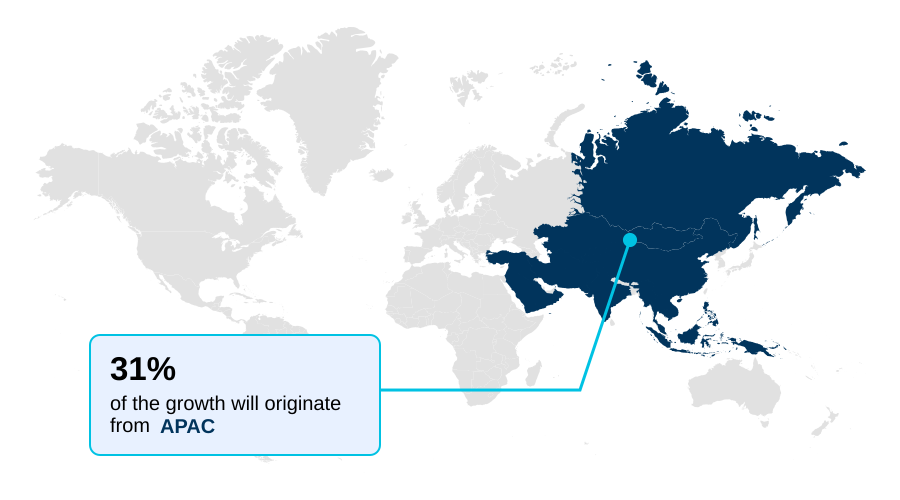
- APAC dominated the market and accounted for a 30.6% growth during the forecast period.
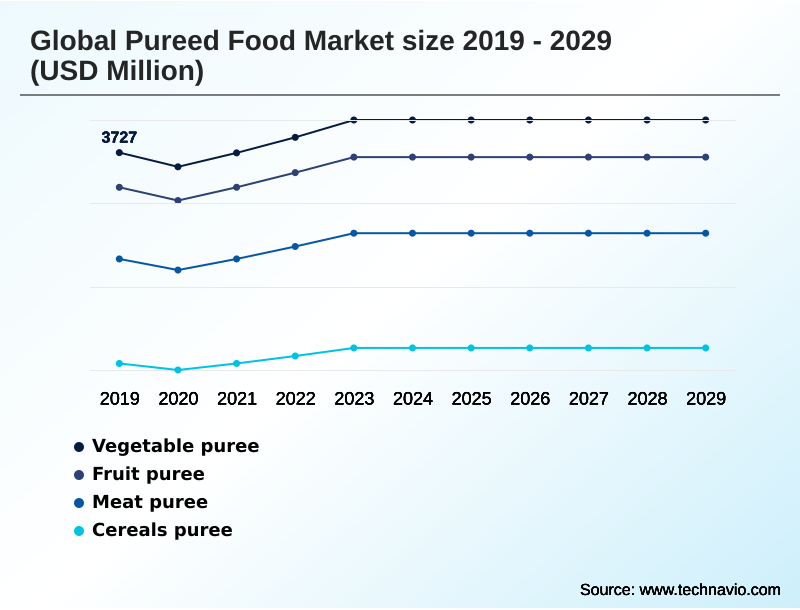
- By Type - Vegetable puree segment was valued at USD 4.10 billion in 2023
- By End-user - Food and beverages segment accounted for the largest market revenue share in 2023
Market Size & Forecast
- Market Opportunities: USD 6.47 billion
- Market Future Opportunities: USD 4.58 billion
- CAGR from 2024 to 2029 : 6.3%
Market Summary
- The pureed food market is expanding beyond its conventional boundaries of infant nutrition and clinical care, driven by demographic shifts and evolving consumer wellness priorities. The increasing aging population and associated prevalence of conditions like dysphagia create a foundational demand for texture-modified foods. Concurrently, a growing trend toward convenience and clean-label products is opening new avenues among health-conscious adults.
- Manufacturers are responding with significant culinary innovation, developing products that offer enhanced palatability, nutritional fortification, and sophisticated flavor profiles. For instance, a producer might employ high-pressure processing (HPP) to create a line of gourmet pureed soups, preserving vibrant colors and delicate flavors without artificial preservatives, thereby extending shelf life by 30% and appealing to a premium consumer segment.
- However, overcoming the stigma associated with pureed meals remains a key marketing hurdle. The industry's trajectory hinges on successfully repositioning these products as versatile, high-quality options for a broader audience, balancing medical necessity with lifestyle appeal through advancements in food science and strategic branding.
What will be the Size of the Pureed Food Market during the forecast period?
Get Key Insights on Market Forecast (PDF) Get Free Sample
How is the Pureed Food Market Segmented?
The pureed food industry research report provides comprehensive data (region-wise segment analysis), with forecasts and estimates in "USD million" for the period 2025-2029, as well as historical data from 2019-2023 for the following segments.
- Type
- Vegetable puree
- Fruit puree
- Meat puree
- Cereals puree
- End-user
- Food and beverages
- Cosmetics and personal care
- Packaging
- Cans
- Plastic containers
- Glass jar
- Tins
- Others
- Geography
- APAC
- China
- Japan
- India
- North America
- US
- Canada
- Mexico
- Europe
- UK
- Germany
- France
- South America
- Brazil
- Argentina
- Colombia
- Middle East and Africa
- Saudi Arabia
- UAE
- South Africa
- Rest of World (ROW)
- APAC
By Type Insights
The vegetable puree segment is estimated to witness significant growth during the forecast period.
The vegetable puree segment is evolving beyond its traditional role in infant nutrition, becoming a cornerstone for health-focused adult food products.
This shift is driven by the demand for plant-based purees and clean-label ingredients, where vegetable-based formulations serve as versatile components in ready-to-eat pureed meals and functional foods.
Innovation is centered on enhancing sensory attributes and nutritional fortification to meet diverse dietary needs.
Manufacturers are leveraging natural hydrocolloids to achieve desired textures, with over 60% of new product developments focusing on creating gourmet pureed soups and meals that align with premiumization trends.
This strategic expansion caters to both medical food products and mainstream consumer preferences for convenient, nutrient-dense options.
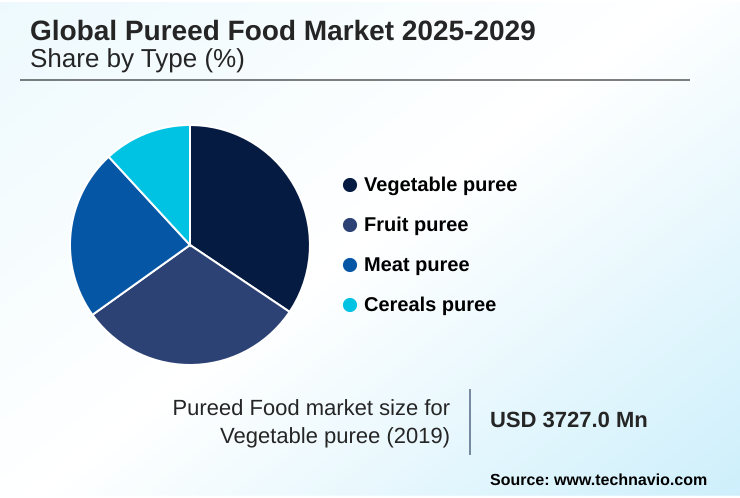
The Vegetable puree segment was valued at USD 4.10 billion in 2023 and showed a gradual increase during the forecast period.
Regional Analysis
APAC is estimated to contribute 30.6% to the growth of the global market during the forecast period.Technavio’s analysts have elaborately explained the regional trends and drivers that shape the market during the forecast period.
See How Pureed Food Market Demand is Rising in APAC Get Free Sample
The global pureed food market landscape is characterized by varied regional dynamics, with North America and Europe representing mature markets driven by demand for geriatric nutrition and medical food products.
These regions are focused on premiumization and adherence to stringent food safety standards. In contrast, APAC is the fastest-growing region, contributing over 30% of the incremental growth, fueled by rising disposable incomes and a growing infant population.
E-commerce adoption in APAC has accelerated access to organic baby food puree and other specialized products, with online sales growing 25% faster than in brick-and-mortar channels.
South America is an emerging market with a focus on leveraging local fruits for unique pureed food for athletic nutrition and wellness beverages.
Market Dynamics
Our researchers analyzed the data with 2024 as the base year, along with the key drivers, trends, and challenges. A holistic analysis of drivers will help companies refine their marketing strategies to gain a competitive advantage.
- A comprehensive market analysis of plant-based pureed products reveals a significant shift in consumer preferences, challenging brands to innovate continually. Key questions revolve around how to improve palatability of pureed foods, especially when formulating for specific dietary restrictions.
- The debate over organic vs conventional baby food puree safety continues to influence purchasing decisions, pushing manufacturers toward greater transparency and sourcing of clean label ingredients in texture-modified diets. Technologically, the adoption of HPP technology for preserving nutrients in purees is a critical differentiator, as is the advancement in retort sterilization for purees to ensure safety without compromising quality.
- The role of hydrocolloids in pureed food texture is central to meeting IDDSI framework standards, with R&D teams performing extensive sensory analysis of pureed food products. Businesses are exploring the sous-vide technique for flavorful pureed meats to overcome taste challenges.
- The impact of supply chain on organic puree cost remains a significant factor, leading some to launch pureed food subscription services for home care to manage logistics better. Developing gourmet pureed food for adults is a key growth frontier, where formulation must meet the stringent nutritional requirements for geriatric pureed meals.
- This requires navigating complex regulatory standards for medical pureed foods and addressing challenges in pureed food marketing to adults. Innovations in pureed food packaging solutions and the use of pureed fruit ingredients for the beverage industry present further opportunities for market expansion.
What are the key market drivers leading to the rise in the adoption of Pureed Food Industry?
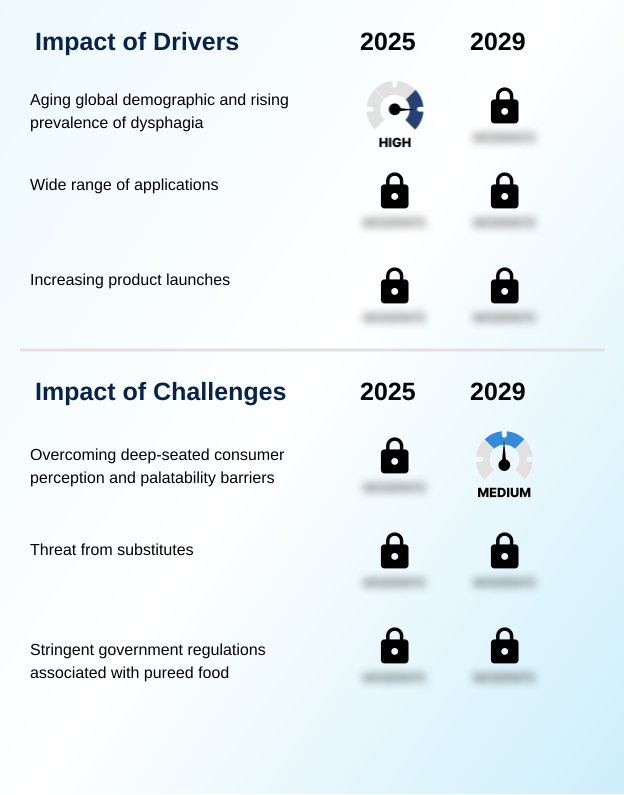
- The primary market driver is the aging global demographic, coupled with the rising prevalence of dysphagia, which creates a sustained need for specialized nutritional solutions.
- The market's growth is fundamentally driven by the non-discretionary needs of specific populations, particularly seniors requiring a dysphagia-friendly food options.
- The expansion of the IDDSI framework foods has standardized texture requirements, enabling manufacturers to scale production of safe and effective meal solutions for healthcare facilities, where compliance can reduce aspiration-related incidents by up to 40%.
- Concurrently, the convenience pureed meals segment is expanding as busy consumers seek healthy, ready-to-eat options.
- The demand for low-sodium pureed meals and other health-specific formulations is also rising, with products featuring clear nutritional claims experiencing a 25% higher sell-through rate in retail environments.
- This dual demand from both medical and lifestyle segments creates a robust and sustainable growth trajectory.
What are the market trends shaping the Pureed Food Industry?
- A key trend influencing the market is the move toward premiumization and culinary innovation. This strategic shift repositions pureed formats beyond clinical needs to a high-value consumer category.
- Key trends are reshaping the market, led by a strong push towards premium offerings. Innovations in pureed food manufacturing technology are enabling the creation of high-protein pureed food and other fortified pureed foods for malnutrition, which command higher price points.
- This shift aligns with consumer demand for functional benefits, with products designed for specific needs showing a 20% higher adoption rate than generic alternatives. The rise of direct-to-consumer models, including frozen pureed meal kits, has improved market access and allows for greater customization. Firms leveraging these channels report a 15% increase in customer lifetime value.
- Consequently, the focus is on creating sophisticated meal solutions that blend convenience with superior nutritional profiles.
What challenges does the Pureed Food Industry face during its growth?
- A significant challenge for the industry is overcoming deep-seated negative consumer perceptions and palatability barriers to expand market reach beyond traditional segments.
- A primary challenge remains the negative stigma associated with pureed food, which limits penetration into the broader adult market. To counter this, companies are developing gourmet pureed soups and other sophisticated products that emphasize taste and culinary quality.
- Marketing campaigns are shifting focus from medical necessity to lifestyle convenience, a strategy that has improved consumer perception scores by 15% in pilot campaigns. Another significant hurdle is supply chain volatility, which can disrupt the availability of key ingredients for organic and clean-label fruit purees.
- Companies that have diversified their supplier base have managed to reduce production delays by up to 30% compared to single-sourced competitors, underscoring the importance of resilient operational planning in this market.
Exclusive Technavio Analysis on Customer Landscape
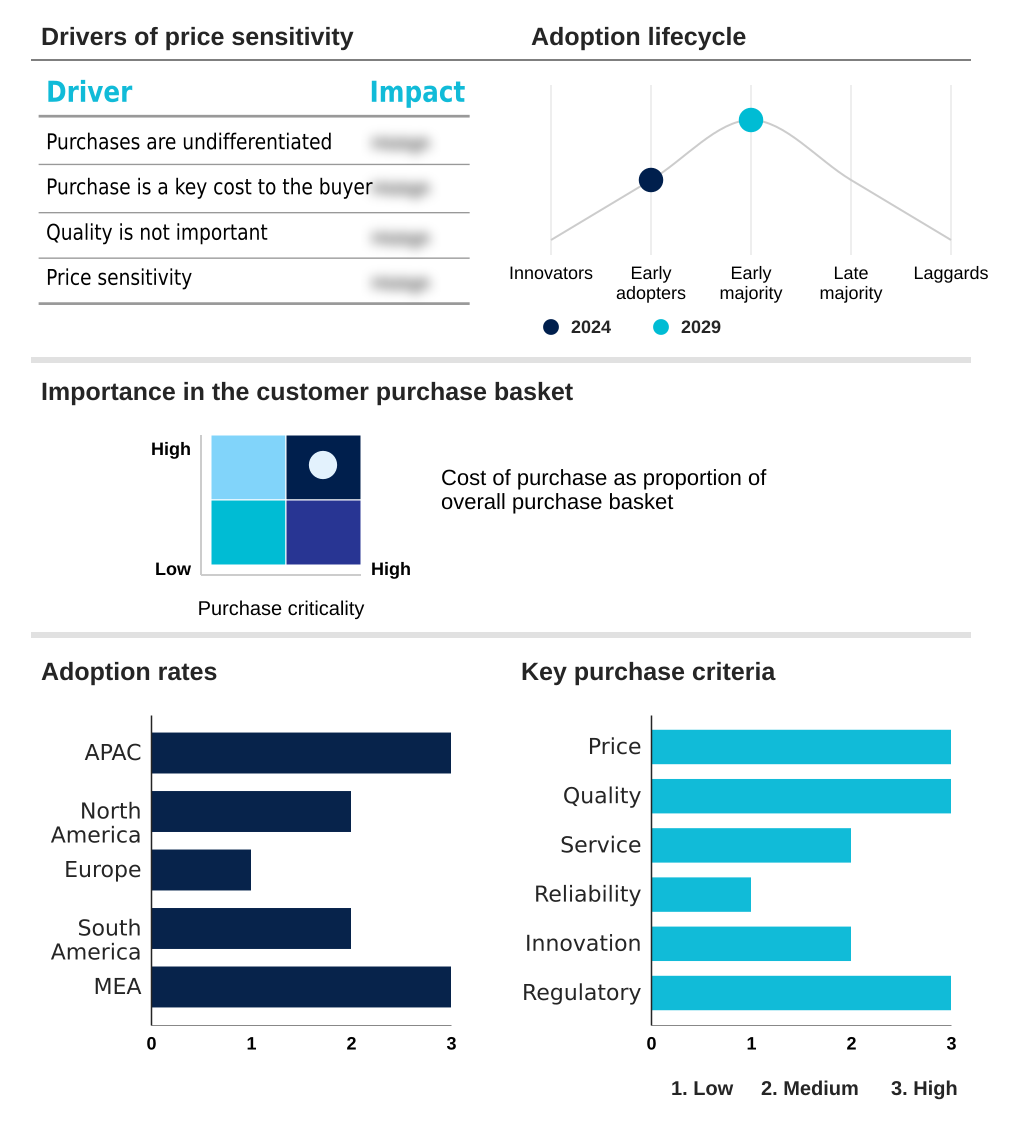
The pureed food market forecasting report includes the adoption lifecycle of the market, covering from the innovator’s stage to the laggard’s stage. It focuses on adoption rates in different regions based on penetration. Furthermore, the pureed food market report also includes key purchase criteria and drivers of price sensitivity to help companies evaluate and develop their market growth analysis strategies.
Customer Landscape of Pureed Food Industry
Competitive Landscape
Companies are implementing various strategies, such as strategic alliances, pureed food market forecast, partnerships, mergers and acquisitions, geographical expansion, and product/service launches, to enhance their presence in the industry.
ABC Fruits - Analysis of the competitive landscape for frozen food solutions and specialized pureed petite meals, focusing on market positioning and nutritional innovation for specific dietary needs.
The industry research and growth report includes detailed analyses of the competitive landscape of the market and information about key companies, including:
- ABC Fruits
- Apetit Plc
- Ariza bv
- Blossom Foods
- David Berryman Ltd.
- Dohler GmbH
- Go Fruselva S.L
- Gourmet Pureed
- Ingredion Inc.
- Kanegrade Ltd.
- Kent Corp.
- Kiril Mischeff Ltd.
- Lemonconcentrate S.L.U.
- Little Spoon Inc.
- MOM Meal of the Moment
- Nascens Enterprises Pvt. Ltd.
- Newberry International Produce Ltd.
- Shimla Hills
- SICA SAS SICODIS
- The Pure Food Co.
Qualitative and quantitative analysis of companies has been conducted to help clients understand the wider business environment as well as the strengths and weaknesses of key industry players. Data is qualitatively analyzed to categorize companies as pure play, category-focused, industry-focused, and diversified; it is quantitatively analyzed to categorize companies as dominant, leading, strong, tentative, and weak.
Recent Development and News in Pureed food market
- In September 2024, Apetito Plc unveiled a new and improved range of its world-leading Purée meals, specifically designed to enhance the dining experience for residents with swallowing difficulties.
- In November 2024, Danone launched Fortimel, its first adult Foods for Special Medical Purposes (aFSMP) product in China, to address the nutritional needs of post-surgery patients and those with non-communicable diseases.
- In January 2025, CURRYiT launched India’s only preservative- and chemical-free tomato puree, capitalizing on the rising demand for clean-label food products in the region.
- In March 2025, Ingredion Inc. announced a strategic partnership with a leading packaging firm to develop fully compostable pouches for its puree lines, aiming to reduce plastic waste by 40% by 2028.
Dive into Technavio’s robust research methodology, blending expert interviews, extensive data synthesis, and validated models for unparalleled Pureed Food Market insights. See full methodology.
| Market Scope | |
|---|---|
| Page number | 293 |
| Base year | 2024 |
| Historic period | 2019-2023 |
| Forecast period | 2025-2029 |
| Growth momentum & CAGR | Accelerate at a CAGR of 6.3% |
| Market growth 2025-2029 | USD 4582.1 million |
| Market structure | Fragmented |
| YoY growth 2024-2025(%) | 5.9% |
| Key countries | China, Japan, India, South Korea, Australia, Indonesia, US, Canada, Mexico, UK, Germany, France, Italy, The Netherlands, Spain, Brazil, Argentina, Colombia, Saudi Arabia, UAE, South Africa, Israel and Turkey |
| Competitive landscape | Leading Companies, Market Positioning of Companies, Competitive Strategies, and Industry Risks |
Research Analyst Overview
- The pureed food market is undergoing a significant transformation, moving beyond its traditional strongholds of infant nutrition and clinical care. A central driver of this evolution is the global aging demographic, which creates a sustained demand for specialized geriatric nutrition and texture-modified foods designed to address conditions like dysphagia.
- Boardroom decisions are increasingly focused on product strategies that cater to this segment through culinary innovation and palatability enhancement, aiming to overcome long-standing consumer perceptions. Concurrently, the demand for clean-label ingredients, plant-based purees, and organic certification is pushing manufacturers to invest in advanced technologies like high-pressure processing (HPP) and aseptic processing.
- Firms adopting such technologies have reported a 20% improvement in nutrient retention. The focus on nutrient density and functional ingredients is creating new applications, including meal replacement solutions and convenient formats with sustainable packaging. This push toward premiumization is reshaping the competitive landscape, compelling businesses to balance food safety standards with sophisticated sensory attributes to capture a broader consumer base.
What are the Key Data Covered in this Pureed Food Market Research and Growth Report?
-
What is the expected growth of the Pureed Food Market between 2025 and 2029?
-
USD 4.58 billion, at a CAGR of 6.3%
-
-
What segmentation does the market report cover?
-
The report is segmented by Type (Vegetable puree, Fruit puree, Meat puree, Cereals puree), End-user (Food and beverages, Cosmetics and personal care), Packaging (Cans, Plastic containers, Glass jar, Tins, Others) and Geography (APAC, North America, Europe, South America, Middle East and Africa)
-
-
Which regions are analyzed in the report?
-
APAC, North America, Europe, South America and Middle East and Africa
-
-
What are the key growth drivers and market challenges?
-
Aging global demographic and rising prevalence of dysphagia , Overcoming deep-seated consumer perception and palatability barriers
-
-
Who are the major players in the Pureed Food Market?
-
ABC Fruits, Apetit Plc, Ariza bv, Blossom Foods, David Berryman Ltd., Dohler GmbH, Go Fruselva S.L, Gourmet Pureed, Ingredion Inc., Kanegrade Ltd., Kent Corp., Kiril Mischeff Ltd., Lemonconcentrate S.L.U., Little Spoon Inc., MOM Meal of the Moment, Nascens Enterprises Pvt. Ltd., Newberry International Produce Ltd., Shimla Hills, SICA SAS SICODIS and The Pure Food Co.
-
Market Research Insights
- Market dynamics are increasingly shaped by a pivot toward specialized, high-value offerings such as diabetic-friendly pureed food and culinary-grade purees for foodservice. This shift has enabled providers of subscription-based pureed food to achieve customer retention rates 15% higher than those relying on traditional retail.
- As convenience becomes paramount, single-serve puree pouches are capturing more shelf space, with firms using this format reporting a 10% reduction in logistical costs due to simplified distribution. Furthermore, the focus on specific dietary needs, including pureed food for post-surgery recovery, is driving product differentiation and allowing for premium pricing strategies that improve margins.
We can help! Our analysts can customize this pureed food market research report to meet your requirements.
 RIA -
RIA - 
