Rough-Terrain Crane Market Size 2024-2028
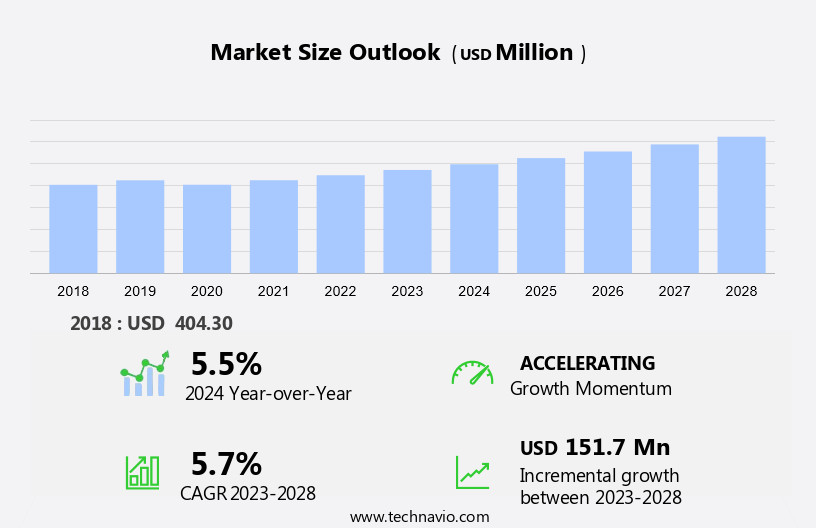
The rough-terrain crane market size is forecast to increase by USD 151.7 million at a CAGR of 5.7% between 2023 and 2028.
- The market is experiencing significant growth due to the increasing demand for contemporary infrastructure development, particularly in the transportation industry and building projects. Rental businesses have emerged as a popular business model, allowing for greater accessibility to high-capacity rough-terrain cranes. However, the market is faced with challenges such as high maintenance and compliance costs. On the upside, the utilities infrastructure sector is witnessing a rise in growth, leading to a higher demand for these cranes. construction activities, particularly in rural and remote areas, also require the use of rough-terrain cranes, further boosting market demand. This trend is expected to continue as infrastructure development remains a priority.
What will be the Size of the Rough-Terrain Crane Market during the forecast period?
- The market in North America is witnessing significant growth due to the increasing demand for specialized lifting solutions in various industries. These cranes are essential for heavy lifting tasks in construction project management, renewable energy infrastructure development, and infrastructure modernization projects. Construction projects require heavy-duty lifting equipment for moving large structures and oversize loads. Rough-terrain cranes offer high lifting capacity and maneuverability, making them a popular choice for construction equipment rental services. The construction industry's focus on efficiency and productivity is driving the demand for these cranes. The renewable energy sector's expansion is another significant factor contributing to the growth of the market.
- wind energy infrastructure development, offshore wind energy projects, and utility projects require heavy lifting services for installing turbines, generators, and other equipment. These projects often take place in challenging terrains, making rough-terrain cranes an ideal choice for lifting and moving heavy components. Industry-specific requirements for infrastructure investment projects necessitate the use of heavy equipment rental services. Mining equipment rental and industrial equipment rental companies provide rough-terrain cranes for infrastructure maintenance, supply chain management, and welding services. These cranes' high capacity and versatility make them indispensable for various applications. The mining industry's focus on energy efficiency and green technology is also driving the demand for rough-terrain cranes.
- These cranes' ability to lift heavy loads in rough terrains makes them ideal for moving mining equipment and materials. Moreover, the integration of cutting-edge technology in rough-terrain cranes enhances their performance and efficiency. Smart infrastructure development is another trend that is gaining traction In the North American market. Rough-terrain cranes' integration with technology such as GPS, remote control, and automation systems enables efficient and precise lifting operations. These features enhance safety, productivity, and reduce operational costs. In summary, the market in North America is witnessing growth due to the increasing demand for specialized lifting solutions in various industries.
- The construction industry's focus on productivity and efficiency, renewable energy infrastructure development, infrastructure investment projects, and the mining industry's focus on energy efficiency are significant factors driving the market's growth. The integration of cutting-edge technology in rough-terrain cranes is enhancing their performance and efficiency, making them an essential tool for various applications.
How is this Rough-Terrain Crane Industry segmented?
The rough-terrain crane industry research report provides comprehensive data (region-wise segment analysis), with forecasts and estimates in "USD million" for the period 2024-2028, as well as historical data from 2018-2022 for the following segments.
- Capacity
- 50-80 tons
- Below 50 tons
- Above 80 tons
- Geography
- North America
- US
- Canada
- APAC
- China
- India
- Japan
- South Korea
- Europe
- France
- Germany
- Russia
- UK
- South America
- Middle East and Africa
- North America
By Capacity Insights
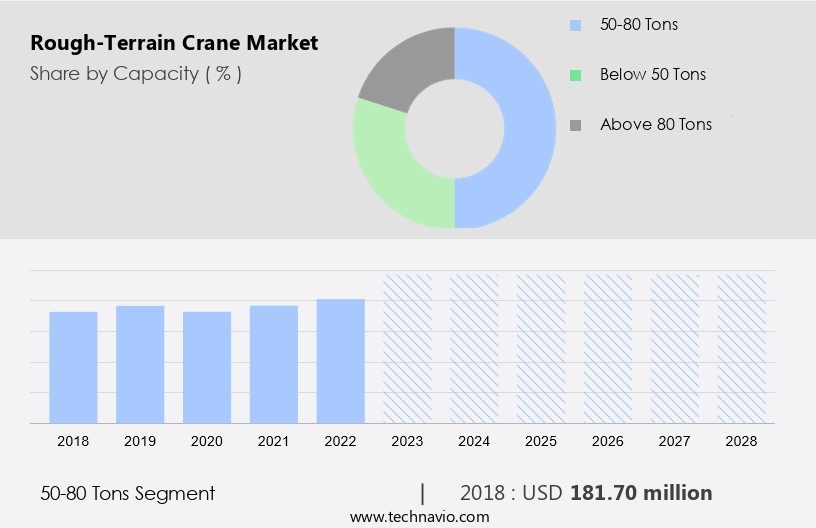
The 50-80 tons segment is estimated to witness significant growth during the forecast period.
In the material handling sector, mid-size rough-terrain cranes, capable of material lifting solutions in challenging environments, have gained significant traction in industries such as construction, oil and gas, and utilities. These cranes, with a lifting capacity between 50-80 tons, excel in maintenance applications due to their efficiency in handling mid-size loads. Manufacturers cater to the demands of these industries by providing rugged axles and machine superstructures, enabling the cranes to function optimally in mud, snow, and other harsh conditions. Additionally, crane cabs are equipped with heating and air conditioning systems to ensure operator comfort. Terex, a leading market player, offers an extensive selection of mid-size rough-terrain cranes, demonstrating the market's commitment to meeting diverse industry needs. This segment's growth is expected to continue, driven by urbanization projects and environmental concerns that necessitate heavy lifting solutions in challenging terrains.
Get a glance at the market report of share of various segments Request Free Sample
The 50-80 tons segment was valued at USD 181.70 million in 2018 and showed a gradual increase during the forecast period.
Regional Analysis
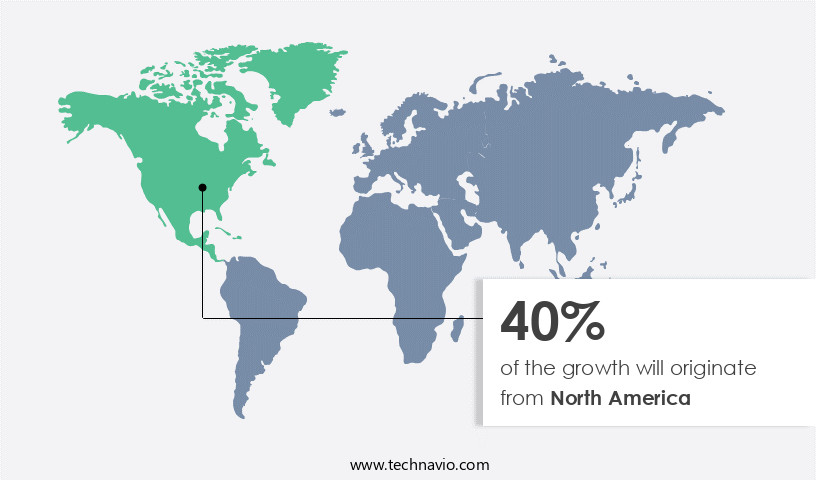
North America is estimated to contribute 40% to the growth of the global market during the forecast period. Technavio's analysts have elaborately explained the regional trends and drivers that shape the market during the forecast period.
For more insights on the market size of various regions, Request Free Sample
In North America, the expansion of major industries such as construction, oil and gas, and utilities has fuelled the demand for rough-terrain cranes. The US, being a significant contributor to these sectors, is leading the market In the region. Renewable energy initiatives have instigated substantial infrastructure development, boosting the requirement for these cranes. Key players, including Manitowoc and Terex, headquartered In the US, dominate the market.
Market Dynamics
Our researchers analyzed the data with 2023 as the base year, along with the key drivers, trends, and challenges. A holistic analysis of drivers will help companies refine their marketing strategies to gain a competitive advantage.
What are the key market drivers leading to the rise In the adoption of Rough-Terrain Crane Industry?
- Rapid growth of utilities infrastructure is the key driver of the market. Rough-terrain cranes are in high demand due to their ability to effectively handle heavy lifting tasks in challenging environments, making them indispensable for the installation and maintenance of utility infrastructure and industrial machinery. The expansion of global utilities infrastructure has significantly contributed to the growth of the market in recent years. In the US, there has been a notable increase in investments towards renewable energy sources such as wind, solar, and hydropower, which has led to an uptick in the demand for these cranes.
- Europe, specifically countries like the Netherlands, Belgium, and Austria, have seen a rise in wind energy installations. According to the Global Wind Energy Council (GWEC), the Netherlands installed close to 1 GW of wind energy capacity in 2020 alone. These industry-specific requirements, coupled with government expenditure towards infrastructure development, continue to fuel the growth of the market. Thus, such factors are driving the growth of the market during the forecast period.
What are the market trends shaping the Rough-Terrain Crane Industry?
- Popularity of high-capacity rough-terrain cranes is the upcoming market trend. The rental market for rough-terrain cranes has witnessed significant growth in the United States due to the expansion of contemporary infrastructure projects in the transportation industry and construction activities. These cranes are essential for lifting and moving heavy modular components in challenging terrains.
- Leading rental businesses, such as Manitowoc and Tadano, provide high-capacity rough-terrain cranes with over 120-ton lifting capacity. These advancements in crane design offer lighter equipment, making transportation easier while maintaining the ability to handle heavy loads. End-users prefer investing in high-capacity rough-terrain cranes due to their versatility, as they can cover all the lift requirements without additional costs for other crane types. Thus, such trends will shape the growth of the market during the forecast period.
What challenges does the Rough-Terrain Crane Industry face during its growth?
- High maintenance and compliance costs is a key challenge affecting the industry growth. The market encompasses numerous global manufacturers, both domestic and international. Due to the varying demands in various markets, these manufacturers are obliged to create a vast selection of rough-terrain cranes to cater to both domestic and export needs.
- For example, the design of rough-terrain crane chassis and axle specifications used in the market differ from those in Europe. The substantial production costs for these manufacturers ultimately influence the price for buyers. Additionally, the implementation of stringent regulations, such as Stage V in Europe, which aim to control emissions from heavy industrial machinery, including rough-terrain cranes, will lead to a substantial increase in production costs during the initial period of the forecast. This market caters to various industries, including infrastructure development and mining, where large loads require lifting in rough terrain. Hence, the above factors will impede the growth of the market during the forecast period.
Exclusive Customer Landscape
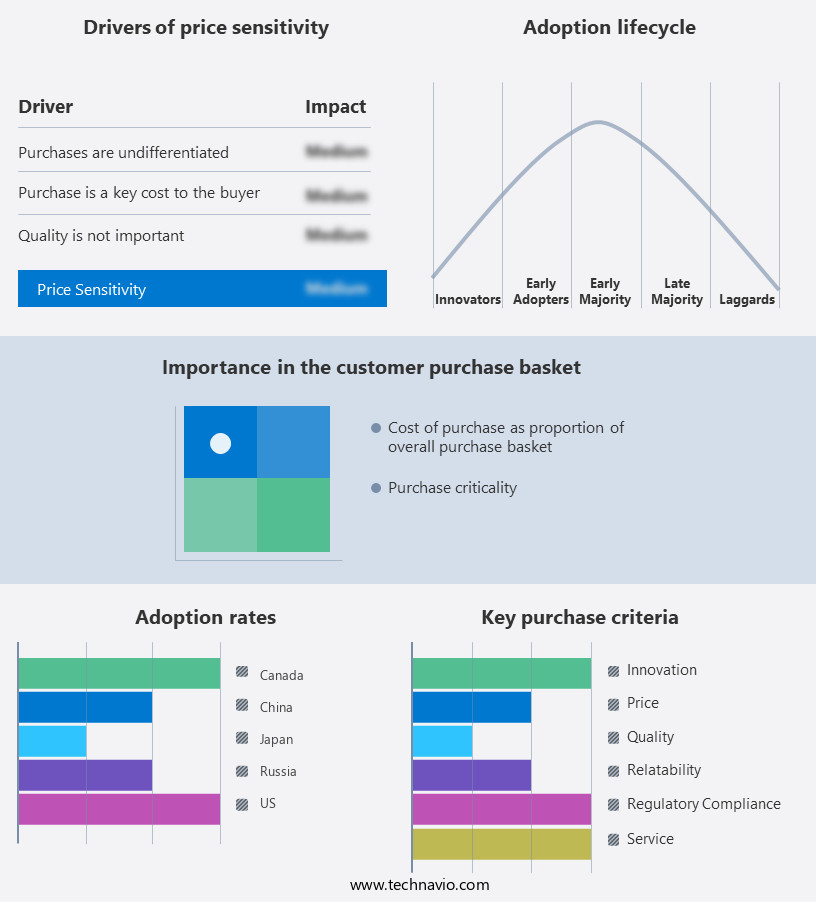
The rough-terrain crane market forecasting report includes the adoption lifecycle of the market, covering from the innovator's stage to the laggard's stage. It focuses on adoption rates in different regions based on penetration. Furthermore, the rough-terrain crane market report also includes key purchase criteria and drivers of price sensitivity to help companies evaluate and develop their market growth analysis strategies.
Customer Landscape
Key Companies & Market Insights
Companies are implementing various strategies, such as strategic alliances, rough-terrain crane market forecast, partnerships, mergers and acquisitions, geographical expansion, and product/service launches, to enhance their presence In the industry.
The industry research and growth report includes detailed analyses of the competitive landscape of the market and information about key companies, including:
- Broderson Manufacturing Corp.
- KATO WORKS CO. LTD.
- Kobelco Construction Machinery International Trading Co. Ltd.
- Liebherr International AG
- Sany Group
- Sumitomo Heavy Industries Ltd.
- Tadano Ltd.
- Terex Corp.
- The Manitowoc Co. Inc.
- TIL Ltd.
- Xuzhou Construction Machinery Group Co. Ltd.
- Zoomlion Heavy Industry Science and Technology Co. Ltd.
Qualitative and quantitative analysis of companies has been conducted to help clients understand the wider business environment as well as the strengths and weaknesses of key industry players. Data is qualitatively analyzed to categorize companies as pure play, category-focused, industry-focused, and diversified; it is quantitatively analyzed to categorize companies as dominant, leading, strong, tentative, and weak.
Research Analyst Overview
Rough terrain cranes are essential machinery In the construction and infrastructure development sectors, designed to handle heavy lifting tasks on uneven and challenging terrains. These cranes offer high capacity and versatility, making them indispensable for various industries, including the mining, transportation, and utility infrastructure sectors. The demand for rough terrain cranes is driven by industry-specific requirements and the need for contemporary infrastructure development. The market for rough terrain cranes is witnessing significant growth due to the increasing focus on infrastructure development and the transportation industry's growing need for large-capacity cranes. Rough terrain cranes are used extensively in construction activities, particularly for building projects that require high loads and long boom lengths.
Telematics systems and automation technologies are transforming the rough terrain crane market, enabling rental businesses to optimize their fleet usage and improve operational efficiency. Hydraulic disc brakes and rugged axles are crucial features that enhance the cranes' performance and durability. The mining industry's ongoing expansion and the oil & gas sector's growing focus on pipeline construction are significant contributors to the rough terrain crane market's growth. The market is also influenced by environmental concerns and the adoption of machine superstructures made of advanced alloys and materials science technologies. Government expenditure on urbanization projects and power generation initiatives further boosts the demand for rough terrain cranes. The market is expected to continue its growth trajectory, driven by the need for heavy lifting solutions in various industries and the increasing focus on infrastructure development.
|
Market Scope |
|
|
Report Coverage |
Details |
|
Page number |
176 |
|
Base year |
2023 |
|
Historic period |
2018-2022 |
|
Forecast period |
2024-2028 |
|
Growth momentum & CAGR |
Accelerate at a CAGR of 5.7% |
|
Market growth 2024-2028 |
USD 151.7 million |
|
Market structure |
Fragmented |
|
YoY growth 2023-2024(%) |
5.5 |
|
Key countries |
US, Japan, China, Russia, Canada, India, South Korea, UK, Germany, and France |
|
Competitive landscape |
Leading Companies, Market Positioning of Companies, Competitive Strategies, and Industry Risks |
What are the Key Data Covered in this Rough-Terrain Crane Market Research and Growth Report?
- CAGR of the Rough-Terrain Crane industry during the forecast period
- Detailed information on factors that will drive the growth and forecasting between 2024 and 2028
- Precise estimation of the size of the market and its contribution of the industry in focus to the parent market
- Accurate predictions about upcoming growth and trends and changes in consumer behaviour
- Growth of the market across North America, APAC, Europe, South America, and Middle East and Africa
- Thorough analysis of the market's competitive landscape and detailed information about companies
- Comprehensive analysis of factors that will challenge the rough-terrain crane market growth of industry companies
We can help! Our analysts can customize this rough-terrain crane market research report to meet your requirements.


