
Sextech Market Size 2024-2028
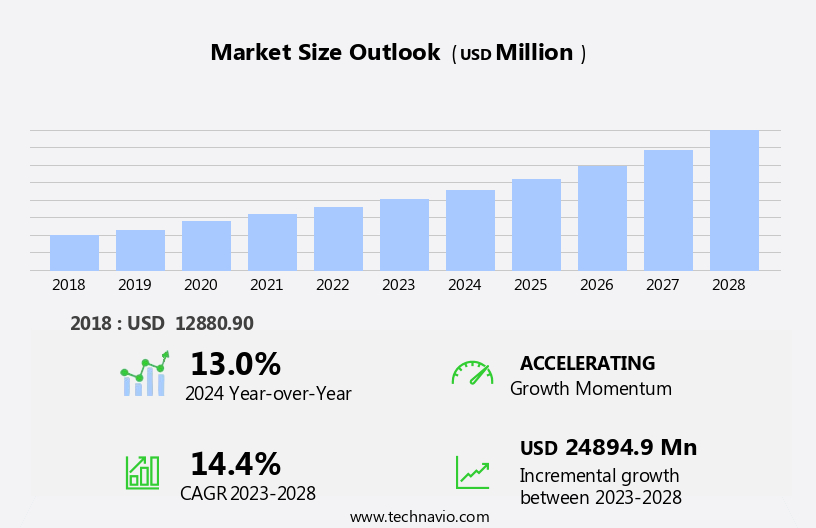
The sextech market size is forecast to increase by USD 24.89 billion at a CAGR of 14.4% between 2023 and 2028.
-
The market is experiencing significant growth, driven by rising awareness of sexual wellness and the launch of innovative devices. Market companies are introducing advanced sex toys with features such as Bluetooth connectivity, enabling users to control their devices remotely.
-
Virtual Reality (VR) technology is another trend transforming the market, offering enriching sexual experiences. However, growing data and privacy concerns pose a challenge, requiring companies to prioritize user security and confidentiality. As the market continues to evolve, these factors will shape its trajectory.
What will be the Size of the Sextech Market During the Forecast Period?
- Sextech, the intersection of technology and sexual health, is revolutionizing the way we approach intimacy and personal well-being. This burgeoning industry is transforming the landscape of sexual experiences, catering to diverse needs and preferences. Sextech is bridging geographical gaps, enabling individuals to connect on a deeper level through remote-controlled sex toys and SexTech apps on smartphones. These innovative solutions allow partners to explore new dimensions of intimacy, regardless of their physical location. Embracing Diversity: LGBTQ+ and Sextech Sextech is fostering inclusivity by catering to the unique needs of the LGBTQ+ community.
- Moreover, from remote-controlled toys to virtual reality experiences, these technological advancements are breaking down barriers and promoting sexual freedom for all. Personal Well-being and Sexual Health Sextech is not just about pleasure; it's also about promoting sexual health and well-being. Wearable devices, erogenous zone massagers, and AI-assisted sex education apps are just a few examples of how technology is being used to enhance sexual experiences while prioritizing health and safety.
How is this market segmented and which is the largest segment?
The market research report provides comprehensive data (region-wise segment analysis), with forecasts and estimates in "USD billion" for the period 2024-2028, as well as historical data from 2018-2022 for the following segments.
- Type
- Bluetooth enabled sex toys
- Remote sex interfaces
- Sexual wellness platform
- Sex Robots
- Others
- Distribution Channel
- Online
- Offline
- Geography
- North America
- Canada
- US
- Europe
- Germany
- UK
- APAC
- China
- South America
- Middle East and Africa
- North America
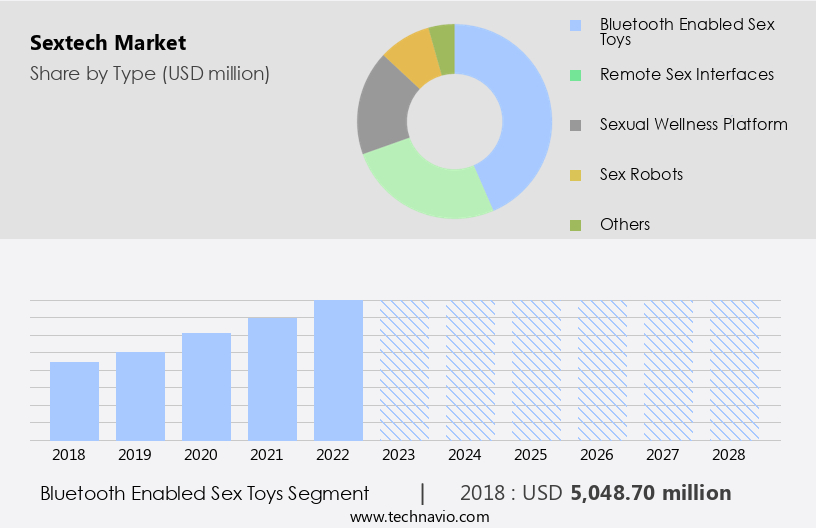
By Type Insights
- The bluetooth enabled sex toys segment is estimated to witness significant growth during the forecast period.
The sextech industry has experienced notable growth, notably in the realm of Bluetooth-enabled sex toys. These advanced devices cater to consumers' demands for convenience and connectivity. Users can operate these toys remotely via smartphone applications, making them ideal for long-distance relationships. This technology fosters a deeper emotional bond between partners, as it allows for real-time customization and control of sensations.
Furthermore, users can personalize their experiences by adjusting various settings and modes, ensuring each interaction is unique and catered to their preferences. The integration of Bluetooth technology into sex toys signifies a new era in the sextech industry, revolutionizing the way intimacy is experienced and expressed within the digital realm.
Get a glance at the market report of share of various segments Request Free Sample
The Bluetooth enabled sex toys segment was valued at USD 5.05 billion in 2018 and showed a gradual increase during the forecast period.
Regional Analysis
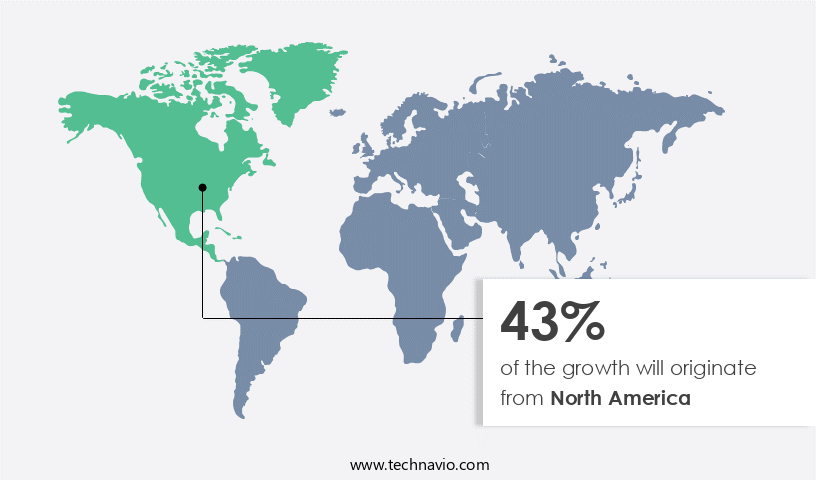
- North America is estimated to contribute 43% to the growth of the global market during the forecast period.
Technavio's analysts have elaborately explained the regional trends and drivers that shape the market during the forecast period.
For more insights on the market share of various regions Request Free Sample
The market is experiencing remarkable expansion, driven by rising disposable income and a growing emphasis on sexual wellness. In the US and Canada, consumers are investing in innovative sextech products, viewing them not just as sources of pleasure but also as tools for health and well-being. Canada's disposable income has also experienced steady growth, averaging a 4% increase. The sextech industry in North America is at the forefront of global trends. These advancements are transforming the way people approach their sexual health and relationships, offering new experiences and opportunities for exploration.
Market Dynamics
Our researchers analyzed the data with 2023 as the base year, along with the key drivers, trends, and challenges. A holistic analysis of drivers will help companies refine their marketing strategies to gain a competitive advantage.
What are the key market drivers leading to the rise in adoption of Sextech Market?
Rising awareness of sexual wellness is the key driver of the market.
- The sextech industry is witnessing remarkable expansion, fueled by the growing recognition of sexual health and wellness. This trend is primarily driven by an expanding range of products and services addressing diverse facets of sexual health and pleasure.
- These offerings encompass educational mobile apps, health-focused wearable devices, and more. These companies are revolutionizing the industry with their innovative approaches, providing individuals with the tools and resources to enhance their intimate experiences and prioritize their personal well-being. Thus, such factors are driving the growth of the market during the forecast period.
What are the market trends shaping the Sextech Market?
The launch of new devices by market companies is the upcoming trend in the market.
- The sextech industry is experiencing a transformative period, marked by the introduction of technologically advanced devices designed to elevate user experience and broaden market scope.
- Moreover, this innovation enables hands-free operation and a more engaging pleasure experience, reflecting the industry's increasing focus on integrating technology with sexual wellness products. In May 2023, Doc Johnson Enterprises made waves with their new line of signature dildos, meticulously crafted from adult film stars Owen Grey and Small Hands. These developments underscore the growing demand for customization and interactivity in the realm of sex tech. Thus, such SexTech market trends will shape the growth of the market during the forecast period.
What challenges does Sextech Market face during the growth?
Growing data and privacy concerns is a key challenge affecting the market growth.
- The sextech industry's rapid growth is marked by advancements in remote-controlled sex toys and smartphone apps, driven by Artificial Intelligence (AI) and technology. However, this progression brings forth unique challenges, particularly in the realm of data privacy. As these applications and devices collect sensitive information about users' sexual preferences, behaviors, and health data, safeguarding this information from unauthorized access, breaches, and misuse is essential to preserving user trust and privacy.
- The sextech sector currently lacks standardized privacy practices and regulations, leaving consumers exposed and fueling apprehensions about data protection and confidentiality. The urgency for stringent privacy policies governing the collection, processing, and storage of intimate data cannot be overstated. Implementing strong encryption methods, multi-factor authentication, and secure data storage are essential steps in protecting users' privacy rights. Additionally, collaborating with regulatory bodies to establish clear guidelines tailored to the sextech industry will further bolster data security and alleviate consumer concerns. Hence, the above factors will impede the growth of the market during the forecast period.
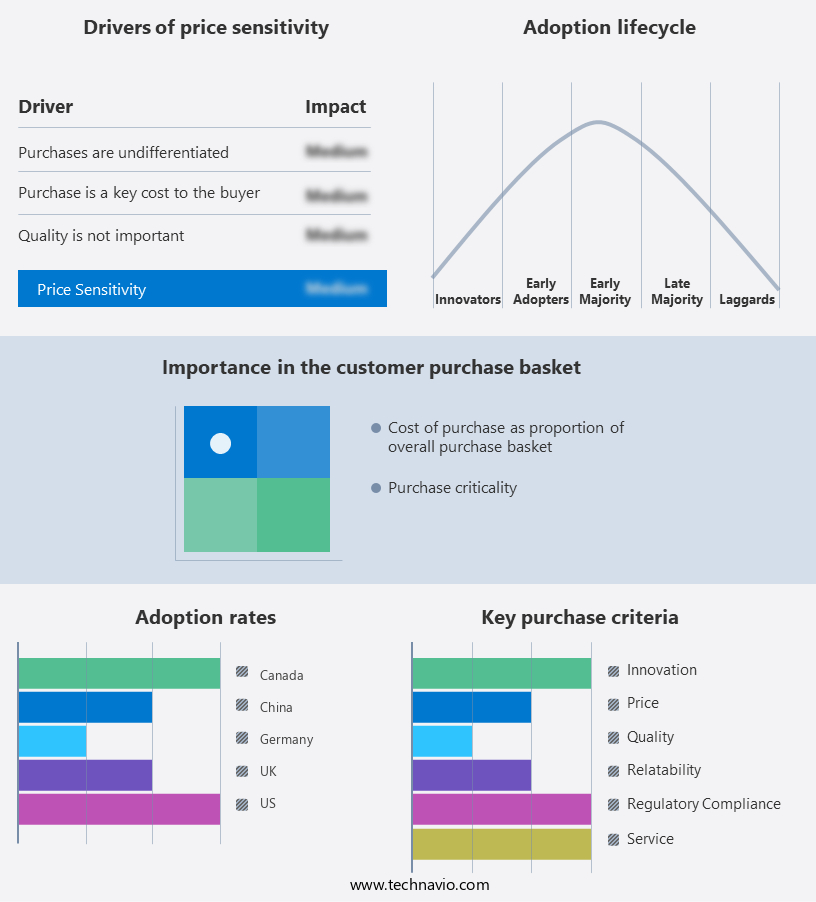
Exclusive Customer Landscape
The market forecasting report includes the adoption lifecycle of the market, covering from the innovator's stage to the laggard's stage. It focuses on adoption rates in different regions based on penetration. Furthermore, the market report also includes key purchase criteria and drivers of price sensitivity to help companies evaluate and develop their market growth analysis strategies.
Customer Landscape
Key Companies & Market Insights
Sextech companies are implementing various strategies, such as strategic alliances, market forecast, partnerships, mergers and acquisitions, geographical expansion, and product/service launches, to enhance their presence in the market.
The market research and growth report includes detailed analyses of the competitive landscape of the market and information about key companies, including:
- Aquafit Intimate
- Blueheart
- Creative Banter Inc.
- Dame Products Inc.
- DS Doll Robotics
- HANX
- KAMA
- LELOi AB
- Lovehoney Group Ltd.
- Luvu Brands Inc.
- MYSTERYVIBE Ltd.
- NEW WELLNESS CONCEPT S.L.
- RealDoll
- TENGA Co. Ltd
- The Sybian
- Vibease Pte Ltd
- WOW Tech International GmbH
Qualitative and quantitative analysis of companies has been conducted to help clients understand the wider business environment as well as the strengths and weaknesses of key market players. Data is qualitatively analyzed to categorize companies as pure play, category-focused, industry-focused, and diversified; it is quantitatively analyzed to categorize companies as dominant, leading, strong, tentative, and weak.
Research Analyst Overview
Remote connection technologies, such as Bluetooth and AI-powered smartphone apps, enable users to explore new dimensions of pleasure with remote-controlled sex toys. These devices offer a discreet and convenient way to enhance sexual experiences. The rise of Bluetooth connectivity and technology adoption in E-commerce has sparked a societal shift and cultural shift, with D2C (Direct-to-Consumer) brands leveraging digital platforms to boost sex toy sales, while also addressing diverse sexual orientation and integrating humanoid robots into the consumer experience. Artificial intelligence and virtual reality (VR) technologies are also transforming the landscape. AI-enhanced sex toys can learn user preferences and adapt to individual needs, while VR porn and sex robots cater to diverse sexual orientations and fantasies.
Furthermore, the market is experiencing rapid growth, fueled by the societal and cultural shifts towards open discussions about sexuality and self-care. Direct-to-consumer (D2C) sales, e-commerce, and digital marketing are driving the adoption of these innovative technologies. Wearable devices, erogenous zone massagers, and other Bluetooth-enabled sex toys are becoming increasingly popular. As technology continues to evolve, the possibilities for sexual wellness and exploration are endless.
|
Market Scope |
|
|
Report Coverage |
Details |
|
Page number |
200 |
|
Base year |
2023 |
|
Historic period |
2018-2022 |
|
Forecast period |
2024-2028 |
|
Growth momentum & CAGR |
Accelerate at a CAGR of 14.4% |
|
Market Growth 2024-2028 |
USD 24.89 billion |
|
Market structure |
Fragmented |
|
YoY growth 2023-2024(%) |
13.0 |
|
Key countries |
US, UK, Germany, China, and Canada |
|
Competitive landscape |
Leading Companies, Market Positioning of Companies, Competitive Strategies, and Industry Risks |
What are the Key Data Covered in this Market Research and Growth Report?
- CAGR of the market during the forecast period
- Detailed information on factors that will drive the market growth and forecasting between 2024 and 2028
- Precise estimation of the size of the market and its contribution of the market in focus to the parent market
- Accurate predictions about upcoming market growth and trends and changes in consumer behaviour
- Growth of the market across North America, Europe, APAC, South America, and Middle East and Africa
- Thorough analysis of the market's competitive landscape and detailed information about companies
- Comprehensive analysis of factors that will challenge the growth of market companies
We can help! Our analysts can customize this market research report to meet your requirements. Get in touch
 RIA -
RIA - 
