Sharing Economy Market Analysis, Size, and Forecast 2026-2030: APAC (China, India, and Japan), Europe (UK, Germany, and France), North America (US, Canada, and Mexico), South America (Brazil and Argentina), Middle East and Africa (UAE, Saudi Arabia, and South Africa), and Rest of World (ROW)

Sharing Economy Market Analysis, Size, and Forecast 2026-2030:
APAC (China, India, and Japan), Europe (UK, Germany, and France), North America (US, Canada, and Mexico), South America (Brazil and Argentina), Middle East and Africa (UAE, Saudi Arabia, and South Africa), and Rest of World (ROW)

Published: Mar 2026 299 Pages SKU: IRTNTR76975

Market Overview at a Glance

$1468.7 B
Market Opportunity
33.2%
CAGR 2025 - 2030
33%
APAC Growth
$165.3 B
Sharing accommodation segment 2024

Sharing Economy Market Size 2026-2030

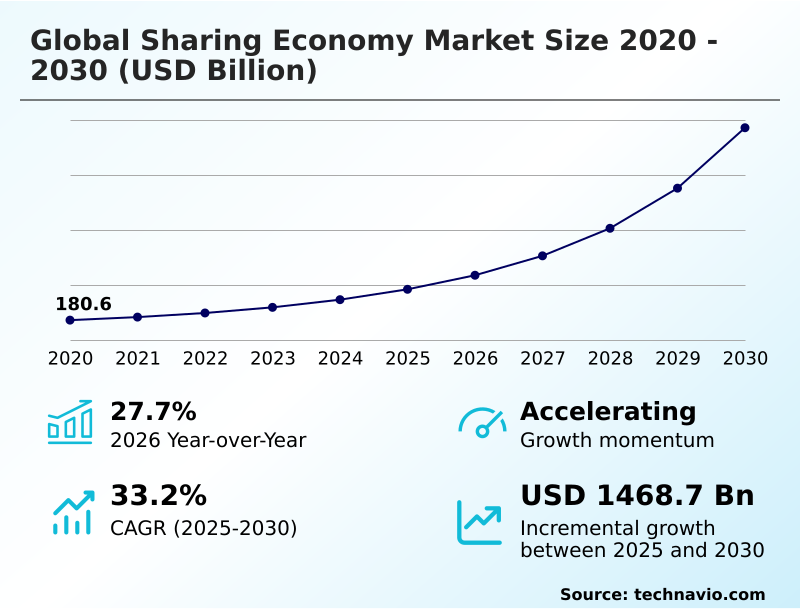
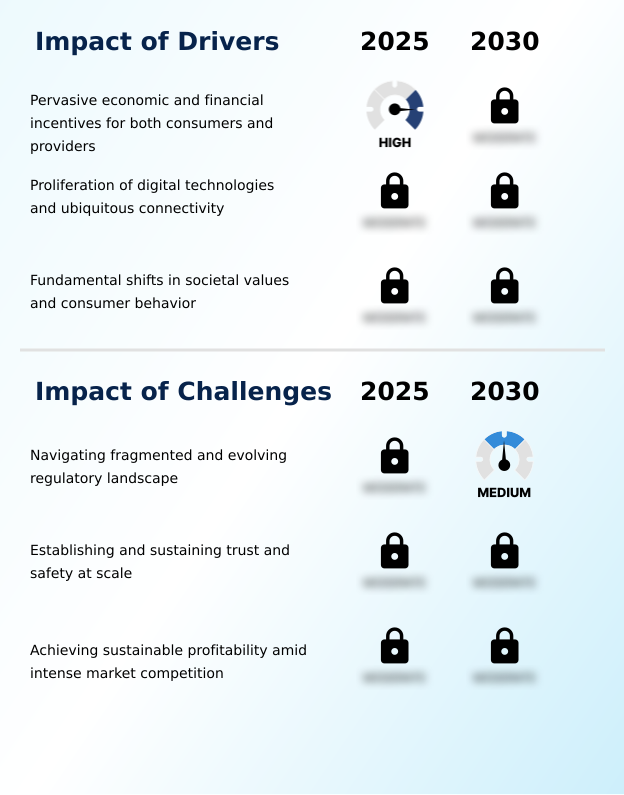
The sharing economy market size is valued to increase by USD 1468.7 billion, at a CAGR of 33.2% from 2025 to 2030. Pervasive economic and financial incentives for both consumers and providers will drive the sharing economy market.

Major Market Trends & Insights

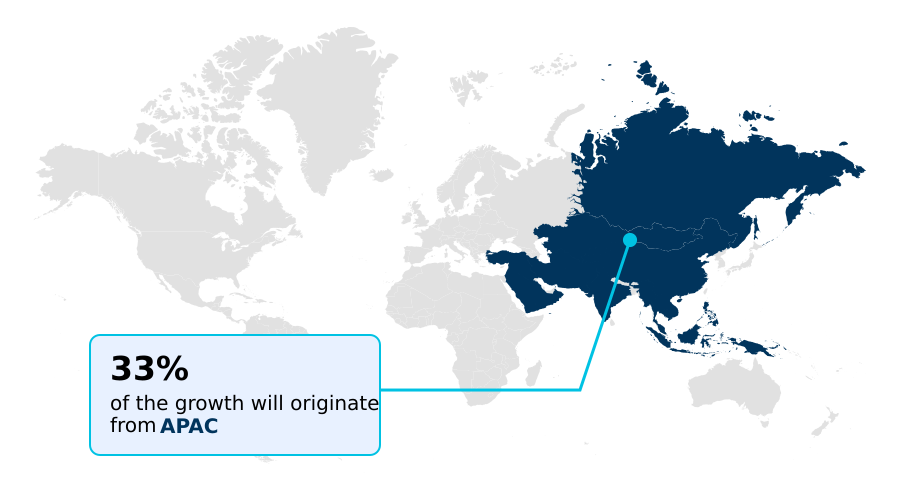
  • APAC dominated the market and accounted for a 33% growth during the forecast period.
  • By Type - Sharing accommodation segment was valued at USD 165.3 billion in 2024
  • By End-user - Individual segment accounted for the largest market revenue share in 2024

Market Size & Forecast

  • Market Opportunities: USD 1749 billion
  • Market Future Opportunities: USD 1468.7 billion
  • CAGR from 2025 to 2030 : 33.2%

Market Summary

  • The sharing economy market continues its transformative impact, fundamentally reshaping consumption patterns and industry structures. This economic model, defined by the peer-to-peer exchange of goods and services, prioritizes access over ownership, a principle driving high adoption among modern consumers.
  • Platforms within the global sharing economy market 2026-2030 are built on advanced digital technologies, leveraging dynamic pricing algorithms and digital reputation systems to facilitate trust and efficiency. A key business scenario involves urban logistics, where on-demand service platforms optimize last-mile delivery networks, allowing businesses to manage fluctuating demand without investing in a private fleet.
  • This shift to an asset-light model is propelled by a desire for cost-efficiency and operational agility. However, the sector grapples with challenges, including intense competition that compresses margins and a complex regulatory environment surrounding gig worker classification.
  • The ongoing evolution is marked by diversification into new verticals, such as B2B sharing models and peer-to-peer finance, indicating a maturation beyond its consumer-facing origins and a deeper integration into the broader economic framework. The future hinges on achieving sustainable profitability while navigating these complex dynamics.

What will be the Size of the Sharing Economy Market during the forecast period?

Get Key Insights on Market Forecast (PDF) Request Free Sample

How is the Sharing Economy Market Segmented?

The sharing economy industry research report provides comprehensive data (region-wise segment analysis), with forecasts and estimates in "USD billion" for the period 2026-2030, as well as historical data from 2020-2024 for the following segments.
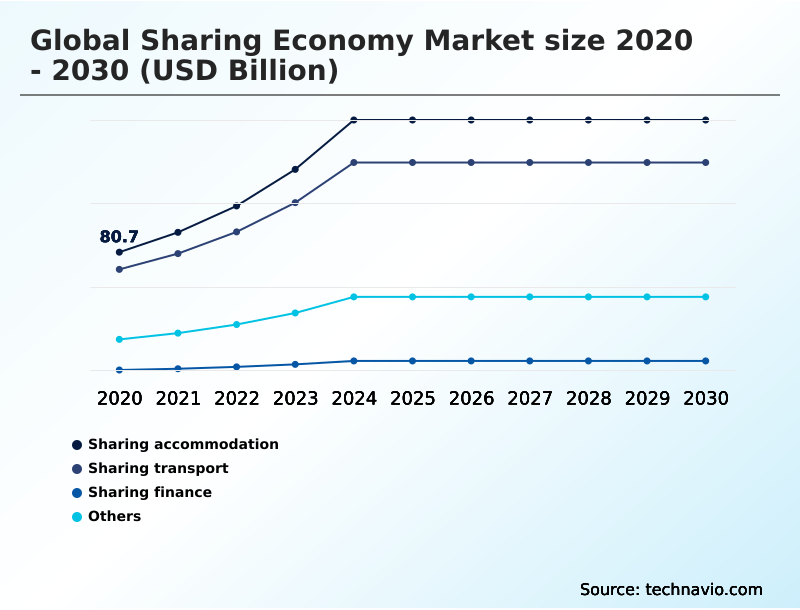
  • Type
    • Sharing accommodation
    • Sharing transport
    • Sharing finance
    • Others
  • End-user
    • Individual
    • Business
  • Age group
    • Millennials
    • Generation X
    • Generation Z
    • Boomers
  • Geography
    • APAC
      • China
      • India
      • Japan
    • Europe
      • UK
      • Germany
      • France
    • North America
      • US
      • Canada
      • Mexico
    • South America
      • Brazil
      • Argentina
    • Middle East and Africa
      • UAE
      • Saudi Arabia
      • South Africa
    • Rest of World (ROW)

By Type Insights

The sharing accommodation segment is estimated to witness significant growth during the forecast period.

The global sharing economy market is segmented across diverse verticals, with shared accommodation platforms representing a highly mature pillar.

This model, built on the principle of an access over ownership model, enables the peer-to-peer exchange of residential space, driven by consumer demand for authentic, localized experiences.

The technological framework relies on sophisticated on-demand service platforms that integrate two-way rating systems and a robust digital reputation system to foster community-based trust and enable frictionless transactions. Beyond lodging, segmentation includes rapidly growing micromobility services.

Effective asset utilization optimization is critical, with leading platforms achieving over 15% improvement in resource utilization efficiency by leveraging user-generated reputation systems. This focus on trust directly enhances customer lifetime value across all segments.

Request Free Sample

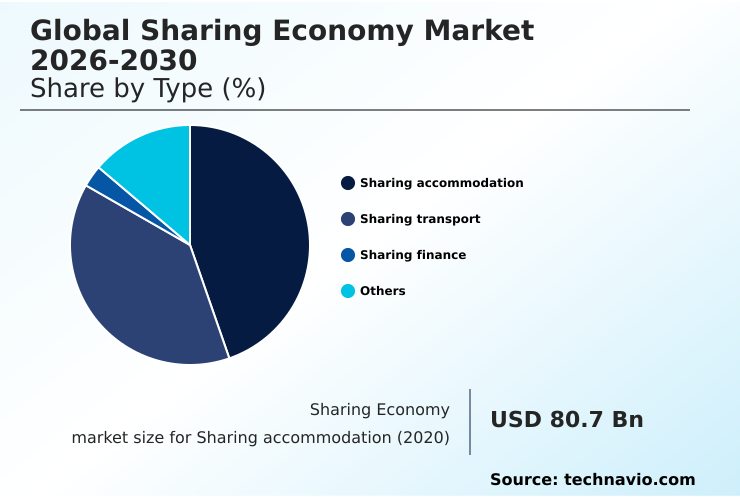
The Sharing accommodation segment was valued at USD 165.3 billion in 2024 and showed a gradual increase during the forecast period.

Request Free Sample

Regional Analysis

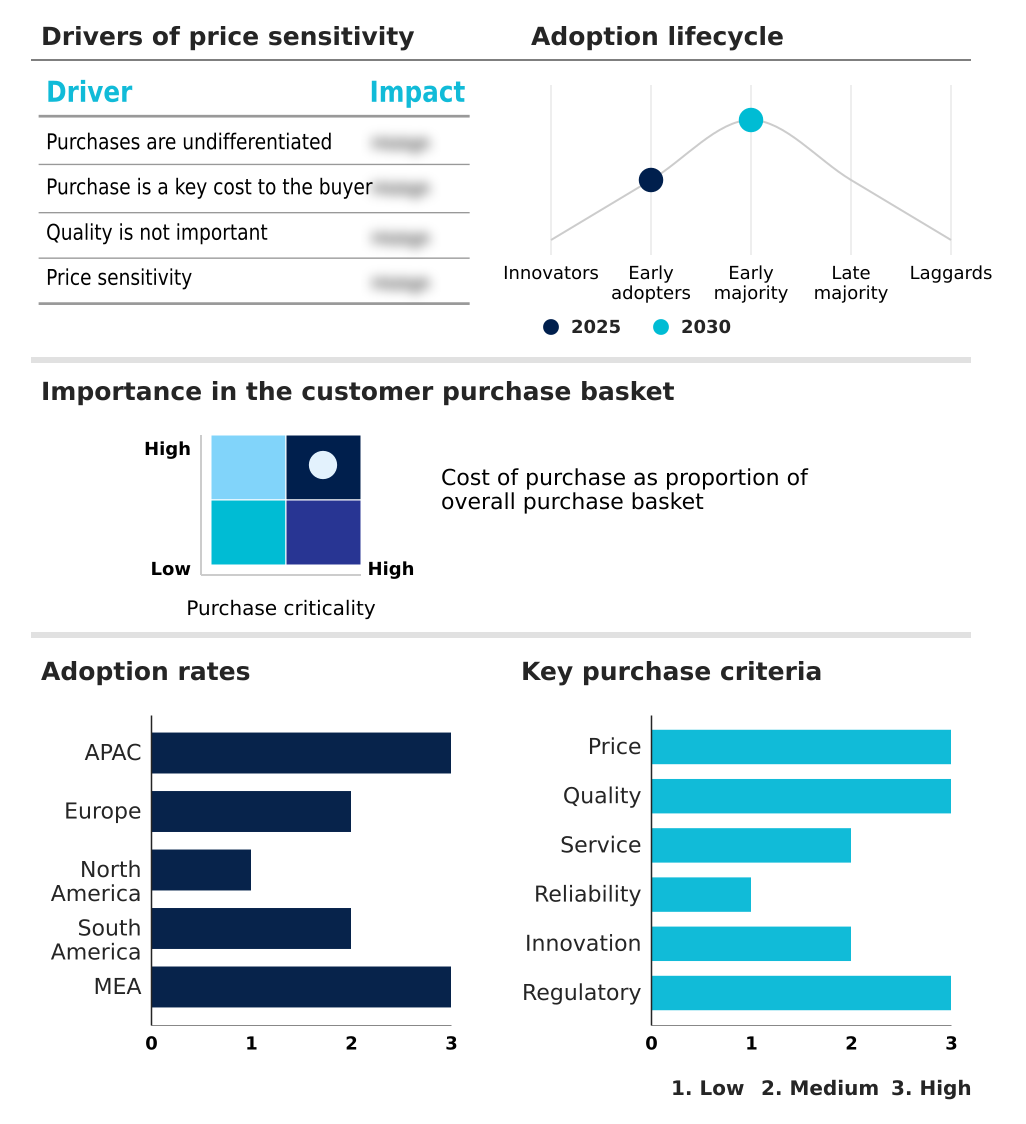
APAC is estimated to contribute 33% to the growth of the global market during the forecast period.Technavio’s analysts have elaborately explained the regional trends and drivers that shape the market during the forecast period.

See How Sharing Economy Market Demand is Rising in APAC Request Free Sample

The geographic landscape is diverse, with market dynamics varying significantly by region.

In North America, on-demand transportation and peer-to-peer car sharing are mature segments, while Europe shows strong growth in food sharing platforms and flexible workspace solutions driven by value-driven consumption.

The APAC region is characterized by mobile-first super-apps with strong network effects, where last-mile delivery services have captured over 60% of the urban on-demand market.

In contrast, emerging markets in South America and Africa are seeing growth in peer-to-peer storage and skill-sharing platforms that address local infrastructure gaps. This regional differentiation requires companies to adopt flexible, asset-light business models.

For instance, platforms in mature markets are reporting a 10% higher customer lifetime value compared to those in emerging regions, underscoring the importance of localized strategies.

Market Dynamics

Our researchers analyzed the data with 2025 as the base year, along with the key drivers, trends, and challenges. A holistic analysis of drivers will help companies refine their marketing strategies to gain a competitive advantage.

  • The strategic evolution of the sharing economy is now centered on advanced technology and nuanced operational strategies. The impact of AI on sharing platforms is profound, with algorithmic balancing of supply and demand becoming standard. Simultaneously, the impact of IoT on asset sharing enables real-time tracking and predictive maintenance.
  • This technological shift supports a significant expansion into B2B sharing economy use cases, where sharing economy for enterprise logistics offers substantial cost savings over traditional models; some firms report that managing quality in decentralized services through tech has improved reliability by over 25% compared to non-monitored systems. However, significant hurdles remain.
  • The regulatory challenges in urban mobility and the legal classification of gig workers create persistent uncertainty. Consequently, building trust in peer-to-peer marketplaces is a primary focus, directly linked to risk management for P2P platforms. For many, achieving profitability in ride-hailing is still elusive.
  • In response, platforms are refining user retention strategies for super-apps and exploring public-private partnerships in mobility, including integrating sharing services with transit. Sustainability in accommodation sharing is also a growing concern for consumers. Internally, operators focus on dynamic pricing models in transport and leveraging network effects in sharing platforms.
  • The role of blockchain in sharing finance promises enhanced security, while the core business goal remains monetizing idle assets for businesses, a concept that addresses the central sharing economy impact on ownership.

What are the key market drivers leading to the rise in the adoption of Sharing Economy Industry?

  • The key market driver is the pervasive economic and financial incentives available to both consumers seeking cost-effective access and providers monetizing underutilized assets.

  • The market is fundamentally propelled by the access over ownership model, which resonates with consumers embracing asset-light lifestyle principles and sustainable consumption patterns. This fuels underutilized asset monetization, enabling a flexible gig economy workforce to generate income.
  • Platforms leveraging predictive analytics for demand have demonstrated a 25% increase in resource utilization efficiency. The proliferation of digital technologies, from digital identity verification to integrated payment systems, creates frictionless transactions and fosters the social capital creation necessary for trust.
  • This technological backbone supports the expansion of hyperlocal delivery networks and complex mobility-as-a-service (MaaS) integrations.
  • The dual value proposition of cost savings for consumers and income generation for providers creates a self-reinforcing growth cycle, embedding collaborative consumption into the modern economy.

What are the market trends shaping the Sharing Economy Industry?

  • Strategic consolidation and the diversification of service portfolios are defining the market's maturation, driven by intense competition and the strategic imperative to build integrated user ecosystems.

  • The market is defined by strategic consolidation, as platforms evolve into integrated super-app ecosystems to drive user stickiness enhancement. This trend sees companies moving into enterprise-focused sharing and B2B sharing models, with some firms improving corporate agility by over 20%.
  • A second transformative trend is the deep integration of AI and IoT, which enables advanced data-driven decision making and a seamless user experience. The application of these technologies has been shown to improve demand forecasting accuracy by up to 30%.
  • Furthermore, blockchain is emerging to support decentralized governance models and enhance trust in transactions, facilitating greater cross-industry integration and solidifying the market's shift from niche services to comprehensive digital ecosystems.

What challenges does the Sharing Economy Industry face during its growth?

  • A primary challenge affecting industry growth is navigating the fragmented and continuously evolving regulatory landscape that varies significantly across different jurisdictions.

  • A primary challenge is navigating the fragmented regulatory compliance framework, particularly concerning gig worker classification, which can increase operational costs by over 15% for some platforms. Establishing trust at scale for peer-to-peer transactions remains a critical hurdle, demanding investment in a robust reputation economy framework built on two-way rating systems and secure in-app communication channels.
  • In emerging segments like peer-to-peer lending platforms and equity crowdfunding, ensuring security through methods like smart contract execution is paramount. The path to profitability is another significant challenge, complicated by intense competition. Failure to achieve a profitable model has led to some platforms ceasing operations, impacting shared logistics capacity and the burgeoning expert economy.

Exclusive Technavio Analysis on Customer Landscape

The sharing economy market forecasting report includes the adoption lifecycle of the market, covering from the innovator’s stage to the laggard’s stage. It focuses on adoption rates in different regions based on penetration. Furthermore, the sharing economy market report also includes key purchase criteria and drivers of price sensitivity to help companies evaluate and develop their market growth analysis strategies.

Customer Landscape of Sharing Economy Industry

Competitive Landscape

Companies are implementing various strategies, such as strategic alliances, sharing economy market forecast, partnerships, mergers and acquisitions, geographical expansion, and product/service launches, to enhance their presence in the industry.

Airbnb Inc. - Analyzes platforms facilitating short-term home rentals and peer-to-peer accommodation, enabling the monetization of private residential spaces for travel and hospitality experiences.

The industry research and growth report includes detailed analyses of the competitive landscape of the market and information about key companies, including:

  • Airbnb Inc.
  • Bolt Technology OU
  • Comuto SA
  • Couchsurfing International
  • DiDi Global Inc.
  • GoShare Inc.
  • Homestay.com Ltd.
  • JustPark Parking Ltd.
  • Luup Inc.
  • Lyft Inc.
  • Neighbor Storage Inc.
  • Neutron Holdings Inc.
  • Spotahome Ltd.
  • Stashbee Ltd.
  • Turo Inc.
  • Uber Technologies Inc.
  • WeWork Inc.

Qualitative and quantitative analysis of companies has been conducted to help clients understand the wider business environment as well as the strengths and weaknesses of key industry players. Data is qualitatively analyzed to categorize companies as pure play, category-focused, industry-focused, and diversified; it is quantitatively analyzed to categorize companies as dominant, leading, strong, tentative, and weak.

Recent Development and News in Sharing economy market

  • In January 2025, Uber announced a landmark partnership with General Motors to accelerate the transition to an all-electric fleet, involving a direct purchase of EVs for a flexible driver leasing program.
  • In February 2025, Airbnb revealed a new, deeply integrated loyalty program in collaboration with Star Alliance, allowing travelers to earn and redeem airline miles for stays at listed properties.
  • In March 2025, the California state legislature passed a comprehensive bill establishing a statewide framework for the operation of autonomous vehicle ride-sharing services, setting clear guidelines for deployment and safety.
  • In April 2025, the city of Sao Paulo, Brazil, launched an integrated public transit solution in partnership with a major ride-sharing company, enabling multimodal journey planning and payment within a single app.

Dive into Technavio’s robust research methodology, blending expert interviews, extensive data synthesis, and validated models for unparalleled Sharing Economy Market insights. See full methodology.

Market Scope
Page number 299
Base year 2025
Historic period 2020-2024
Forecast period 2026-2030
Growth momentum & CAGR Accelerate at a CAGR of 33.2%
Market growth 2026-2030 USD 1468.7 billion
Market structure Fragmented
YoY growth 2025-2026(%) 27.7%
Key countries China, India, Japan, South Korea, Australia, Indonesia, UK, Germany, France, Italy, Spain, The Netherlands, US, Canada, Mexico, Brazil, Argentina, Chile, UAE, Saudi Arabia, South Africa, Turkey and Israel
Competitive landscape Leading Companies, Market Positioning of Companies, Competitive Strategies, and Industry Risks

Request Free Sample

Research Analyst Overview

  • The sharing economy market has matured beyond its disruptive origins, now focusing on sustainable business models and operational efficiency. This evolution is evident across key segments, from on-demand transportation and shared accommodation platforms to the expansion of micromobility services.
  • The core of the market is the peer-to-peer exchange, enabled by on-demand service platforms that rely on a robust digital reputation system and two-way rating systems. Technologies like dynamic pricing algorithms and predictive analytics for demand are critical for asset utilization optimization.
  • The rise of B2B sharing models is transforming corporate operations, with companies adopting flexible workspace solutions and shared logistics capacity to create asset-light business models. The adoption of enterprise-grade solutions is a key boardroom-level discussion, as companies leveraging these platforms have reported a 20% improvement in supply chain flexibility. This expansion includes the expert economy and various skill-sharing platforms.
  • In finance, peer-to-peer lending platforms and equity crowdfunding are providing alternative capital sources. The technological frontier includes IoT-enabled asset tracking and the exploration of blockchain for trust through smart contract execution. Super-app ecosystems are driving hyperlocal delivery networks, creating a highly integrated user experience.
  • This pivot towards profitability and diversified services, including peer-to-peer car sharing and peer-to-peer storage, signals a new phase of strategic growth.

What are the Key Data Covered in this Sharing Economy Market Research and Growth Report?

  • What is the expected growth of the Sharing Economy Market between 2026 and 2030?

    • USD 1468.7 billion, at a CAGR of 33.2%

  • What segmentation does the market report cover?

    • The report is segmented by Type (Sharing accommodation, Sharing transport, Sharing finance, and Others), End-user (Individual, and Business), Age Group (Millennials, Generation X, Generation Z, and Boomers) and Geography (APAC, Europe, North America, South America, Middle East and Africa)

  • Which regions are analyzed in the report?

    • APAC, Europe, North America, South America and Middle East and Africa

  • What are the key growth drivers and market challenges?

    • Pervasive economic and financial incentives for both consumers and providers, Navigating fragmented and evolving regulatory landscape

  • Who are the major players in the Sharing Economy Market?

    • Airbnb Inc., Bolt Technology OU, Comuto SA, Couchsurfing International, DiDi Global Inc., GoShare Inc., Homestay.com Ltd., JustPark Parking Ltd., Luup Inc., Lyft Inc., Neighbor Storage Inc., Neutron Holdings Inc., Spotahome Ltd., Stashbee Ltd., Turo Inc., Uber Technologies Inc. and WeWork Inc.

Market Research Insights

  • The sharing economy market is evolving from consumer-facing services to sophisticated business-to-business applications, driven by the pursuit of corporate agility enhancement. Flexible workforce models, enabled by digital platforms, allow enterprises to reduce long-term staffing overhead by up to 30%.
  • The expansion into enterprise services necessitates features like centralized billing capabilities, which improve administrative efficiency by 40% compared to manual expense reporting. Service portfolio diversification is a key strategy for user retention, with platforms bundling multiple services to increase engagement.
  • The entire ecosystem is built on trust, which is maintained through robust user-generated reputation systems that underpin the viability of peer-to-peer interactions and transactions.

We can help! Our analysts can customize this sharing economy market research report to meet your requirements.

Get in touch

1. Executive Summary

1.1 Market overview

Executive Summary - Chart on Market Overview
Executive Summary - Data Table on Market Overview
Executive Summary - Chart on Global Market Characteristics
Executive Summary - Chart on Market by Geography
Executive Summary - Chart on Market Segmentation by Type
Executive Summary - Chart on Market Segmentation by End-user
Executive Summary - Chart on Market Segmentation by Age Group
Executive Summary - Chart on Incremental Growth
Executive Summary - Data Table on Incremental Growth
Executive Summary - Chart on Company Market Positioning

2. Technavio Analysis

2.1 Analysis of price sensitivity, lifecycle, customer purchase basket, adoption rates, and purchase criteria

2.2 Criticality of inputs and Factors of differentiation

Chart on Overview on criticality of inputs and factors of differentiation

2.3 Factors of disruption

Chart on Overview on factors of disruption

2.4 Impact of drivers and challenges

Chart on Impact of drivers and challenges in 2025 and 2030

3. Market Landscape

3.1 Market ecosystem

Chart on Parent Market
Data Table on - Parent Market

3.2 Market characteristics

Chart on Market characteristics analysis

3.3 Value chain analysis

Chart on Value chain analysis

4. Market Sizing

4.1 Market definition

Data Table on Offerings of companies included in the market definition

4.2 Market segment analysis

Market segments

4.3 Market size 2025

4.4 Market outlook: Forecast for 2025-2030

Chart on Global - Market size and forecast 2025-2030 ($ billion)
Data Table on Global - Market size and forecast 2025-2030 ($ billion)
Chart on Global Market: Year-over-year growth 2025-2030 (%)
Data Table on Global Market: Year-over-year growth 2025-2030 (%)

5. Historic Market Size

5.1 Global Sharing Economy Market 2020 - 2024

Historic Market Size - Data Table on Global Sharing Economy Market 2020 - 2024 ($ billion)

5.2 Type segment analysis 2020 - 2024

Historic Market Size - Type Segment 2020 - 2024 ($ billion)

5.3 End-user segment analysis 2020 - 2024

Historic Market Size - End-user Segment 2020 - 2024 ($ billion)

5.4 Age Group segment analysis 2020 - 2024

Historic Market Size - Age Group Segment 2020 - 2024 ($ billion)

5.5 Geography segment analysis 2020 - 2024

Historic Market Size - Geography Segment 2020 - 2024 ($ billion)

5.6 Country segment analysis 2020 - 2024

Historic Market Size - Country Segment 2020 - 2024 ($ billion)

6. Qualitative Analysis

6.1 The impact of AI on global sharing economy market

7. Five Forces Analysis

7.1 Five forces summary

Five forces analysis - Comparison between 2025 and 2030

7.2 Bargaining power of buyers

Bargaining power of buyers - Impact of key factors 2025 and 2030

7.3 Bargaining power of suppliers

Bargaining power of suppliers - Impact of key factors in 2025 and 2030

7.4 Threat of new entrants

Threat of new entrants - Impact of key factors in 2025 and 2030

7.5 Threat of substitutes

Threat of substitutes - Impact of key factors in 2025 and 2030

7.6 Threat of rivalry

Threat of rivalry - Impact of key factors in 2025 and 2030

7.7 Market condition

Chart on Market condition - Five forces 2025 and 2030

8. Market Segmentation by Type

8.1 Market segments

Chart on Type - Market share 2025-2030 (%)
Data Table on Type - Market share 2025-2030 (%)

8.2 Comparison by Type

Chart on Comparison by Type
Data Table on Comparison by Type

8.3 Sharing accommodation - Market size and forecast 2025-2030

Chart on Sharing accommodation - Market size and forecast 2025-2030 ($ billion)
Data Table on Sharing accommodation - Market size and forecast 2025-2030 ($ billion)
Chart on Sharing accommodation - Year-over-year growth 2025-2030 (%)
Data Table on Sharing accommodation - Year-over-year growth 2025-2030 (%)

8.4 Sharing transport - Market size and forecast 2025-2030

Chart on Sharing transport - Market size and forecast 2025-2030 ($ billion)
Data Table on Sharing transport - Market size and forecast 2025-2030 ($ billion)
Chart on Sharing transport - Year-over-year growth 2025-2030 (%)
Data Table on Sharing transport - Year-over-year growth 2025-2030 (%)

8.5 Sharing finance - Market size and forecast 2025-2030

Chart on Sharing finance - Market size and forecast 2025-2030 ($ billion)
Data Table on Sharing finance - Market size and forecast 2025-2030 ($ billion)
Chart on Sharing finance - Year-over-year growth 2025-2030 (%)
Data Table on Sharing finance - Year-over-year growth 2025-2030 (%)

8.6 Others - Market size and forecast 2025-2030

Chart on Others - Market size and forecast 2025-2030 ($ billion)
Data Table on Others - Market size and forecast 2025-2030 ($ billion)
Chart on Others - Year-over-year growth 2025-2030 (%)
Data Table on Others - Year-over-year growth 2025-2030 (%)

8.7 Market opportunity by Type

Market opportunity by Type ($ billion)
Data Table on Market opportunity by Type ($ billion)

9. Market Segmentation by End-user

9.1 Market segments

Chart on End-user - Market share 2025-2030 (%)
Data Table on End-user - Market share 2025-2030 (%)

9.2 Comparison by End-user

Chart on Comparison by End-user
Data Table on Comparison by End-user

9.3 Individual - Market size and forecast 2025-2030

Chart on Individual - Market size and forecast 2025-2030 ($ billion)
Data Table on Individual - Market size and forecast 2025-2030 ($ billion)
Chart on Individual - Year-over-year growth 2025-2030 (%)
Data Table on Individual - Year-over-year growth 2025-2030 (%)

9.4 Business - Market size and forecast 2025-2030

Chart on Business - Market size and forecast 2025-2030 ($ billion)
Data Table on Business - Market size and forecast 2025-2030 ($ billion)
Chart on Business - Year-over-year growth 2025-2030 (%)
Data Table on Business - Year-over-year growth 2025-2030 (%)

9.5 Market opportunity by End-user

Market opportunity by End-user ($ billion)
Data Table on Market opportunity by End-user ($ billion)

10. Market Segmentation by Age Group

10.1 Market segments

Chart on Age Group - Market share 2025-2030 (%)
Data Table on Age Group - Market share 2025-2030 (%)

10.2 Comparison by Age Group

Chart on Comparison by Age Group
Data Table on Comparison by Age Group

10.3 Millennials - Market size and forecast 2025-2030

Chart on Millennials - Market size and forecast 2025-2030 ($ billion)
Data Table on Millennials - Market size and forecast 2025-2030 ($ billion)
Chart on Millennials - Year-over-year growth 2025-2030 (%)
Data Table on Millennials - Year-over-year growth 2025-2030 (%)

10.4 Generation X - Market size and forecast 2025-2030

Chart on Generation X - Market size and forecast 2025-2030 ($ billion)
Data Table on Generation X - Market size and forecast 2025-2030 ($ billion)
Chart on Generation X - Year-over-year growth 2025-2030 (%)
Data Table on Generation X - Year-over-year growth 2025-2030 (%)

10.5 Generation Z - Market size and forecast 2025-2030

Chart on Generation Z - Market size and forecast 2025-2030 ($ billion)
Data Table on Generation Z - Market size and forecast 2025-2030 ($ billion)
Chart on Generation Z - Year-over-year growth 2025-2030 (%)
Data Table on Generation Z - Year-over-year growth 2025-2030 (%)

10.6 Boomers - Market size and forecast 2025-2030

Chart on Boomers - Market size and forecast 2025-2030 ($ billion)
Data Table on Boomers - Market size and forecast 2025-2030 ($ billion)
Chart on Boomers - Year-over-year growth 2025-2030 (%)
Data Table on Boomers - Year-over-year growth 2025-2030 (%)

10.7 Market opportunity by Age Group

Market opportunity by Age Group ($ billion)
Data Table on Market opportunity by Age Group ($ billion)

11. Customer Landscape

11.1 Customer landscape overview

Analysis of price sensitivity, lifecycle, customer purchase basket, adoption rates, and purchase criteria

12. Geographic Landscape

12.1 Geographic segmentation

Chart on Market share by geography 2025-2030 (%)
Data Table on Market share by geography 2025-2030 (%)

12.2 Geographic comparison

Chart on Geographic comparison
Data Table on Geographic comparison

12.3 APAC - Market size and forecast 2025-2030

Chart on APAC - Market size and forecast 2025-2030 ($ billion)
Data Table on APAC - Market size and forecast 2025-2030 ($ billion)
Chart on APAC - Year-over-year growth 2025-2030 (%)
Data Table on APAC - Year-over-year growth 2025-2030 (%)
Chart on Regional Comparison - APAC
Data Table on Regional Comparison - APAC

12.3.1 China - Market size and forecast 2025-2030

Chart on China - Market size and forecast 2025-2030 ($ billion)
Data Table on China - Market size and forecast 2025-2030 ($ billion)
Chart on China - Year-over-year growth 2025-2030 (%)
Data Table on China - Year-over-year growth 2025-2030 (%)

12.3.2 India - Market size and forecast 2025-2030

Chart on India - Market size and forecast 2025-2030 ($ billion)
Data Table on India - Market size and forecast 2025-2030 ($ billion)
Chart on India - Year-over-year growth 2025-2030 (%)
Data Table on India - Year-over-year growth 2025-2030 (%)

12.3.3 Japan - Market size and forecast 2025-2030

Chart on Japan - Market size and forecast 2025-2030 ($ billion)
Data Table on Japan - Market size and forecast 2025-2030 ($ billion)
Chart on Japan - Year-over-year growth 2025-2030 (%)
Data Table on Japan - Year-over-year growth 2025-2030 (%)

12.3.4 South Korea - Market size and forecast 2025-2030

Chart on South Korea - Market size and forecast 2025-2030 ($ billion)
Data Table on South Korea - Market size and forecast 2025-2030 ($ billion)
Chart on South Korea - Year-over-year growth 2025-2030 (%)
Data Table on South Korea - Year-over-year growth 2025-2030 (%)

12.3.5 Australia - Market size and forecast 2025-2030

Chart on Australia - Market size and forecast 2025-2030 ($ billion)
Data Table on Australia - Market size and forecast 2025-2030 ($ billion)
Chart on Australia - Year-over-year growth 2025-2030 (%)
Data Table on Australia - Year-over-year growth 2025-2030 (%)

12.3.6 Indonesia - Market size and forecast 2025-2030

Chart on Indonesia - Market size and forecast 2025-2030 ($ billion)
Data Table on Indonesia - Market size and forecast 2025-2030 ($ billion)
Chart on Indonesia - Year-over-year growth 2025-2030 (%)
Data Table on Indonesia - Year-over-year growth 2025-2030 (%)

12.4 Europe - Market size and forecast 2025-2030

Chart on Europe - Market size and forecast 2025-2030 ($ billion)
Data Table on Europe - Market size and forecast 2025-2030 ($ billion)
Chart on Europe - Year-over-year growth 2025-2030 (%)
Data Table on Europe - Year-over-year growth 2025-2030 (%)
Chart on Regional Comparison - Europe
Data Table on Regional Comparison - Europe

12.4.1 UK - Market size and forecast 2025-2030

Chart on UK - Market size and forecast 2025-2030 ($ billion)
Data Table on UK - Market size and forecast 2025-2030 ($ billion)
Chart on UK - Year-over-year growth 2025-2030 (%)
Data Table on UK - Year-over-year growth 2025-2030 (%)

12.4.2 Germany - Market size and forecast 2025-2030

Chart on Germany - Market size and forecast 2025-2030 ($ billion)
Data Table on Germany - Market size and forecast 2025-2030 ($ billion)
Chart on Germany - Year-over-year growth 2025-2030 (%)
Data Table on Germany - Year-over-year growth 2025-2030 (%)

12.4.3 France - Market size and forecast 2025-2030

Chart on France - Market size and forecast 2025-2030 ($ billion)
Data Table on France - Market size and forecast 2025-2030 ($ billion)
Chart on France - Year-over-year growth 2025-2030 (%)
Data Table on France - Year-over-year growth 2025-2030 (%)

12.4.4 Italy - Market size and forecast 2025-2030

Chart on Italy - Market size and forecast 2025-2030 ($ billion)
Data Table on Italy - Market size and forecast 2025-2030 ($ billion)
Chart on Italy - Year-over-year growth 2025-2030 (%)
Data Table on Italy - Year-over-year growth 2025-2030 (%)

12.4.5 Spain - Market size and forecast 2025-2030

Chart on Spain - Market size and forecast 2025-2030 ($ billion)
Data Table on Spain - Market size and forecast 2025-2030 ($ billion)
Chart on Spain - Year-over-year growth 2025-2030 (%)
Data Table on Spain - Year-over-year growth 2025-2030 (%)

12.4.6 The Netherlands - Market size and forecast 2025-2030

Chart on The Netherlands - Market size and forecast 2025-2030 ($ billion)
Data Table on The Netherlands - Market size and forecast 2025-2030 ($ billion)
Chart on The Netherlands - Year-over-year growth 2025-2030 (%)
Data Table on The Netherlands - Year-over-year growth 2025-2030 (%)

12.5 North America - Market size and forecast 2025-2030

Chart on North America - Market size and forecast 2025-2030 ($ billion)
Data Table on North America - Market size and forecast 2025-2030 ($ billion)
Chart on North America - Year-over-year growth 2025-2030 (%)
Data Table on North America - Year-over-year growth 2025-2030 (%)
Chart on Regional Comparison - North America
Data Table on Regional Comparison - North America

12.5.1 US - Market size and forecast 2025-2030

Chart on US - Market size and forecast 2025-2030 ($ billion)
Data Table on US - Market size and forecast 2025-2030 ($ billion)
Chart on US - Year-over-year growth 2025-2030 (%)
Data Table on US - Year-over-year growth 2025-2030 (%)

12.5.2 Canada - Market size and forecast 2025-2030

Chart on Canada - Market size and forecast 2025-2030 ($ billion)
Data Table on Canada - Market size and forecast 2025-2030 ($ billion)
Chart on Canada - Year-over-year growth 2025-2030 (%)
Data Table on Canada - Year-over-year growth 2025-2030 (%)

12.5.3 Mexico - Market size and forecast 2025-2030

Chart on Mexico - Market size and forecast 2025-2030 ($ billion)
Data Table on Mexico - Market size and forecast 2025-2030 ($ billion)
Chart on Mexico - Year-over-year growth 2025-2030 (%)
Data Table on Mexico - Year-over-year growth 2025-2030 (%)

12.6 South America - Market size and forecast 2025-2030

Chart on South America - Market size and forecast 2025-2030 ($ billion)
Data Table on South America - Market size and forecast 2025-2030 ($ billion)
Chart on South America - Year-over-year growth 2025-2030 (%)
Data Table on South America - Year-over-year growth 2025-2030 (%)
Chart on Regional Comparison - South America
Data Table on Regional Comparison - South America

12.6.1 Brazil - Market size and forecast 2025-2030

Chart on Brazil - Market size and forecast 2025-2030 ($ billion)
Data Table on Brazil - Market size and forecast 2025-2030 ($ billion)
Chart on Brazil - Year-over-year growth 2025-2030 (%)
Data Table on Brazil - Year-over-year growth 2025-2030 (%)

12.6.2 Argentina - Market size and forecast 2025-2030

Chart on Argentina - Market size and forecast 2025-2030 ($ billion)
Data Table on Argentina - Market size and forecast 2025-2030 ($ billion)
Chart on Argentina - Year-over-year growth 2025-2030 (%)
Data Table on Argentina - Year-over-year growth 2025-2030 (%)

12.6.3 Chile - Market size and forecast 2025-2030

Chart on Chile - Market size and forecast 2025-2030 ($ billion)
Data Table on Chile - Market size and forecast 2025-2030 ($ billion)
Chart on Chile - Year-over-year growth 2025-2030 (%)
Data Table on Chile - Year-over-year growth 2025-2030 (%)

12.7 Middle East and Africa - Market size and forecast 2025-2030

Chart on Middle East and Africa - Market size and forecast 2025-2030 ($ billion)
Data Table on Middle East and Africa - Market size and forecast 2025-2030 ($ billion)
Chart on Middle East and Africa - Year-over-year growth 2025-2030 (%)
Data Table on Middle East and Africa - Year-over-year growth 2025-2030 (%)
Chart on Regional Comparison - Middle East and Africa
Data Table on Regional Comparison - Middle East and Africa

12.7.1 UAE - Market size and forecast 2025-2030

Chart on UAE - Market size and forecast 2025-2030 ($ billion)
Data Table on UAE - Market size and forecast 2025-2030 ($ billion)
Chart on UAE - Year-over-year growth 2025-2030 (%)
Data Table on UAE - Year-over-year growth 2025-2030 (%)

12.7.2 Saudi Arabia - Market size and forecast 2025-2030

Chart on Saudi Arabia - Market size and forecast 2025-2030 ($ billion)
Data Table on Saudi Arabia - Market size and forecast 2025-2030 ($ billion)
Chart on Saudi Arabia - Year-over-year growth 2025-2030 (%)
Data Table on Saudi Arabia - Year-over-year growth 2025-2030 (%)

12.7.3 South Africa - Market size and forecast 2025-2030

Chart on South Africa - Market size and forecast 2025-2030 ($ billion)
Data Table on South Africa - Market size and forecast 2025-2030 ($ billion)
Chart on South Africa - Year-over-year growth 2025-2030 (%)
Data Table on South Africa - Year-over-year growth 2025-2030 (%)

12.7.4 Turkey - Market size and forecast 2025-2030

Chart on Turkey - Market size and forecast 2025-2030 ($ billion)
Data Table on Turkey - Market size and forecast 2025-2030 ($ billion)
Chart on Turkey - Year-over-year growth 2025-2030 (%)
Data Table on Turkey - Year-over-year growth 2025-2030 (%)

12.7.5 Israel - Market size and forecast 2025-2030

Chart on Israel - Market size and forecast 2025-2030 ($ billion)
Data Table on Israel - Market size and forecast 2025-2030 ($ billion)
Chart on Israel - Year-over-year growth 2025-2030 (%)
Data Table on Israel - Year-over-year growth 2025-2030 (%)

12.8 Market opportunity by geography

Market opportunity by geography ($ billion)
Data Tables on Market opportunity by geography ($ billion)

13. Drivers, Challenges, and Opportunity

13.1 Market drivers

Pervasive economic and financial incentives for both consumers and providers
Proliferation of digital technologies and ubiquitous connectivity
Fundamental shifts in societal values and consumer behavior

13.2 Market challenges

Navigating fragmented and evolving regulatory landscape
Establishing and sustaining trust and safety at scale
Achieving sustainable profitability amid intense market competition

13.3 Impact of drivers and challenges

Impact of drivers and challenges in 2025 and 2030

13.4 Market opportunities

Strategic consolidation and service portfolio diversification
Deep integration of artificial intelligence, IoT, and blockchain technologies
Proliferation of B2B and enterprise-focused sharing models

14. Competitive Landscape

14.1 Overview

14.2

Overview on criticality of inputs and factors of differentiation

14.3 Landscape disruption

Overview on factors of disruption

14.4 Industry risks

Impact of key risks on business

15. Competitive Analysis

15.1 Companies profiled

Companies covered

15.2 Company ranking index

15.3 Market positioning of companies

Matrix on companies position and classification

15.4 Airbnb Inc.

Airbnb Inc. - Overview
Airbnb Inc. - Product / Service
Airbnb Inc. - Key offerings
SWOT

15.5 Bolt Technology OU

Bolt Technology OU - Overview
Bolt Technology OU - Product / Service
Bolt Technology OU - Key offerings
SWOT

15.6 Comuto SA

Comuto SA - Overview
Comuto SA - Product / Service
Comuto SA - Key offerings
SWOT

15.7 Couchsurfing International

Couchsurfing International - Overview
Couchsurfing International - Product / Service
Couchsurfing International - Key offerings
SWOT

15.8 DiDi Global Inc.

DiDi Global Inc. - Overview
DiDi Global Inc. - Business segments
DiDi Global Inc. - Key offerings
DiDi Global Inc. - Segment focus
SWOT

15.9 Homestay.com Ltd.

Homestay.com Ltd. - Overview
Homestay.com Ltd. - Product / Service
Homestay.com Ltd. - Key offerings
SWOT

15.10 JustPark Parking Ltd.

JustPark Parking Ltd. - Overview
JustPark Parking Ltd. - Product / Service
JustPark Parking Ltd. - Key offerings
SWOT

15.11 Luup Inc.

Luup Inc. - Overview
Luup Inc. - Product / Service
Luup Inc. - Key offerings
SWOT

15.12 Lyft Inc.

Lyft Inc. - Overview
Lyft Inc. - Product / Service
Lyft Inc. - Key offerings
SWOT

15.13 Neutron Holdings Inc.

Neutron Holdings Inc. - Overview
Neutron Holdings Inc. - Product / Service
Neutron Holdings Inc. - Key offerings
SWOT

15.14 Spotahome Ltd.

Spotahome Ltd. - Overview
Spotahome Ltd. - Product / Service
Spotahome Ltd. - Key offerings
SWOT

15.15 Stashbee Ltd.

Stashbee Ltd. - Overview
Stashbee Ltd. - Product / Service
Stashbee Ltd. - Key offerings
SWOT

15.16 Turo Inc.

Turo Inc. - Overview
Turo Inc. - Product / Service
Turo Inc. - Key offerings
SWOT

15.17 Uber Technologies Inc.

Uber Technologies Inc. - Overview
Uber Technologies Inc. - Business segments
Uber Technologies Inc. - Key offerings
Uber Technologies Inc. - Segment focus
SWOT

15.18 WeWork Inc.

WeWork Inc. - Overview
WeWork Inc. - Product / Service
WeWork Inc. - Key offerings
SWOT

16. Appendix

16.1 Scope of the report

Market definition
Objectives
Notes and caveats

16.2 Inclusions and exclusions checklist

Inclusions checklist
Exclusions checklist

16.3 Currency conversion rates for US$

16.4 Research methodology

16.5 Data procurement

Information sources

16.6 Data validation

16.7 Validation techniques employed for market sizing

16.8 Data synthesis

16.9 360 degree market analysis

16.10 List of abbreviations

Research Methodology

Technavio presents a detailed picture of the market by way of study, synthesis, and summation of data from multiple sources. The analysts have presented the various facets of the market with a particular focus on identifying the key industry influencers. The data thus presented is comprehensive, reliable, and the result of extensive research, both primary and secondary.

INFORMATION SOURCES

Primary sources

  • Manufacturers and suppliers
  • Channel partners
  • Industry experts
  • Strategic decision makers

Secondary sources

  • Industry journals and periodicals
  • Government data
  • Financial reports of key industry players
  • Historical data
  • Press releases

DATA ANALYSIS

Data Synthesis

  • Collation of data
  • Estimation of key figures
  • Analysis of derived insights

Data Validation

  • Triangulation with data models
  • Reference against proprietary databases
  • Corroboration with industry experts

REPORT WRITING

Qualitative

  • Market drivers
  • Market challenges
  • Market trends
  • Five forces analysis

Quantitative

  • Market size and forecast
  • Market segmentation
  • Geographical insights
  • Competitive landscape

Interested in this report?

Get your sample now to see our research methodology and insights!

Download Now

Frequently Asked Questions

Sharing Economy market growth will increase by USD 1468.7 billion during 2026-2030.

The Sharing Economy market is expected to grow at a CAGR of 33.2% during 2026-2030.

Sharing Economy market is segmented by Type (Sharing accommodation, Sharing transport, Sharing finance, Others) End-user (Individual, Business) Age group (Millennials, Generation X, Generation Z, Boomers)

Airbnb Inc., Bolt Technology OU, Comuto SA, Couchsurfing International, DiDi Global Inc., GoShare Inc., Homestay.com Ltd., JustPark Parking Ltd., Luup Inc., Lyft Inc., Neighbor Storage Inc., Neutron Holdings Inc., Spotahome Ltd., Stashbee Ltd., Turo Inc., Uber Technologies Inc., WeWork Inc. are a few of the key vendors in the Sharing Economy market.

APAC will register the highest growth rate of 33% among the other regions. Therefore, the Sharing Economy market in APAC is expected to garner significant business opportunities for the vendors during the forecast period.

China, India, Japan, South Korea, Australia, Indonesia, UK, Germany, France, Italy, Spain, The Netherlands, US, Canada, Mexico, Brazil, Argentina, Chile, UAE, Saudi Arabia, South Africa, Turkey, Israel

  • Pervasive economic and financial incentives for both consumers and providers is the driving factor this market.

The Sharing Economy market vendors should focus on grabbing business opportunities from the Type segment as it accounted for the largest market share in the base year.