
Singapore Urea Market Size 2025-2029
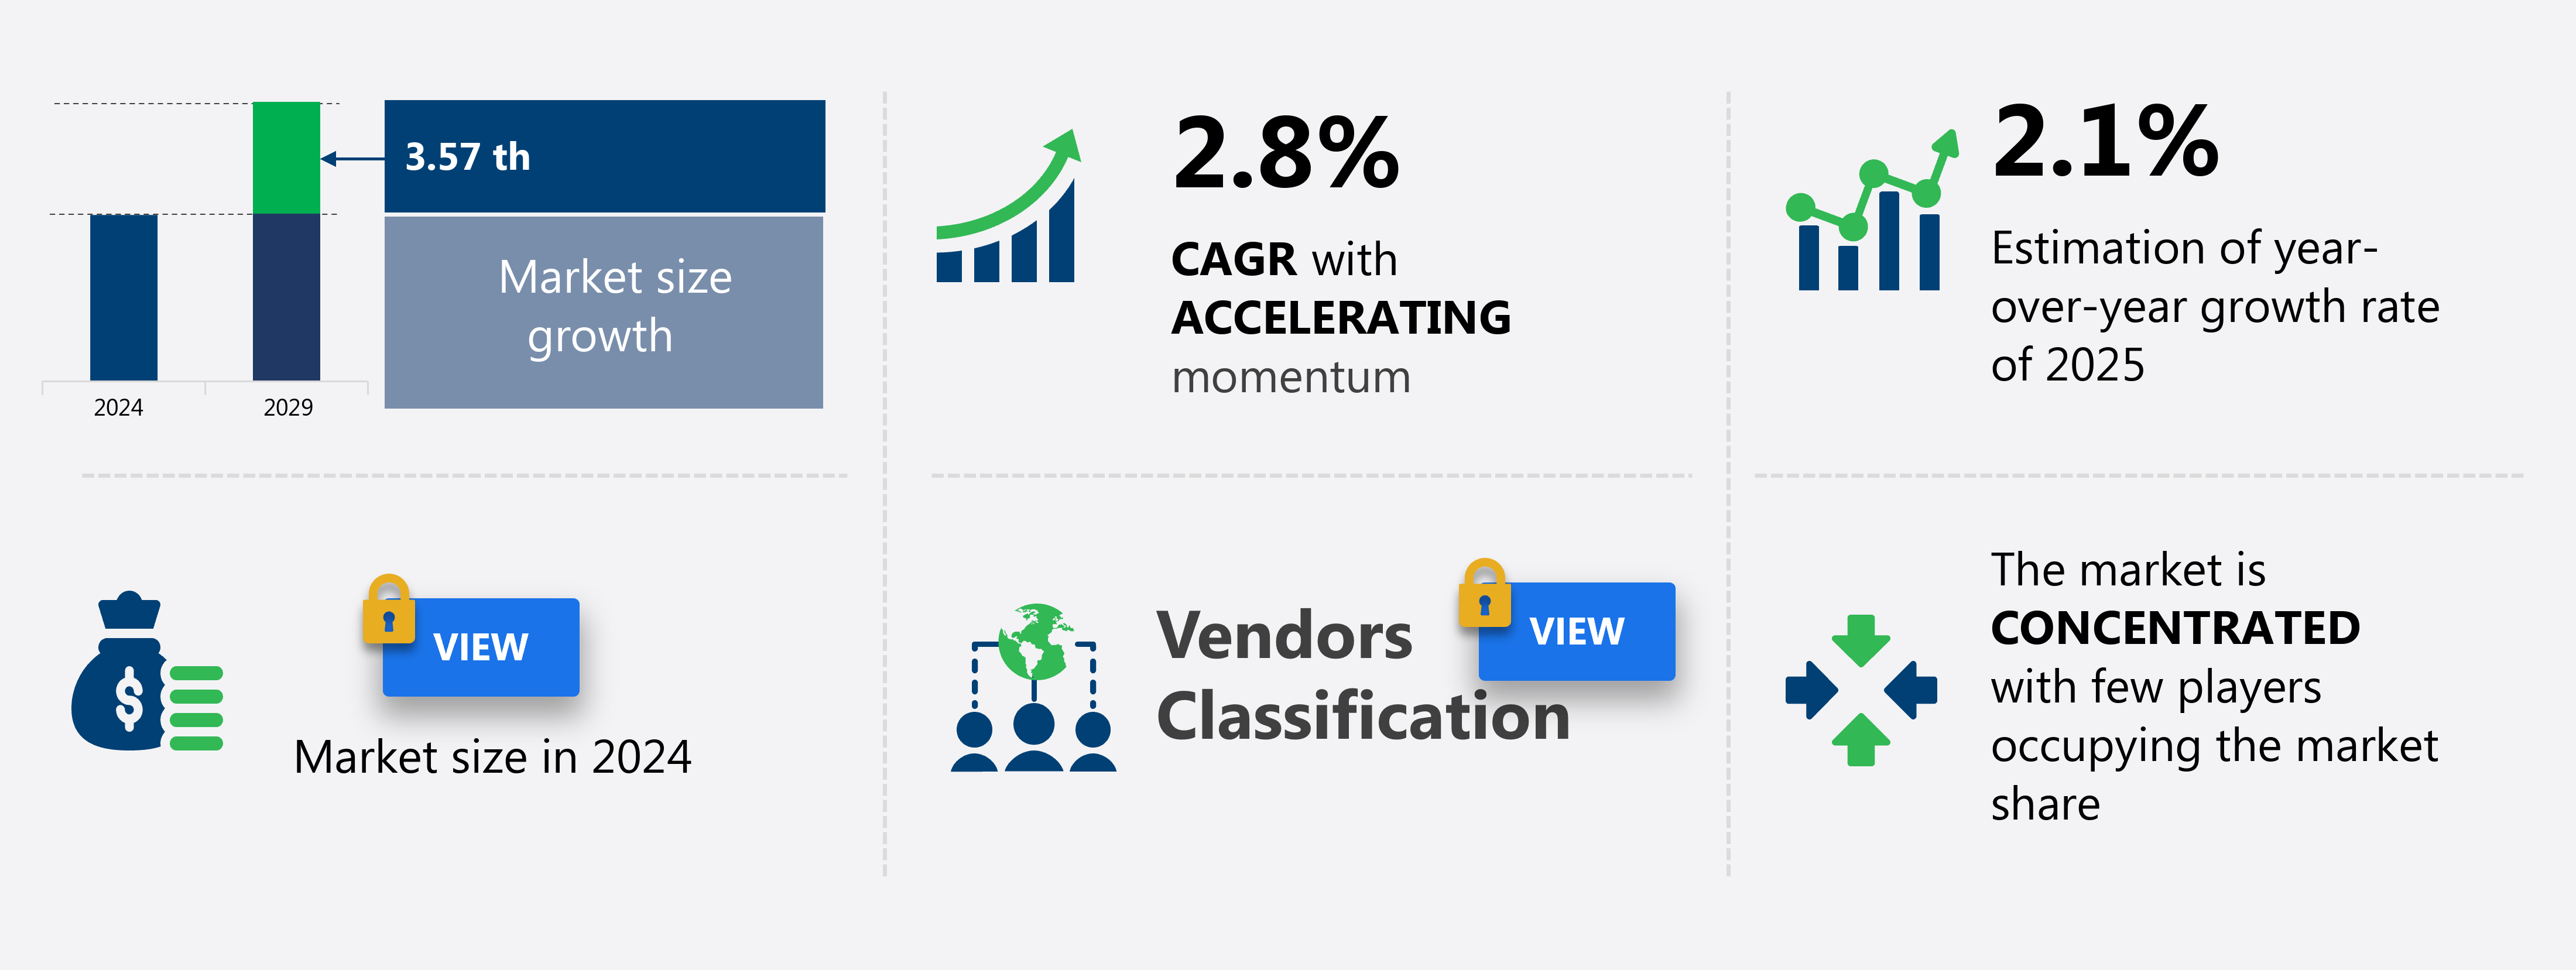
The urea market in Singapore size is forecast to increase by 3.57 thousand at a CAGR of 2.8% between 2024 and 2029.
- The market is experiencing significant growth, driven by the expansion of regional trade and export activities. This trend is fueled by the increasing demand for urea, particularly in the agricultural sector, where it serves as a crucial nitrogen source for enhancing crop productivity. Additionally, the emergence of nano urea, a more efficient and environmentally-friendly form of urea, is gaining traction in the market. However, price volatility poses a challenge to market growth, as fluctuations in the cost of raw materials and logistics can impact the profitability of urea producers and distributors.
- To stay competitive, market players must closely monitor these trends and adapt to the evolving market landscape. By exploring deeper insights into the Urea market's dynamics, businesses can gain a strategic advantage and capitalize on opportunities for growth.
What will be the Size of the Market During the Forecast Period?
- The Singapore urea market is characterized by the intersection of waste management, renewable energy, and plant science. Coal-based urea production, a significant contributor to the market, faces increasing pressure from emissions mitigation efforts. Crop nutrient requirements drive demand for urea-ammonium nitrate and organic fertilizers, with farmer education crucial for optimal nutrient uptake. Renewable energy sources, such as natural gas, reduce the carbon footprint of ammonia production. Integrated nutrient management, including nitrogen fixation and plant growth regulators, is gaining traction in the circular economy. Urea hydrolysis and ammonium bicarbonate offer alternatives to synthetic fertilizers, while wholesale distribution and retail channels ensure wide availability.
- Water quality concerns and nitrogen use efficiency are key challenges, as are energy consumption and greenhouse gas emissions. Agricultural research focuses on improving soil health and reducing fertilizer application rates. The market dynamics of the Singapore urea market are shaped by these trends and challenges, making it an intriguing space for business readers.
How is this market segmented and which is the largest segment?
The market research report provides comprehensive data (region-wise segment analysis), with forecasts and estimates in "USD thousand" for the period 2025-2029, as well as historical data from 2019-2023 for the following segments.
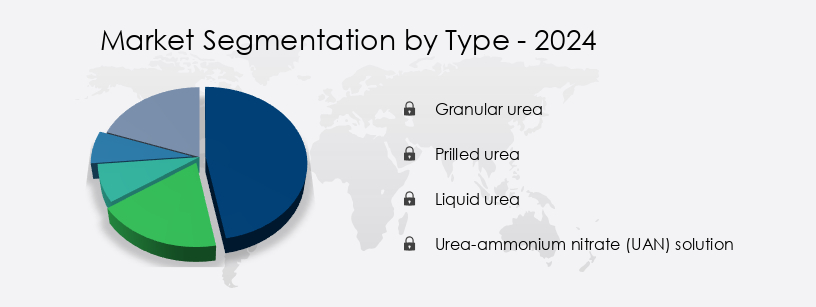
- Type
- Granular urea
- Prilled urea
- Liquid urea
- Urea-ammonium nitrate (UAN) solution
- End-user
- Agriculture
- Chemicals and manufacturing
- Automotive
- Pharmaceuticals
- Distribution Channel
- Bulk Suppliers
- Retail
- Online Platforms
- Geography
- APAC
- Singapore
- APAC
By Type Insights
- The granular urea segment is estimated to witness significant growth during the forecast period.
In the agricultural sector of Singapore, urea, a vital component of fertilizers, plays a significant role in enhancing crop productivity for cash crops such as food and rubber. The market is characterized by a complex supply chain, involving production, synthesis, and distribution. Urea is primarily produced through the ammonia synthesis process, which involves the conversion of nitrogen from the air into ammonia and subsequent reaction with carbon dioxide to form urea. Urea fertilizer is a crucial input for precision farming, a modern agricultural approach that employs digital technology, remote sensing, and soil analysis to optimize nutrient management and reduce emissions.
Urea's nitrogen content, which stands at 46%, makes it an essential nutrient for various food crops and palm oil plantations. Urea's versatility is evident in its application methods, including broadcast application, granular application, and controlled-release urea for sustainable agriculture. Price fluctuations, economic factors, and trade agreements influence the urea market's dynamics. Urea imports and exports contribute to the market's volatility, with Singapore being a significant importer of urea due to its limited production capacity. Government policies and environmental regulations also impact the market, with a focus on energy efficiency, emissions reduction, and sustainability initiatives. Urea manufacturing companies prioritize these factors to meet the evolving demands of the agricultural sector and maintain a competitive edge.
Data analytics and yield forecasting are integral to optimizing crop productivity and managing demand and supply effectively. Urea plants employ advanced technologies such as digital agriculture and smart farming to improve yield and reduce waste. The distribution network plays a crucial role in ensuring the timely delivery of urea to farmers, with storage facilities strategically located to cater to the varying demands across the island. In conclusion, the market is a dynamic and evolving ecosystem, driven by the agricultural sector's demands for high-quality fertilizers and the need for sustainable and efficient farming practices. Urea's versatility and essential nutrient properties make it an indispensable input for various cash crops and plantations, with ongoing research and innovation aimed at enhancing its effectiveness and reducing its environmental footprint.
Get a glance at the market report of share of various segments Request Free Sample
Market Dynamics
Our Singapore Urea Market researchers analyzed the data with 2024 as the base year, along with the key drivers, trends, and challenges. A holistic analysis of drivers will help companies refine their marketing strategies to gain a competitive advantage.
What are the key market drivers leading to the rise in adoption of Singapore Urea Market?
- Expansion of regional trade and export activities is the key driver of the market. The market plays a pivotal role in the Asia Pacific region due to the country's advanced logistical infrastructure and strategic location. The demand for urea in neighboring Southeast Asian countries, such as Indonesia, Malaysia, and Thailand, is on the rise, driven by agricultural expansion and government subsidies for fertilizers. These countries are focusing on yield optimization, emissions reduction, nutrient management, and smart farming, which necessitates the use of urea in ammonia synthesis for food crops and rubber plantations. Singapore's well-established port facilities and efficient transportation networks enable the smooth and timely export of urea to these markets.
- Furthermore, the increasing emphasis on controlled-release urea technology and urea manufacturing for various industries underscores the importance of Singapore as a key player in the global urea market. Data analytics is also a critical factor in the urea industry, as it helps optimize production, improve efficiency, and enhance the overall value chain.
What are the market trends shaping the Singapore Urea Market?
- Rising demand for nano urea is the upcoming trend in the market. The market experiences market volatility due to various factors, including government policies and environmental regulations. However, the demand for urea solutions, particularly nano urea, is growing due to its sustainability initiatives and precision application in agriculture. Nano urea's smaller particle size and higher surface area offer enhanced reactivity and solubility, making it an effective and efficient alternative to traditional urea forms. This results in reduced urea imports and a more sustainable agricultural industry. Moreover, nano urea's nitrogen fertilizer content is more easily absorbed by plants, leading to better crop yields and overall agricultural productivity.
-
Environmental regulations, such as those limiting carbon dioxide emissions, are driving the adoption of urea solutions that offer improved sustainability. The distribution network for urea solutions is expanding, ensuring easy access for farmers and promoting the growth of the market.
What challenges doesSingapore Urea Market face during the growth?
- Price volatility is a key challenge affecting the market growth.The market faces price volatility due to fluctuations in raw material costs, particularly natural gas, and global supply-demand dynamics. Natural gas is a significant input in urea production, and any changes in its price can directly impact urea costs. In 2023, global urea prices were influenced by robust demand in key markets and rising natural gas prices, reaching approximately USD650 per metric ton in January. Geopolitical tensions and export restrictions from major producers further contribute to price instability. To mitigate price risks, market participants in Singapore employ various strategies, such as energy efficiency, yield forecasting, and crop productivity improvements.
-
Urea blending, slow-release urea, and granular urea are popular options to enhance crop productivity and reduce application frequency. Digital agriculture technologies, including crop monitoring and broadcast application, also help optimize fertilizer usage and improve overall farm efficiency. Despite these efforts, the market remains subject to external factors, necessitating continuous market analysis and strategic planning.
Exclusive Customer Landscape
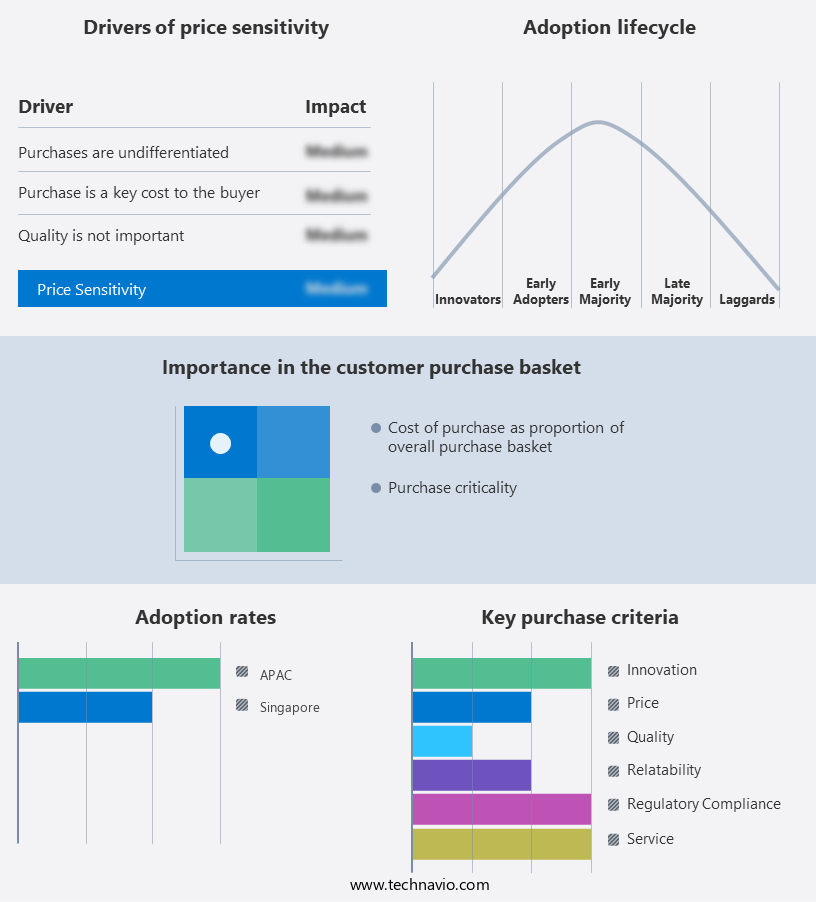
The market forecasting report includes the adoption lifecycle of the market, covering from the innovator's stage to the laggard's stage. It focuses on adoption rates in different regions based on penetration. Furthermore, the market report also includes key purchase criteria and drivers of price sensitivity to help companies evaluate and develop their market growth analysis strategies.
Customer Landscape
Key Companies & Market Insights
Companies are implementing various strategies, such as strategic alliances, market forecast , partnerships, mergers and acquisitions, geographical expansion, and product/service launches, to enhance their presence in the market.
The market research and growth report includes detailed analyses of the competitive landscape of the market and information about key companies, including:
- Yara International
- Nutrien
- OCI Nitrogen
- QAFCO
- SABIC
- Pupuk Indonesia
- Mitsui Chemicals
- EuroChem
- CF Industries
- Koch Fertilizer
- Agrium
- Deepak Fertilisers
- BASF
- Sumitomo Chemical
- Indian Farmers Fertiliser
- TogliattiAzot
- Acron Group
- PhosAgro
- ChemChina
- Sinochem
Qualitative and quantitative analysis of companies has been conducted to help clients understand the wider business environment as well as the strengths and weaknesses of key market players. Data is qualitatively analyzed to categorize companies as pure play, category-focused, industry-focused, and diversified; it is quantitatively analyzed to categorize companies as dominant, leading, strong, tentative, and weak.
Recent Development and News in Urea Market In Singapore
- In February 2023, Yara International, a leading global fertilizer company, announced the expansion of its production capacity for urea at its Singapore plant. The expansion, valued at approximately SGD 250 million (around USD 180 million), aims to increase the plant's annual production by 500,000 metric tons, making it one of the largest urea production sites in the Asia Pacific region (Yara International Press Release, 2023).
- In May 2024, Sinopec Corporation, China's largest oil and gas company, entered into a strategic partnership with Singapore's largest water treatment company, Hyflux, to jointly produce and market urea and ammonia. This collaboration is expected to strengthen both companies' positions in the global fertilizer market and contribute to Singapore's position as a key hub for the production and trading of these essential agro-chemicals (Sinopec Corporation Press Release, 2024).
- In August 2024, the Singaporean government launched the Green Plan 2030, a national sustainability initiative, which includes a focus on increasing local production of essential agro-chemicals like urea. This initiative is expected to create new opportunities for domestic and international companies in the urea market, as the city-state aims to reduce its reliance on imports and promote sustainable agriculture (Singapore Government Press Release, 2024).
Research Analyst Overview
The market is characterized by its continuous evolution and dynamic nature, driven by various economic factors and applications across the agricultural sector. Urea, a critical component of ammonia synthesis, is widely used as a fertilizer to enhance crop productivity in food crops and cash crops, including rubber plantations and palm oil plantations. The urea supply chain in Singapore is influenced by price fluctuations, trade agreements, and economic factors, with data analytics playing a crucial role in demand and supply forecasting and yield optimization. In the realm of precision farming, urea is applied through various methods such as broadcast application, granular urea, and controlled-release urea, with the latter gaining popularity due to its energy efficiency and emissions reduction benefits.
Urea manufacturing in Singapore is a significant industry, with urea plants producing prilled urea and urea solution for both local and export markets. The agricultural sector's shift towards sustainable agriculture and digital agriculture initiatives is driving the adoption of smart farming practices, including soil analysis, crop monitoring, and fertilizer blending. The use of slow-release urea and nitrogen content optimization is essential for nutrient management and yield forecasting, while carbon dioxide emissions reduction is a priority for environmental regulations. The urea market's volatility is influenced by market demand, supply, and government policies. Urea imports and exports play a significant role in the market's dynamics, with Singapore's strategic location making it a critical player in the global urea trade.
The ongoing unfolding of these market activities and evolving patterns underscores the importance of staying informed and adaptive in the urea market landscape.
|
Market Scope |
|
|
Report Coverage |
Details |
|
Page number |
143 |
|
Base year |
2024 |
|
Historic period |
2019-2023 |
|
Forecast period |
2025-2029 |
|
Growth momentum & CAGR |
Accelerate at a CAGR of 2.8% |
|
Market growth 2025-2029 |
USD 3.57 thousand |
|
Market structure |
Concentrated |
|
YoY growth 2024-2025(%) |
2.1 |
|
Key countries |
Singapore |
|
Competitive landscape |
Leading Companies, Market Positioning of Companies, Competitive Strategies, and Industry Risks |
What are the Key Data Covered in this Market Research and Growth Report?
- CAGR of the market during the forecast period
- Detailed information on factors that will drive the market growth and forecasting between 2025 and 2029
- Precise estimation of the size of the market and its contribution of the market in focus to the parent market
- Accurate predictions about upcoming market growth and trends and changes in consumer behaviour
- Growth of the market across Singapore
- Thorough analysis of the market's competitive landscape and detailed information about companies
- Comprehensive analysis of factors that will challenge the growth of market companies
We can help! Our analysts can customize this market research report to meet your requirements. Get in touch
 RIA -
RIA - 
