
Specialty Fats And Oils Market Size 2024-2028
The specialty fats and oils market size is forecast to increase by USD 5.2 billion, at a CAGR of 5.7% between 2023 and 2028.
- The market is experiencing significant growth, driven by the expanding food processing industry and the increasing demand for natural cosmetic products. The food processing sector's escalation is fueled by the global population's rising preference for convenience foods and ready-to-eat items, leading to an increased demand for specialty fats and oils. Moreover, the cosmetics industry's shift towards natural and organic products has resulted in a surge in demand for these ingredients. However, market participants face challenges as well. The volatile nature of oil crop prices poses a significant threat to market stability. Fluctuations in the prices of raw materials can lead to increased production costs, affecting the profitability of companies in the market.
- To mitigate these challenges, market players must focus on implementing cost-effective production methods and exploring alternative sources for raw materials. By staying agile and responsive to market trends, companies can capitalize on the opportunities presented by the growing demand for specialty fats and oils.
What will be the Size of the Specialty Fats And Oils Market during the forecast period?

Explore in-depth regional segment analysis with market size data - historical 2018-2022 and forecasts 2024-2028 - in the full report.
Request Free Sample
The market continues to evolve, driven by the diverse applications across various sectors. Emulsion stability and saponification value are crucial factors in industrial oil applications, ensuring the effective production of various products. In the realm of cosmetics, formulators prioritize oil quality control, with lipid oxidation and oxidative stability playing significant roles in maintaining product efficacy and shelf life. Fractionated palm oil, a key player in the market, undergoes rigorous processes such as crystallization behavior analysis and melting point determination to optimize its properties for specific applications. Similarly, the hydrolysis process and polymorphism analysis are essential in the production of interesterified shea butter, which exhibits unique rheological properties.
Canola oil refining and the hydrogenation of cottonseed oil contribute to the market's dynamism, with nutritional labeling and food safety regulations shaping their usage. Edible oil processing encompasses various techniques, including triglyceride profile analysis and peroxide value determination, to ensure the highest quality standards. The ongoing unfolding of market activities also includes the exploration of new applications for specialty oils. For instance, iodine value and saponification value assessments are crucial in the production of specialty oil blends for industrial use. The study of coconut oil fractionation and its impact on oxidative stability further expands the market's scope. The continuous evolution of the market is characterized by the integration of advanced technologies and innovative techniques to address the ever-changing demands of various industries.
This ongoing process ensures the market's continued growth and relevance in the global business landscape.
How is this Specialty Fats And Oils Industry segmented?
The specialty fats and oils industry research report provides comprehensive data (region-wise segment analysis), with forecasts and estimates in "USD billion" for the period 2024-2028, as well as historical data from 2018-2022 for the following segments.
- Type
- Specialty oils
- Specialty fats
- Application
- Food and Beverage
- Cosmetics
- Pharmaceuticals
- Animal Feed
- Distribution Channel
- B2B
- Supermarkets
- Online Retail
- Specialty Stores
- Consumer Segment
- Food Manufacturers
- Cosmetic Industry
- General Consumers
- Geography
- North America
- US
- Canada
- Europe
- France
- Germany
- Italy
- UK
- APAC
- China
- India
- Japan
- South Korea
- Rest of World (ROW)
- North America
By Type Insights
The specialty oils segment is estimated to witness significant growth during the forecast period.
Specialty fats and oils, including those derived from sustainable palm oil, shea butter, canola, and other sources, continue to gain popularity due to their unique properties and applications. Sustainability is a significant factor in the production of palm oil, ensuring its ethical sourcing and minimal environmental impact. The rheological properties of these specialty oils are crucial for various industries, including cosmetics, where interesterified shea butter is valued for its emulsion stability and melting point determination. Canola oil undergoes refining to enhance its functionality and improve its triglyceride profile, making it suitable for industrial oil applications and cosmetic oil formulations.
Specialty oil blends are formulated to cater to specific industries, such as food processing, where they act as activators or additives. The hydrolysis process is used to produce fractionated palm oil, which exhibits crystallization behavior desirable for certain applications. Hydrogenated cottonseed oil and other hydrogenated oils undergo this process to increase their stability and melting point. Nutritional labeling requirements necessitate accurate determination of saponification value and peroxide value to ensure product quality and shelf life prediction. Coconut oil fractionation and polymorphism analysis are essential techniques for understanding the oxidative stability and triglyceride profile of these oils.
Edible oil processing involves careful control of oil quality to maintain the desired fatty acid composition and adhere to food safety regulations. Olive oil extraction and sustainable oil production methods further contribute to the market's evolution, ensuring the availability of high-quality specialty oils for various industries.
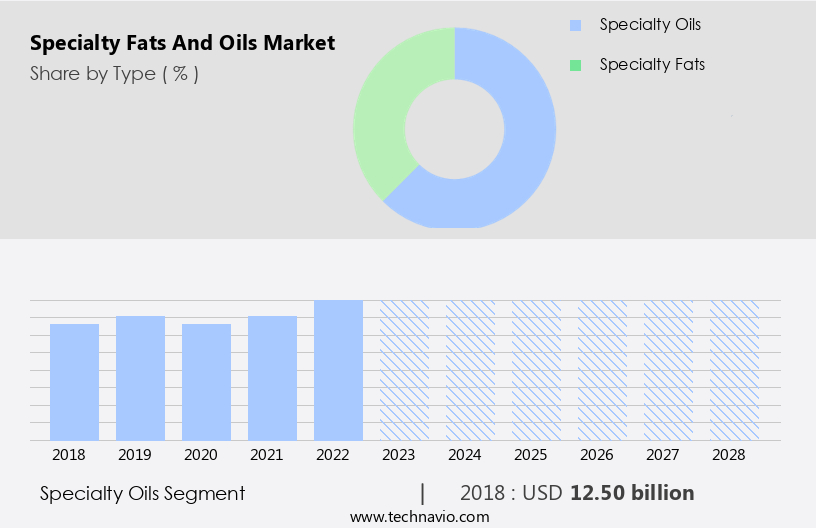
The Specialty oils segment was valued at USD 12.50 billion in 2018 and showed a gradual increase during the forecast period.
Regional Analysis
North America is estimated to contribute 48% to the growth of the global market during the forecast period.Technavio’s analysts have elaborately explained the regional trends and drivers that shape the market during the forecast period.
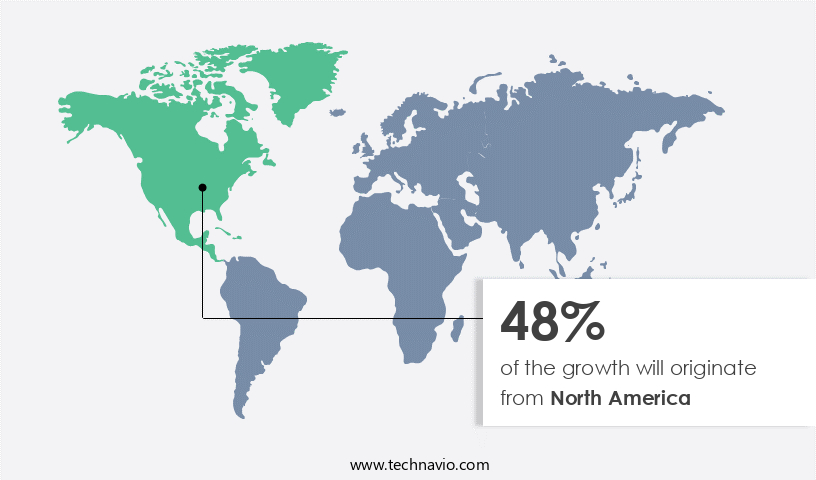
The market in North America is witnessing notable expansion due to escalating demand for healthier alternatives and functional ingredients in the food and beverage industry. Consumers are becoming more conscious of health concerns linked to trans fats, leading to a growing preference for palm oil, interesterified shea butter, and other specialty fats with lower saturated fat content and no trans fats. This trend aligns with the industry's shift towards more natural and sustainable ingredients, fueling the demand for specialty fats and oils in bakery, confectionery, and dairy applications. Major players are innovating to cater to specific market needs, introducing products like cocoa butter substitutes, specialized shortenings, and emulsifiers that improve texture, taste, and shelf life.
Palm oil sustainability and rheological properties are crucial factors in the production process, while canola oil refining and hydrolysis processes are employed to create specialty oil blends. Melting point determination, emulsion stability, and saponification value are essential quality control measures, while lipid oxidation and peroxide value assessment ensure oxidative stability. Coconut oil fractionation, crystallization behavior, and polymorphism analysis are essential for understanding the triglyceride profile and optimizing industrial oil applications. Hydrogenated cottonseed oil and fractionated palm oil are popular choices for their versatility and stability. Nutritional labeling and food safety regulations are critical considerations, with a focus on sustainable oil production and minimizing the environmental impact.
The market is further driven by the growing demand for cosmetic oil formulations and edible oil processing, with a focus on olive oil extraction and fatty acid composition.
Market Dynamics
Our researchers analyzed the data with 2023 as the base year, along with the key drivers, trends, and challenges. A holistic analysis of drivers will help companies refine their marketing strategies to gain a competitive advantage.
What are the key market drivers leading to the rise in the adoption of Specialty Fats And Oils Industry?
- The food processing industry's growth is the primary market driver, given its significant contribution to the economy and increasing consumer demand for convenient and processed food products.
- The market experiences significant growth due to the expanding food processing industry. With urbanization and population growth, there is a rising demand for convenient, long-lasting, and flavorful processed food products. Specialty fats and oils are vital components in food manufacturing, contributing to the texture, stability, and mouthfeel of various applications such as baked goods, snacks, sauces, and ready-to-eat meals. These fats and oils replace trans fats and unhealthy saturated fats, catering to consumers' increasing health and nutrition concerns.
- The market's growth is further fueled by the trend towards clean labeling and sustainable oil production, as manufacturers strive to meet evolving consumer preferences.
What are the market trends shaping the Specialty Fats And Oils Industry?
- The increasing preference for natural cosmetic products represents a significant market trend. This growing demand reflects consumers' increasing awareness and concern for health and the environment.
- The market has experienced significant growth due to the increasing demand for natural ingredients in the beauty and personal care industries. Factors such as the expanding millennial population, particularly in Asia Pacific, the rise in online presence and Internet usage, increasing per capita income, and heightened awareness of sustainable and eco-friendly products have fueled this trend. Palm and olive oils, among other specialty fats and oils, have gained popularity due to their natural properties. Palm oil sustainability is a critical consideration in the market, with companies focusing on sourcing certified sustainable palm oil to meet consumer demand for environmentally responsible products.
- Rheological properties of specialty oils, such as melting point determination and iodine value, are essential for formulators in creating high-performing cosmetic and personal care products. Specialty oil blends, including interesterified shea butter, offer unique benefits, such as improved texture and enhanced skin penetration. Canola oil refining is another area of focus, with advancements in refining techniques enabling the production of higher quality, more stable specialty oils. Overall, the market is driven by the demand for natural, sustainable, and high-performing ingredients in the beauty and personal care industries.
What challenges does the Specialty Fats And Oils Industry face during its growth?
- The volatility in oil crop prices poses a significant challenge to the industry's growth trajectory.
- Specialty fats and oils are essential components in various industrial and cosmetic applications. However, the production of these oils faces challenges due to volatile oil crop prices caused by weather conditions and political instability, affecting the output of oil crop producers and limiting oil supply to manufacturers. Moreover, restricted access to funding and a lack of information about modern agricultural practices and farm management skills contribute to decreasing specialty oil production levels worldwide. Ineffective insect and crop disease management techniques are estimated to cause the loss of up to 30% of crops in key countries. The declining availability of land suitable for oil-producing crops in Asia Pacific further impedes the growth of the market.
- Oil quality control is crucial to prevent lipid oxidation, ensuring the stability of oil-based emulsions in industrial applications and cosmetic oil formulations. Effective management of these challenges is necessary to maintain the quality and consistency of specialty fats and oils in the market.
Exclusive Customer Landscape
The specialty fats and oils market forecasting report includes the adoption lifecycle of the market, covering from the innovator’s stage to the laggard’s stage. It focuses on adoption rates in different regions based on penetration. Furthermore, the specialty fats and oils market report also includes key purchase criteria and drivers of price sensitivity to help companies evaluate and develop their market growth analysis strategies.

Customer Landscape
Key Companies & Market Insights
Companies are implementing various strategies, such as strategic alliances, specialty fats and oils market forecast, partnerships, mergers and acquisitions, geographical expansion, and product/service launches, to enhance their presence in the industry.
3F Industries Ltd. - This company specializes in the production and distribution of various fats and oils, including frying oils, emulsified oils, corn oil, soybean oil, safflower oil, palm oil, and sunflower oil. These high-quality offerings cater to diverse industries and applications.
The industry research and growth report includes detailed analyses of the competitive landscape of the market and information about key companies, including:
- 3F Industries Ltd.
- AAK AB
- Adams Group
- Archer Daniels Midland Co.
- Bunge Ltd.
- Cargill Inc.
- De Wit Speciality Oils
- Fuji Vegetable Oil Inc.
- IFFCO Group
- IOI Corp. Berhad
- Liberty Oil Mills Ltd.
- Musim Mas Group
- Nisshin OilliO Group Ltd.
- Olea Fats Inc.
- Puratos
- RGE Pte Ltd.
- The Hain Celestial Group Inc.
- Ventura Foods LLC
- Wilmar International Ltd.
Qualitative and quantitative analysis of companies has been conducted to help clients understand the wider business environment as well as the strengths and weaknesses of key industry players. Data is qualitatively analyzed to categorize companies as pure play, category-focused, industry-focused, and diversified; it is quantitatively analyzed to categorize companies as dominant, leading, strong, tentative, and weak.
Recent Development and News in Specialty Fats And Oils Market
- In January 2024, Archer Daniels Midland Company (ADM) announced the launch of its new specialty oil, ADMSOY Sustainable Palm Olein, produced using 100% sustainable palm oil certified by the Round Table on Sustainable Palm Oil (RSPO). (ADM Press Release)
- In March 2024, DuPont Nutrition & Biosciences and Cargill signed a strategic partnership to co-develop and commercialize sustainable specialty lipids for food and beverage applications. (DuPont Nutrition & Biosciences Press Release)
- In May 2024, Wilmar International, the world's largest palm oil processing company, completed the acquisition of French specialty fats producer, Darling Ingredients' European specialty fats business, expanding its European footprint. (Wilmar International Press Release)
- In April 2025, the European Commission approved the use of microbial oils as a novel food ingredient, opening up new opportunities for producers in the market. (European Commission Press Release)
Research Analyst Overview
- The market encompasses a diverse range of products derived from various sources, including soybean oil processing and palm oil derivatives. Byproduct utilization is a key trend, with production efficiency gains driving the conversion of waste streams into valuable components, such as biodiesel feedstock and cosmetic ingredients. Lipid metabolism research continues to uncover new functional properties, leading to the development of textured food applications and rheology modifiers. Sustainable sourcing and waste reduction are paramount, with sunflower oil extraction and glyceride analysis playing crucial roles.
- Process optimization and quality assurance are essential for maintaining oil stability and flavor stability in food applications. Industrial lubricants and animal feed ingredients also find significant demand in this market. Emulsifier selection and oil refining technology are critical for ensuring product performance and meeting evolving consumer health and wellness expectations.
Dive into Technavio’s robust research methodology, blending expert interviews, extensive data synthesis, and validated models for unparalleled Specialty Fats And Oils Market insights. See full methodology.
|
Market Scope |
|
|
Report Coverage |
Details |
|
Page number |
158 |
|
Base year |
2023 |
|
Historic period |
2018-2022 |
|
Forecast period |
2024-2028 |
|
Growth momentum & CAGR |
Accelerate at a CAGR of 5.7% |
|
Market growth 2024-2028 |
USD 5.2 billion |
|
Market structure |
Fragmented |
|
YoY growth 2023-2024(%) |
5.5 |
|
Key countries |
US, China, Germany, UK, France, Japan, Canada, India, South Korea, and Italy |
|
Competitive landscape |
Leading Companies, Market Positioning of Companies, Competitive Strategies, and Industry Risks |
What are the Key Data Covered in this Specialty Fats And Oils Market Research and Growth Report?
- CAGR of the Specialty Fats And Oils industry during the forecast period
- Detailed information on factors that will drive the growth and forecasting between 2024 and 2028
- Precise estimation of the size of the market and its contribution of the industry in focus to the parent market
- Accurate predictions about upcoming growth and trends and changes in consumer behaviour
- Growth of the market across North America, Europe, APAC, Middle East and Africa, and South America
- Thorough analysis of the market’s competitive landscape and detailed information about companies
- Comprehensive analysis of factors that will challenge the specialty fats and oils market growth of industry companies
We can help! Our analysts can customize this specialty fats and oils market research report to meet your requirements.
 RIA -
RIA - 
