Enjoy complimentary customisation on priority with our Enterprise License!
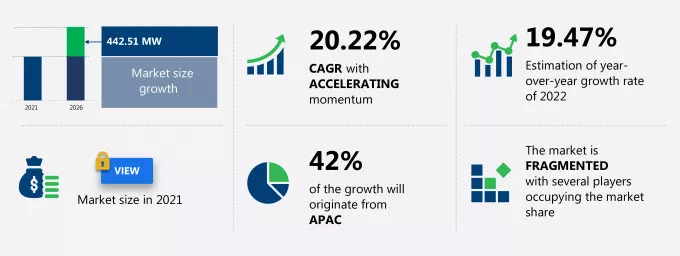
The stationary fuel cell market share is expected to increase to 442.51 megawatts from 2021 to 2026, and the market's growth momentum will accelerate at a CAGR of 20.22%. This stationary fuel cell market research report provides valuable insights on the post COVID-19 impact on the market, which will help companies evaluate their business approaches. Furthermore, this report extensively covers stationary fuel cell market segmentation by application (prime power, combined heat and power, and others) and geography (North America, APAC, Europe, South America, and MEA).
Download the Free Report Sample to Unlock the Stationary Fuel Cell Market Size for the Forecast Period and Other Important Statistics
The stationary fuel cell market report also offers information on several market vendors, including AFC Energy PLC, Aisin Corp., Altergy Systems, AVL List GmbH, Ballard Power Systems Inc., Bloom Energy Corp., Cellkraft AB, Ceres Power Holdings plc, Convion Ltd., and Doosan Corp. among others.
The rising energy consumption is notably driving the stationary fuel cell market growth, although factors such as high fuel cell cost may impede market growth. Our research analysts have studied the historical data and deduced the key market drivers and the COVID-19 pandemic impact on the stationary fuel cell industry. The holistic analysis of the drivers will help in deducing end goals and refining marketing strategies to gain a competitive edge.
Key Stationary Fuel Cell Market Driver
Key Stationary Fuel Cell Market Trend
Key Stationary Fuel Cell Market Challenge
This stationary fuel cell market analysis report also provides detailed information on other upcoming trends and challenges that will have a far-reaching effect on the market growth. The actionable insights on the trends and challenges will help companies evaluate and develop growth strategies for 2022-2026.
Technavio categorizes the stationary fuel cell market as a part of the global renewable electricity market. Our research report has extensively covered external factors influencing the parent market growth potential in the coming years, which will determine the levels of growth of the stationary fuel cell market during the forecast period.
The report analyzes the market's competitive landscape and offers information on several market vendors, including:
This statistical study of the stationary fuel cell market encompasses successful business strategies deployed by the key vendors. The stationary fuel cell market is fragmented and the vendors are deploying organic and inorganic growth strategies to compete in the market.
To make the most of the opportunities and recover from post COVID-19 impact, market vendors should focus more on the growth prospects in the fast-growing segments, while maintaining their positions in the slow-growing segments.
The stationary fuel cell market forecast report offers in-depth insights into key vendor profiles. The profiles include information on the production, sustainability, and prospects of the leading companies.
Our report provides extensive information on the value chain analysis for the stationary fuel cell market, which vendors can leverage to gain a competitive advantage during the forecast period. The end-to-end understanding of the value chain is essential in profit margin optimization and evaluation of business strategies. The data available in our value chain analysis segment can help vendors drive costs and enhance customer services during the forecast period.
The value chain of the global renewable electricity market includes the following core components:
The report has further elucidated on other innovative approaches being followed by manufacturers to ensure a sustainable market presence.
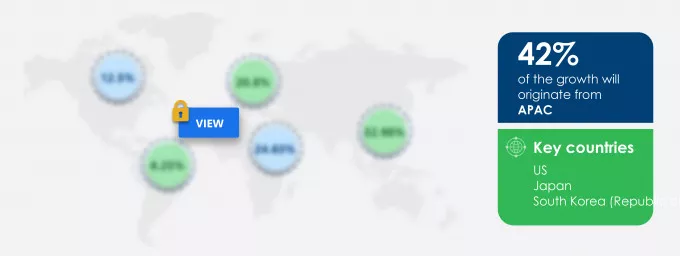
For more insights on the market share of various regions Request for a FREE sample now!
42% of the market's growth will originate from APAC during the forecast period. Japan, South Korea (Republic of Korea), and China are the key markets for stationary fuel cells in APAC. Market growth in this region will be faster than the growth of the market in other regions.
The increase in investment in fuel cells and advances in technology will facilitate the stationary fuel cell market growth in APAC over the forecast period. This market research report entails detailed information on the competitive intelligence, marketing gaps, and regional opportunities in store for vendors, which will assist in creating efficient business plans.
COVID Impact and Recovery Analysis
The outbreak of COVID-19 in APAC slowed down the growth rate of the transport industry, which negatively impacted the regional stationary fuel cell market in 2020. However, the reduction in the number of new COVID-19 infections due to the increased COVID-19 vaccination rates in 2021 resulted in the lifting of the lockdowns and travel restrictions. Thus, China, Japan, and South Korea resumed their production of fuel cells and planned projects. This will, in turn, increase the demand for stationary fuels cells and lead the regional market to grow during the forecast period.

To gain further insights on the market contribution of various segments Request for a FREE sample
The stationary fuel cell market share growth by the prime power segment will be significant during the forecast period. A decentralized combined heat and power system (CHP) provides the benefit of avoiding T&D losses and allows for the usage of superior technologies such as fuel cells. As businesses, utilities, and homes shift to clean energy sources for meeting their power needs, the support policies and incentives given by the government to encourage the adoption of stationary fuel cells are expected to drive the market growth through this segment in the forecast years.
This report provides an accurate prediction of the contribution of all the segments to the growth of the stationary fuel cell market size and actionable market insights on post COVID-19 impact on each segment.
|
Stationary Fuel Cell Market Scope |
|
|
Report Coverage |
Details |
|
Page number |
120 |
|
Base year |
2021 |
|
Forecast period |
2022-2026 |
|
Growth momentum & CAGR |
Accelerate at a CAGR of 20.22% |
|
Market growth 2022-2026 |
442.51 MW |
|
Market structure |
Fragmented |
|
YoY growth (%) |
19.47 |
|
Regional analysis |
North America, APAC, Europe, South America, and MEA |
|
Performing market contribution |
APAC at 42% |
|
Key consumer countries |
US, Japan, South Korea (Republic of Korea), Germany, and China |
|
Competitive landscape |
Leading companies, Competitive strategies, Consumer engagement scope |
|
Key companies profiled |
AFC Energy PLC, Aisin Corp., Altergy Systems, AVL List GmbH, Ballard Power Systems Inc., Bloom Energy Corp., Cellkraft AB, Ceres Power Holdings plc, Convion Ltd., and Doosan Corp. |
|
Market dynamics |
Parent market analysis, Market growth inducers and obstacles, Fast-growing and slow-growing segment analysis, COVID 19 impact and recovery analysis and future consumer dynamics, Market condition analysis for forecast period |
|
Customization purview |
If our report has not included the data that you are looking for, you can reach out to our analysts and get segments customized. |
We can help! Our analysts can customize this report to meet your requirements. Get in touch
***1. Executive Summary
**1.1 Market Overview
*Exhibit 01: Key Finding 1
*Exhibit 02: Key Finding 1
*Exhibit 03: Key Finding 2
*Exhibit 04: Key Finding 3
*Exhibit 05: Key Finding 4
*Exhibit 06: Key Finding 5
*Exhibit 07: Key Finding 5
***2. Market Landscape
**2.1 Market ecosystem
*Exhibit 08: Parent market
*Exhibit 09: Market characteristics
**2.2 Value chain analysis
*Exhibit 10: Value chain analysis: Renewable electricity
*2.2.1 Inputs
*2.2.2 Electricity generation
*2.2.3 Electricity transmission
*2.2.4 Electricity distribution
*2.2.5 End-users
***3. Market Sizing
**3.1 Market segment analysis
*Exhibit 11: Market segments
**3.2 Market size 2021
**3.3 Market definition
*Exhibit 12: Offerings of vendors included in the market definition
**3.4 Market outlook: Forecast for 2021 - 2026
*Exhibit 13: Global - Market size and forecast 2021 - 2026 (MW)
*Exhibit 14: Global market: Year-over-year growth 2021 - 2026 (%)
***4. Five Forces Analysis
**4.1 Five Forces Summary
*Exhibit 15: Five forces analysis 2021 & 2026
**4.2 Bargaining power of buyers
*Exhibit 16: Bargaining power of buyers
**4.3 Bargaining power of suppliers
*Exhibit 17: Bargaining power of suppliers
**4.4 Threat of new entrants
*Exhibit 18: Threat of new entrants
**4.5 Threat of substitutes
*Exhibit 19: Threat of substitutes
**4.6 Threat of rivalry
*Exhibit 20: Threat of rivalry
**4.7 Market condition
*Exhibit 21: Market condition - Five forces 2021
***5 Market Segmentation by Application
**5.1 Market segments
*Exhibit 22: Application - Market share 2021-2026 (%)
**5.2 Comparison by Application
*Exhibit 23: Comparison by Application
**5.3 Prime power - Market size and forecast 2021-2026
*Exhibit 24: Prime power - Market size and forecast 2021-2026 (MW)
*Exhibit 25: Prime power - Year-over-year growth 2021-2026 (%)
**5.4 Combined heat and power - Market size and forecast 2021-2026
*Exhibit 26: Combined heat and power - Market size and forecast 2021-2026 (MW)
*Exhibit 27: Combined heat and power - Year-over-year growth 2021-2026 (%)
**5.5 Others - Market size and forecast 2021-2026
*Exhibit 28: Others - Market size and forecast 2021-2026 (MW)
*Exhibit 29: Others - Year-over-year growth 2021-2026 (%)
**5.6 Market opportunity by Application
*Exhibit 30: Market opportunity by Application
***6. Customer landscape
**6.1 Overview
*Technavio’s customer landscape matrix comparing Drivers or price sensitivity, Adoption lifecycle, importance in customer price basket, Adoption rate and Key purchase criteria
*Exhibit 31: ?Customer landscape?
***7. Geographic Landscape
**7.1 Geographic segmentation
*Exhibit 32: Market share by geography 2021-2026 (%)
**7.2 Geographic comparison
*Exhibit 33: Geographic comparison
**7.3 North America - Market size and forecast 2021-2026
*Exhibit 34: North America - Market size and forecast 2021-2026 (MW)
*Exhibit 35: North America - Year-over-year growth 2021-2026 (%)
**7.4 APAC - Market size and forecast 2021-2026
*Exhibit 36: APAC - Market size and forecast 2021-2026 (MW)
*Exhibit 37: APAC - Year-over-year growth 2021-2026 (%)
**7.5 Europe - Market size and forecast 2021-2026
*Exhibit 38: Europe - Market size and forecast 2021-2026 (MW)
*Exhibit 39: Europe - Year-over-year growth 2021-2026 (%)
**7.6 South America - Market size and forecast 2021-2026
*Exhibit 40: South America - Market size and forecast 2021-2026 (MW)
*Exhibit 41: South America - Year-over-year growth 2021-2026 (%)
**7.7 MEA - Market size and forecast 2021-2026
*Exhibit 42: MEA - Market size and forecast 2021-2026 (MW)
*Exhibit 43: MEA - Year-over-year growth 2021-2026 (%)
**7.8 Key leading countries
*Exhibit 44: Key leading countries
**7.9 Market opportunity by geography
*Exhibit 45: Market opportunity by geography ($ billion)
***8. Drivers, Challenges, and Trends
**8.1 Market drivers
*8.1.1 Rising energy consumption
*8.1.2 Growing adoption of fuel cells for combined heat and power
*8.1.3 Favorable government policies
**8.2 Market challenges
*8.2.1 High fuel cell cost
*8.2.2 Competition from alternative technologies
*8.2.3 Declining lithium-ion battery price
*Exhibit 46: Impact of drivers and challenges
**8.3 Market trends
*8.3.1 Growing preference for self-generation
*8.3.2 Increasing R&D funding for fuel cell development
*8.3.3 Development of zero energy homes
***9. Vendor Landscape
**9.1 Overview
*Exhibit 47: Vendor landscape
*The potential for the disruption of the market landscape was moderate in 2020, and its threat is expected to remain unchanged by 2025.
**9.2 Landscape disruption
*Exhibit 48: ?Landscape disruption?
*Exhibit 49: Industry risks
***10. Vendor Analysis
**10.1 Vendors covered
*Exhibit 50: Vendors covered
**10.2 Market positioning of vendors
*Exhibit 51: ?Market positioning of vendors?
**10.3 AFC Energy PLC
*Exhibit 52: AFC Energy PLC - Overview
*Exhibit 53: AFC Energy PLC - Business segments
*Exhibit 54: AFC Energy PLC- Key news
*Exhibit 55: AFC Energy PLC - Key offerings
*Exhibit 56: AFC Energy PLC - Segment focus
**10.4 Aisin Corp.
*Exhibit 57: Aisin Corp. - Overview
*Exhibit 58: Aisin Corp. - Business segments
*Exhibit 59: Aisin Corp. - Key offerings
*Exhibit 60: Aisin Corp. - Segment focus
**10.5 Altergy Systems
*Exhibit 61: Altergy Systems - Overview
*Exhibit 62: Altergy Systems - Product and service
*Exhibit 63: Altergy Systems - Key offerings
**10.6 AVL List GmbH
*Exhibit 64: AVL List GmbH - Overview
*Exhibit 65: AVL List GmbH - Product and service
*Exhibit 66: AVL List GmbH - Key offerings
**10.7 Ballard Power Systems Inc.
*Exhibit 67: Ballard Power Systems Inc. - Overview
*Exhibit 68: Ballard Power Systems Inc. - Business segments
*Exhibit 69: Ballard Power Systems Inc.-Key news
*Exhibit 70: Ballard Power Systems Inc. - Key offerings
*Exhibit 71: Ballard Power Systems Inc. - Segment focus
**10.8 Bloom Energy Corp.
*Exhibit 72: Bloom Energy Corp. - Overview
*Exhibit 73: Bloom Energy Corp. - Product and service
*Exhibit 74: Bloom Energy Corp.- Key news
*Exhibit 75: Bloom Energy Corp. - Key offerings
**10.9 Cellkraft AB
*Exhibit 76: Cellkraft AB - Overview
*Exhibit 77: Cellkraft AB - Business segments
*Exhibit 78: Cellkraft AB - Key offerings
*Exhibit 79: Cellkraft AB - Segment focus
**10.10 Ceres Power Holdings plc
*Exhibit 80: Ceres Power Holdings plc - Overview
*Exhibit 81: Ceres Power Holdings plc - Business segments
*Exhibit 82: Ceres Power Holdings Plc.- Key news
*Exhibit 83: Ceres Power Holdings plc - Key offerings
*Exhibit 84: Ceres Power Holdings plc - Segment focus
**10.11 Convion Ltd.
*Exhibit 85: Convion Ltd. - Overview
*Exhibit 86: Convion Ltd. - Business segments
*Exhibit 87: Convion Ltd.- Key news
*Exhibit 88: Convion Ltd. - Key offerings
*Exhibit 89: Convion Ltd. - Segment focus
**10.12 Doosan Corp.
*Exhibit 90: Doosan Corp. - Overview
*Exhibit 91: Doosan Corp. - Business segments
*Exhibit 92: Doosan Corp.- Key news
*Exhibit 93: Doosan Corp. - Key offerings
*Exhibit 94: Doosan Corp. - Segment focus
***11. Appendix
**11.1 Scope of the report
*11.1.1 ????Market definition
*11.1.2 ????Objectives
*11.1.3 Notes and Caveats
**11.2 Currency conversion rates for US$
*Exhibit 95: ?Currency conversion rates for US$?
**11.3 Research Methodology
*Exhibit 96: ?Research Methodology
*Exhibit 97: ??Validation techniques employed for market sizing?
*Exhibit 98: ??Information sources
**11.4 List of abbreviations
*Exhibit 99: List of abbreviations
Get lifetime access to our
Technavio Insights


