Enjoy complimentary customisation on priority with our Enterprise License!
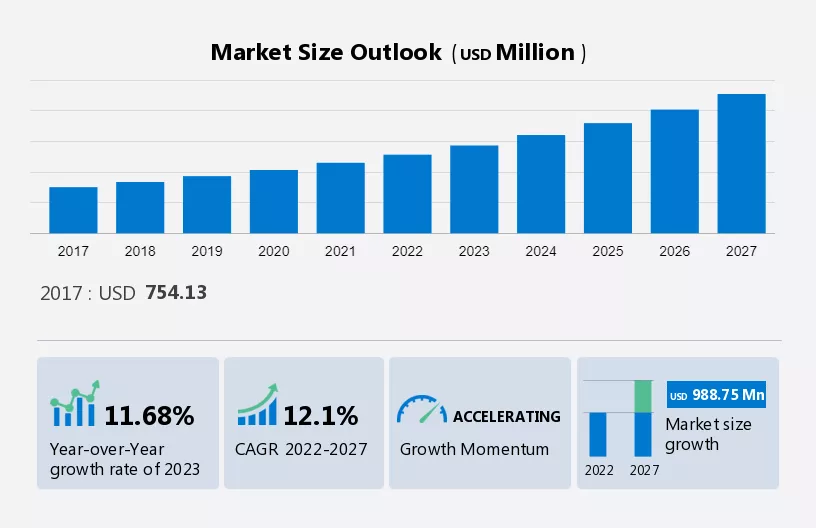
The sustainability management software market is estimated to grow by USD 988.75 million at a CAGR of 12.1% between 2022 and 2027. The growth of the market depends on several factors, including the shift toward green initiatives, the need for better brand positioning and operational efficiency, and the increased demand across enterprises.
To learn more about this report, Download Report Sample
Our researchers analyzed the data with 2022 as the base year, along with the key drivers, trends, and challenges. A holistic analysis of drivers will help companies refine their marketing strategies to gain a competitive advantage.
The shift toward green initiatives is notably driving market growth. Using green energy is considered to be the most effective method of countering the challenges of GHG emissions. Green energy generation involves the use of renewable resources as raw materials for energy generation. Sustainability management software provides a detailed report on the amount of CO2 generated per unit of production by organizations. It helps reduce GHG emissions by allowing users to monitor, measure, plan, store, and report carbon emission data in organizations. It also helps increase awareness about the hazards of GHG emissions and helps identify and implement efficient measures to save costs by reducing electricity and heating and cooling bills.
Countries such as China accounted for more than half of the CO2 emissions in Asia in 2020, followed by India. The emission of such destructive gases depletes the ozone layer in the upper atmosphere, which blocks the ultraviolet radiation from the sun. To curb such growing GHG emission levels, many industries are adopting sustainability management software, which is driving the growth of the market in focus.
The increasing adoption of cloud-based software is a major trend in the market. Cloud-based software typically offers access to the application via web-based browsers where the admin defines the access level across the organization, and the user can log in to the management system simultaneously from any Internet-enabled device. Often, cloud-based energy management software provides users with mobile apps to make it easier to use the software on smartphones and tablets.
Another benefit of cloud-based sustainability management software is scalability. A cloud-based system is designed to be flexible with expanding capacity. Also, typically, the cost of cloud-based sustainability management software is often based on the number of users and storage requirements.
Cloud-based sustainability management software has always been beneficial for SMEs and manufacturing plants in reducing their IT expenses. When it comes to cloud-based solutions, the vendor is responsible for managing the software, providing updates across the system, and taking care of technical glitches, bugs, and other issues. Easy scalability is another major benefit of the software. In addition, the deployment of these solutions does not require wires, programmable logic controllers (PLCs), drawings, or operator interface equipment. Thus, the increasing adoption will foster the growth of the market trends during the forecast period.
Lack of standards, training, and development is a major challenge impeding the market growth. Advancements in technology and a decline in electronic product costs are encouraging customers to buy new products frequently. This is leading to an increased level of e-waste, which is potentially hazardous for the environment. For example, many manufacturers of electronic products in South America sell them with little information at their disposal, which adds to CO2 or carbon emissions.
Many customers are ignorant of the negative effects of the improper disposal of electronic products and do not know about e-waste management. Many businesses are also unaware of the use of carbon management software. Unlike developed countries, many developing countries, such as India, do not have proper standards regarding carbon emissions. As a result, in developing countries, there are no limitations on carbon or CO2 emissions, and no measures are taken to manage them. Hence, the lack of standards, training, and development is hampering the growth of the market, which is expected to continue during the forecast period as well.
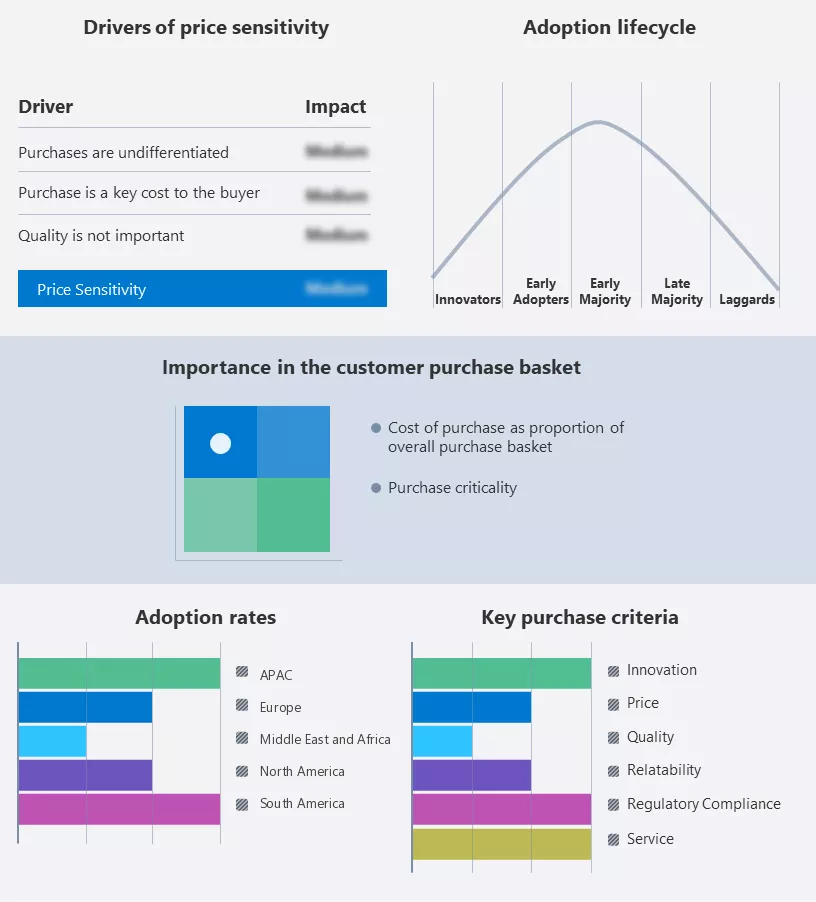
The market growth analysis report includes the adoption lifecycle of the market, covering from the innovator’s stage to the laggard’s stage. It focuses on adoption rates in different regions based on penetration. Furthermore, the market forecasting report also includes key purchase criteria and drivers of price sensitivity to help companies evaluate and develop their growth strategies.
Customer Landscape
Companies are implementing various strategies, such as strategic alliances, partnerships, mergers and acquisitions, geographical expansion, and product/service launches, to enhance their presence in the market.
International Business Machines Corp. -The company's key offerings include sustainability management software.
The market research and growth report also includes detailed analyses of the competitive landscape of the market and information about 15 market Companies, including:
Qualitative and quantitative analysis of Companies has been conducted to help clients understand the wider business environment as well as the strengths and weaknesses of key market players. Data is qualitatively analyzed to categorize Companies as pure play, category-focused, industry-focused, and diversified; it is quantitatively analyzed to categorize Companies as dominant, leading, strong, tentative, and weak.
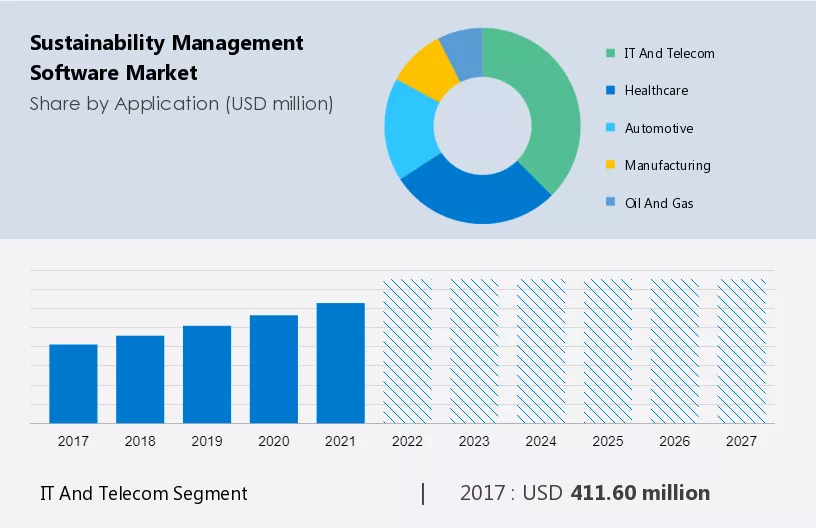
The market share growth by the IT and telecom segment will be significant during the forecast period. Currently, information and communications technology (ICT) is responsible for about twice the level of CO2 emissions as compared to the much more heavily scrutinized aviation sector, and the fast growth in global data traffic will increase the emission of CO2 by 2040.
Get a glance at the market contribution of various segments Request a PDF Sample
The IT and telecom segment shows a gradual increase in the market share of USD 411.60 million in 2017 and continued to grow until 2021. Within the ICT sector, telecommunications are responsible for 1.6% of total global CO2 emissions. Most of the telco firms' emissions are caused by upstream and downstream operations, like the energy use of their suppliers. There are currently no uniform standards or rules used by telco firms to track these environmental concerns. Data centers increasing energy consumption is a glaring indicator of the ICT industry's expanding environmental effect. There are clear indications that the telecommunication sector is taking steps to lessen its direct and indirect carbon footprint seriously. By the end of this decade, the majority of the major telcos have committed to reducing the energy used per unit of traffic by around 70%. Therefore, to monitor carbon footprints ICT industry is increasingly adopting the software to manage their emissions and comply with climate regulations. Hence, the increasing CO2 emissions from the IT and telecom industry will propel the demand which in turn will spur the growth of the market in focus through the IT and telecom sector during the forecast period.
For more insights on the market share of various regions Request PDF Sample now!
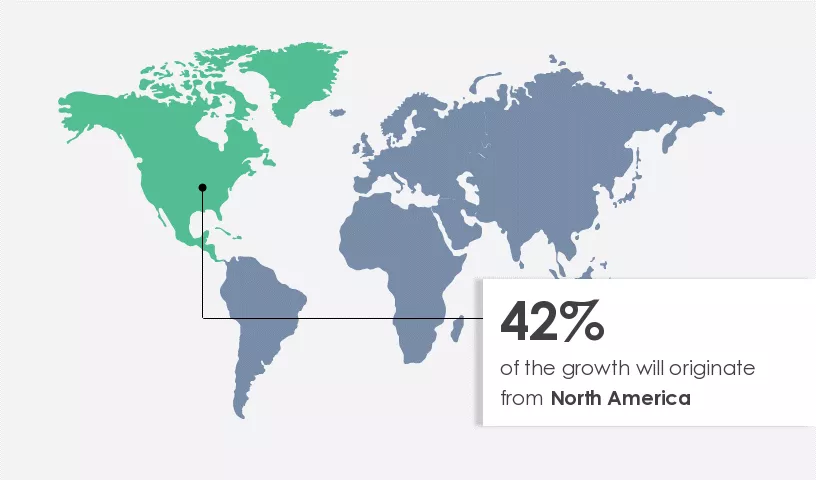
North America is estimated to contribute 42% to the growth of the global market during the forecast period. Technavio’s analysts have elaborately explained the regional trends and drivers that shape the market during the forecast period.
North America is the largest geographical segment of the global sustainability software management market and will continue to remain the largest segment during the forecast period. Factors such as the presence of a strong economy, the implementation of the Clean Air Act, technological advances in clean air technology, and the presence of several industrial clean air technology companies make North America the leading regional segment in the market. The significant decline in industrial emissions can also be attributed to the presence of stringent regulations in this country to curb industrial emissions, which will also enhance the need for sustainability management software.
The presence of the EPA in the US, which aims at improving air quality by reducing air pollution, is one of the major factors driving the market in the US. In Canada, the Air Quality Management System (AQMS) continuously monitors emission levels and provides a framework to protect human health and the environment from harmful air pollutants. Additionally, the presence of stringent regulations to curb industrial emissions is expected to augment the growth of the market in North America significantly during the forecast period.
The Sustainability Management Software Market thrives on its ability to handle vast databases, financial data, and automated management, facilitating reporting and project planning. It supports scenario and portfolio management, along with supply chain management, aligning with sustainability goals like energy savings and environmental targets. Catering to shareholders, investors, and regulatory obligations, it's crucial across sectors like manufacturing, chemicals, and oil and gas.
By de-risking supply chains and addressing resource-stressed areas, it ensures reliable and cost-efficient energy supplies. Embracing sustainable methodologies, enhances business processes and fosters competition while promoting product stewardship initiatives, demonstrating the growing importance of sustainability in driving business value.
The market growth and forecasting report forecasts market growth by revenue at global, regional & country levels and provides an analysis of the latest trends and growth opportunities from 2017 to 2027.
|
Sustainability Management Software Market Scope |
|
|
Report Coverage |
Details |
|
Page number |
175 |
|
Base year |
2022 |
|
Historic period |
2017-2021 |
|
Forecast period |
2023-2027 |
|
Growth momentum & CAGR |
Accelerate at a CAGR of 12.1% |
|
Market growth 2023-2027 |
USD 988.75 million |
|
Market structure |
Fragmented |
|
YoY growth 2022-2023(%) |
11.68 |
|
Regional analysis |
North America, Europe, APAC, South America, and Middle East and Africa |
|
Performing market contribution |
North America at 42% |
|
Key countries |
US, China, Japan, Germany, and UK |
|
Competitive landscape |
Leading Companies, Market Positioning of Companies, Competitive Strategies, and Industry Risks |
|
Key companies profiled |
Benchmark Digital Partners LLC, Dakota Software Corp., Diligent Corp., ENGIE SA, Figbytes Inc., Fortive Corp., International Business Machines Corp., Mitsubishi Electric Corp., PDS Group, Quentic GmbH, SAP SE, Schneider Electric SE, Sphera Solutions Inc., UL LLC, Urjanet Inc., VelocityEHS Holdings Inc., Wolters Kluwer NV, and LogicLadder Technologies Pvt. Ltd. |
|
Market dynamics |
Parent market analysis, Market growth inducers and obstacles, Fast-growing and slow-growing segment analysis, COVID-19 impact and recovery analysis and future consumer dynamics, Market condition analysis for the forecast period |
|
Customization purview |
If our market report has not included the data that you are looking for, you can reach out to our analysts and get segments customized. |
We can help! Our analysts can customize this report to meet your requirements. Get in touch
1 Executive Summary
2 Market Landscape
3 Market Sizing
4 Historic Market Size
5 Five Forces Analysis
6 Market Segmentation by Application
7 Market Segmentation by Deployment
8 Customer Landscape
9 Geographic Landscape
10 Drivers, Challenges, and Trends
11 Vendor Landscape
12 Vendor Analysis
13 Appendix
Get lifetime access to our
Technavio Insights


